

Key Insights
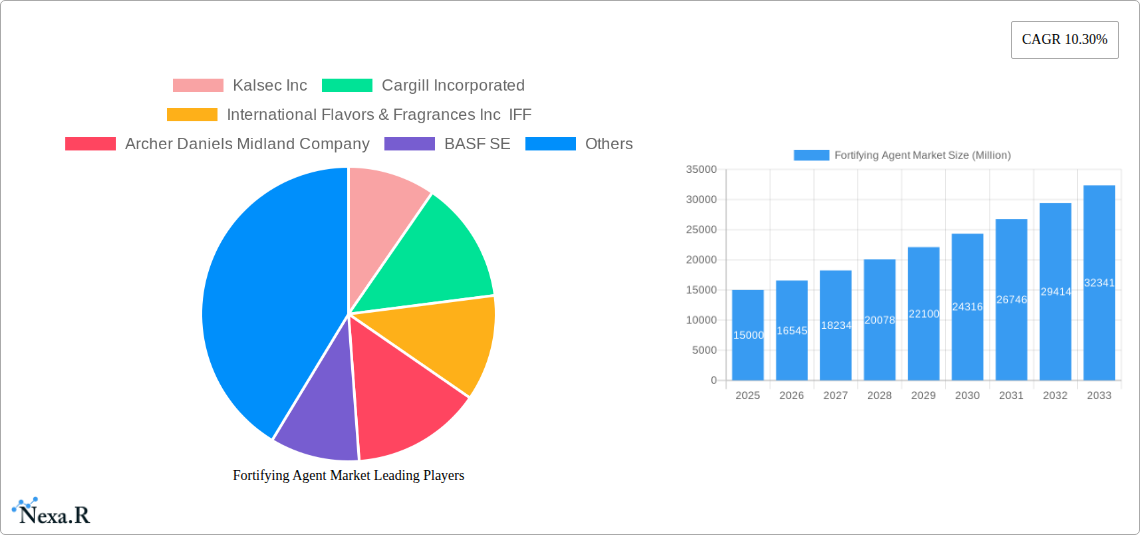
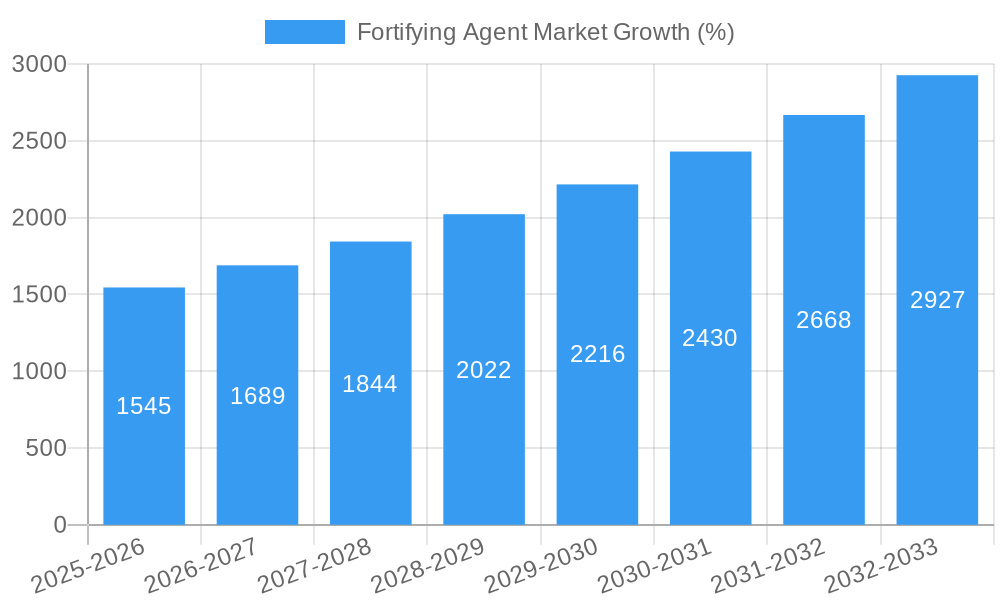
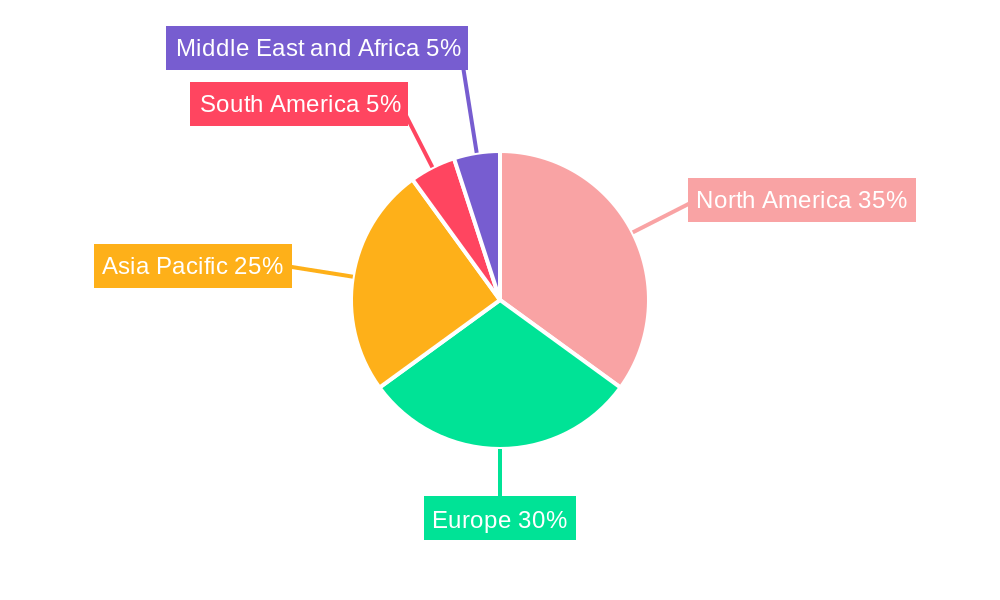
The global fortifying agent market is experiencing robust growth, driven by increasing consumer demand for nutritional food and beverages. The market, valued at approximately $XX million in 2025, is projected to expand at a compound annual growth rate (CAGR) of 10.30% from 2025 to 2033. This growth is fueled by several key factors, including rising health consciousness, increasing prevalence of nutritional deficiencies, and growing demand for fortified functional foods and dietary supplements. The rising adoption of convenient and ready-to-eat food products also contributes significantly to the market's expansion. Key segments within the market include proteins & amino acids, vitamins, and minerals, which are witnessing substantial demand across diverse applications like infant formula, dairy products, cereals, and beverages. The North American and European regions currently hold significant market share, but the Asia-Pacific region is expected to exhibit the fastest growth in the forecast period due to increasing disposable incomes and rising awareness of nutritional benefits in developing economies.
Major players like Kalsec Inc, Cargill Incorporated, and IFF are actively shaping the market landscape through product innovations, strategic partnerships, and expansion into new geographical markets. However, challenges such as stringent regulations concerning food fortification and potential health concerns associated with excessive consumption of certain fortifying agents could pose limitations to market growth. The ongoing research and development efforts to create more efficient and cost-effective fortification solutions will be critical in driving future market expansion. The market is segmented by type (proteins & amino acids, vitamins, lipids, prebiotics & probiotics, carbohydrates, minerals, others) and application (infant formula, dairy & dairy-based products, cereals & cereal-based products, fats & oils, beverages, dietary supplements, others), offering various opportunities for specialized product development and targeted marketing strategies. The market's future trajectory suggests a significant rise in demand, presenting lucrative avenues for existing and new entrants in the fortifying agent industry.
Fortifying Agent Market: A Comprehensive Market Report (2019-2033)
This comprehensive report provides an in-depth analysis of the Fortifying Agent market, encompassing market dynamics, growth trends, regional dominance, product landscape, key players, and future outlook. The study period covers 2019-2033, with 2025 as the base and estimated year. This report serves as an essential resource for industry professionals, investors, and stakeholders seeking to understand and capitalize on the opportunities within this dynamic market. The parent market is the Food and Beverage Additives Market and the child market is Nutritional Supplements Market. The total market size in 2025 is estimated at $XX Billion.
Fortifying Agent Market Market Dynamics & Structure
The Fortifying Agent market exhibits a moderately consolidated structure, with key players such as Kalsec Inc, Cargill Incorporated, International Flavors & Fragrances Inc (IFF), Archer Daniels Midland Company, BASF SE, DSM, DuPont, Eastman Chemical Company, Kemin Industries Inc, and Advanced Organic Materials S.A. holding significant market share. However, the market also features several smaller, specialized players. Technological innovation, particularly in areas like bioavailability enhancement and sustainable sourcing, is a key driver. Stringent regulatory frameworks regarding food safety and labeling influence product development and market entry. Competitive pressures stem from the availability of substitutes, including naturally occurring nutrients. The market is influenced by evolving consumer demographics, with increasing health consciousness and demand for functional foods driving growth. M&A activity has been moderate, with several strategic acquisitions aimed at expanding product portfolios and market reach. An estimated XX% of the market comprises M&A activity in the last 5 years.
- Market Concentration: Moderately Consolidated (XX% market share held by top 5 players).
- Technological Innovation: Focus on bioavailability, sustainability, and natural sourcing.
- Regulatory Framework: Stringent food safety and labeling regulations.
- Competitive Substitutes: Naturally occurring nutrients and alternative fortification methods.
- End-User Demographics: Growing health-conscious population fuels demand.
- M&A Trends: Moderate activity focusing on portfolio expansion and market access.
Fortifying Agent Market Growth Trends & Insights
The Fortifying Agent market experienced robust growth during the historical period (2019-2024), primarily driven by rising consumer awareness of nutritional deficiencies and increasing demand for fortified foods and beverages across various applications. The market is projected to maintain a healthy CAGR of XX% during the forecast period (2025-2033), propelled by factors such as growing disposable incomes, increasing urbanization, and the expanding prevalence of chronic diseases. Technological advancements, such as the development of novel fortification technologies that improve nutrient stability and bioavailability, are further contributing to market growth. Shifting consumer preferences towards convenient and functional foods, along with the growing popularity of dietary supplements, are also significant drivers. Market penetration in developing economies remains relatively low, representing a substantial untapped opportunity for growth.
Dominant Regions, Countries, or Segments in Fortifying Agent Market
North America currently holds the largest market share in the Fortifying Agent market, driven by high consumer demand for fortified foods and beverages, coupled with advanced healthcare infrastructure and strong regulatory frameworks. Europe follows closely, exhibiting steady growth. However, the Asia-Pacific region is expected to witness the highest growth rate during the forecast period, owing to increasing disposable incomes, rapid urbanization, and rising health awareness among consumers. Within the segments, the Vitamins segment dominates due to widespread use across multiple applications and growing health concerns. The Infant formula application segment drives significant demand for specific fortificants tailored to infant nutritional needs.
- Key Drivers for North America: High consumer demand, advanced healthcare infrastructure, strong regulatory frameworks.
- Key Drivers for Europe: Established food fortification regulations, high disposable incomes.
- Key Drivers for Asia-Pacific: Rising disposable incomes, increasing urbanization, growing health awareness.
- Dominant Type Segment: Vitamins (XX% market share)
- Dominant Application Segment: Infant formula (XX% market share)
Fortifying Agent Market Product Landscape
The Fortifying Agent market offers a diverse range of products, encompassing various types such as proteins & amino acids, vitamins, lipids, prebiotics & probiotics, carbohydrates, minerals, and others. Continuous innovation focuses on improving nutrient bioavailability, stability, and sensory attributes. Formulations are tailored to specific applications, addressing the unique requirements of each product category. Technological advancements in encapsulation and microencapsulation techniques enhance the efficacy and shelf life of fortificants. Unique selling propositions often include superior bioavailability, natural sourcing, and tailored nutrient profiles.
Key Drivers, Barriers & Challenges in Fortifying Agent Market
Key Drivers:
- Increasing prevalence of micronutrient deficiencies.
- Growing demand for functional foods and beverages.
- Rising health consciousness and consumer awareness.
- Stringent government regulations promoting food fortification.
Challenges & Restraints:
- High cost of certain fortificants.
- Potential for negative sensory impacts (e.g., taste, odor, texture).
- Maintaining stability and bioavailability during processing and storage.
- Stringent regulatory approvals and compliance requirements. An estimated XX% delay in product launches due to regulatory hurdles.
Emerging Opportunities in Fortifying Agent Market
- Expansion into emerging markets with high growth potential.
- Development of novel fortification technologies with improved bioavailability.
- Growing demand for clean-label and organic fortificants.
- Increasing interest in personalized nutrition and targeted fortification.
Growth Accelerators in the Fortifying Agent Market Industry
Technological breakthroughs in delivery systems, such as liposomal encapsulation, and the development of sustainable and ethically sourced fortificants will drive significant growth. Strategic partnerships between ingredient suppliers and food manufacturers will streamline innovation and market penetration. Furthermore, expansion into new applications, such as fortified pet food and plant-based alternatives, will unlock significant market opportunities.
Key Players Shaping the Fortifying Agent Market Market
- Kalsec Inc
- Cargill Incorporated
- International Flavors & Fragrances Inc (IFF)
- Archer Daniels Midland Company
- BASF SE
- DSM
- DuPont
- Eastman Chemical Company
- Kemin Industries Inc
- Advanced Organic Materials S.A
Notable Milestones in Fortifying Agent Market Sector
- 2022-Q4: Launch of a novel vitamin D3 formulation with enhanced bioavailability by Kalsec Inc.
- 2023-Q1: Acquisition of a prebiotic ingredient supplier by Cargill Incorporated.
- 2023-Q3: Introduction of a sustainable sourcing initiative for minerals by DSM.
In-Depth Fortifying Agent Market Market Outlook
The Fortifying Agent market is poised for continued strong growth, driven by sustained consumer demand, technological advancements, and expansion into new markets. Strategic partnerships and investments in research and development will be crucial for maintaining a competitive edge. Companies that focus on delivering innovative, sustainable, and efficacious products will be best positioned to capture market share in the years to come. The projected market size in 2033 is estimated at $XX Billion.
Fortifying Agent Market Segmentation
-
1. Type
- 1.1. Proteins & amino acids
- 1.2. Vitamins
- 1.3. Lipids
- 1.4. Prebiotics & probiotics
- 1.5. Carbohydrates
- 1.6. Minerals
- 1.7. Others
-
2. Application
- 2.1. Infant formula
- 2.2. Dairy & Dairy-Based Products
- 2.3. Cereals & cereal-based products
- 2.4. Fats & oils
- 2.5. Beverages
- 2.6. Dietary supplements
- 2.7. Others
Fortifying Agent Market Segmentation By Geography
-
1. North America
- 1.1. United States
- 1.2. Canada
- 1.3. Mexico
- 1.4. Rest of North America
-
2. Europe
- 2.1. United Kingdom
- 2.2. Germany
- 2.3. France
- 2.4. Russia
- 2.5. Italy
- 2.6. Spain
- 2.7. Rest of Europe
-
3. Asia Pacific
- 3.1. India
- 3.2. China
- 3.3. Japan
- 3.4. Australia
- 3.5. Rest of Asia Pacific
-
4. South America
- 4.1. Brazil
- 4.2. Argentina
- 4.3. Rest of South America
-
5. Middle East and Africa
- 5.1. South Africa
- 5.2. Saudi Arabia
- 5.3. Rest of Middle East and Africa
Fortifying Agent Market REPORT HIGHLIGHTS
| Aspects | Details |
|---|---|
| Study Period | 2019-2033 |
| Base Year | 2024 |
| Estimated Year | 2025 |
| Forecast Period | 2025-2033 |
| Historical Period | 2019-2024 |
| Growth Rate | CAGR of 10.30% from 2019-2033 |
| Segmentation |
|
Table of Contents
- 1. Introduction
- 1.1. Research Scope
- 1.2. Market Segmentation
- 1.3. Research Methodology
- 1.4. Definitions and Assumptions
- 2. Executive Summary
- 2.1. Introduction
- 3. Market Dynamics
- 3.1. Introduction
- 3.2. Market Drivers
- 3.2.1. Increasing Demand for Low-Fat and Low-Calorie Food; Increasing Product Innovation
- 3.3. Market Restrains
- 3.3.1. ; Threat of New Entrants; Bargaining Power of Buyers/Consumers; Bargaining Power of Suppliers; Threat of Substitute Products; Degree Of Competition
- 3.4. Market Trends
- 3.4.1. Rising Consumption of Vitamin-infused Foods & Beverages
- 4. Market Factor Analysis
- 4.1. Porters Five Forces
- 4.2. Supply/Value Chain
- 4.3. PESTEL analysis
- 4.4. Market Entropy
- 4.5. Patent/Trademark Analysis
- 5. Global Fortifying Agent Market Analysis, Insights and Forecast, 2019-2031
- 5.1. Market Analysis, Insights and Forecast - by Type
- 5.1.1. Proteins & amino acids
- 5.1.2. Vitamins
- 5.1.3. Lipids
- 5.1.4. Prebiotics & probiotics
- 5.1.5. Carbohydrates
- 5.1.6. Minerals
- 5.1.7. Others
- 5.2. Market Analysis, Insights and Forecast - by Application
- 5.2.1. Infant formula
- 5.2.2. Dairy & Dairy-Based Products
- 5.2.3. Cereals & cereal-based products
- 5.2.4. Fats & oils
- 5.2.5. Beverages
- 5.2.6. Dietary supplements
- 5.2.7. Others
- 5.3. Market Analysis, Insights and Forecast - by Region
- 5.3.1. North America
- 5.3.2. Europe
- 5.3.3. Asia Pacific
- 5.3.4. South America
- 5.3.5. Middle East and Africa
- 5.1. Market Analysis, Insights and Forecast - by Type
- 6. North America Fortifying Agent Market Analysis, Insights and Forecast, 2019-2031
- 6.1. Market Analysis, Insights and Forecast - by Type
- 6.1.1. Proteins & amino acids
- 6.1.2. Vitamins
- 6.1.3. Lipids
- 6.1.4. Prebiotics & probiotics
- 6.1.5. Carbohydrates
- 6.1.6. Minerals
- 6.1.7. Others
- 6.2. Market Analysis, Insights and Forecast - by Application
- 6.2.1. Infant formula
- 6.2.2. Dairy & Dairy-Based Products
- 6.2.3. Cereals & cereal-based products
- 6.2.4. Fats & oils
- 6.2.5. Beverages
- 6.2.6. Dietary supplements
- 6.2.7. Others
- 6.1. Market Analysis, Insights and Forecast - by Type
- 7. Europe Fortifying Agent Market Analysis, Insights and Forecast, 2019-2031
- 7.1. Market Analysis, Insights and Forecast - by Type
- 7.1.1. Proteins & amino acids
- 7.1.2. Vitamins
- 7.1.3. Lipids
- 7.1.4. Prebiotics & probiotics
- 7.1.5. Carbohydrates
- 7.1.6. Minerals
- 7.1.7. Others
- 7.2. Market Analysis, Insights and Forecast - by Application
- 7.2.1. Infant formula
- 7.2.2. Dairy & Dairy-Based Products
- 7.2.3. Cereals & cereal-based products
- 7.2.4. Fats & oils
- 7.2.5. Beverages
- 7.2.6. Dietary supplements
- 7.2.7. Others
- 7.1. Market Analysis, Insights and Forecast - by Type
- 8. Asia Pacific Fortifying Agent Market Analysis, Insights and Forecast, 2019-2031
- 8.1. Market Analysis, Insights and Forecast - by Type
- 8.1.1. Proteins & amino acids
- 8.1.2. Vitamins
- 8.1.3. Lipids
- 8.1.4. Prebiotics & probiotics
- 8.1.5. Carbohydrates
- 8.1.6. Minerals
- 8.1.7. Others
- 8.2. Market Analysis, Insights and Forecast - by Application
- 8.2.1. Infant formula
- 8.2.2. Dairy & Dairy-Based Products
- 8.2.3. Cereals & cereal-based products
- 8.2.4. Fats & oils
- 8.2.5. Beverages
- 8.2.6. Dietary supplements
- 8.2.7. Others
- 8.1. Market Analysis, Insights and Forecast - by Type
- 9. South America Fortifying Agent Market Analysis, Insights and Forecast, 2019-2031
- 9.1. Market Analysis, Insights and Forecast - by Type
- 9.1.1. Proteins & amino acids
- 9.1.2. Vitamins
- 9.1.3. Lipids
- 9.1.4. Prebiotics & probiotics
- 9.1.5. Carbohydrates
- 9.1.6. Minerals
- 9.1.7. Others
- 9.2. Market Analysis, Insights and Forecast - by Application
- 9.2.1. Infant formula
- 9.2.2. Dairy & Dairy-Based Products
- 9.2.3. Cereals & cereal-based products
- 9.2.4. Fats & oils
- 9.2.5. Beverages
- 9.2.6. Dietary supplements
- 9.2.7. Others
- 9.1. Market Analysis, Insights and Forecast - by Type
- 10. Middle East and Africa Fortifying Agent Market Analysis, Insights and Forecast, 2019-2031
- 10.1. Market Analysis, Insights and Forecast - by Type
- 10.1.1. Proteins & amino acids
- 10.1.2. Vitamins
- 10.1.3. Lipids
- 10.1.4. Prebiotics & probiotics
- 10.1.5. Carbohydrates
- 10.1.6. Minerals
- 10.1.7. Others
- 10.2. Market Analysis, Insights and Forecast - by Application
- 10.2.1. Infant formula
- 10.2.2. Dairy & Dairy-Based Products
- 10.2.3. Cereals & cereal-based products
- 10.2.4. Fats & oils
- 10.2.5. Beverages
- 10.2.6. Dietary supplements
- 10.2.7. Others
- 10.1. Market Analysis, Insights and Forecast - by Type
- 11. North America Fortifying Agent Market Analysis, Insights and Forecast, 2019-2031
- 11.1. Market Analysis, Insights and Forecast - By Country/Sub-region
- 11.1.1 United States
- 11.1.2 Canada
- 11.1.3 Mexico
- 11.1.4 Rest of North America
- 12. Europe Fortifying Agent Market Analysis, Insights and Forecast, 2019-2031
- 12.1. Market Analysis, Insights and Forecast - By Country/Sub-region
- 12.1.1 United Kingdom
- 12.1.2 Germany
- 12.1.3 France
- 12.1.4 Russia
- 12.1.5 Italy
- 12.1.6 Spain
- 12.1.7 Rest of Europe
- 13. Asia Pacific Fortifying Agent Market Analysis, Insights and Forecast, 2019-2031
- 13.1. Market Analysis, Insights and Forecast - By Country/Sub-region
- 13.1.1 India
- 13.1.2 China
- 13.1.3 Japan
- 13.1.4 Australia
- 13.1.5 Rest of Asia Pacific
- 14. South America Fortifying Agent Market Analysis, Insights and Forecast, 2019-2031
- 14.1. Market Analysis, Insights and Forecast - By Country/Sub-region
- 14.1.1 Brazil
- 14.1.2 Argentina
- 14.1.3 Rest of South America
- 15. Middle East and Africa Fortifying Agent Market Analysis, Insights and Forecast, 2019-2031
- 15.1. Market Analysis, Insights and Forecast - By Country/Sub-region
- 15.1.1 South Africa
- 15.1.2 Saudi Arabia
- 15.1.3 Rest of Middle East and Africa
- 16. Competitive Analysis
- 16.1. Global Market Share Analysis 2024
- 16.2. Company Profiles
- 16.2.1 Kalsec Inc
- 16.2.1.1. Overview
- 16.2.1.2. Products
- 16.2.1.3. SWOT Analysis
- 16.2.1.4. Recent Developments
- 16.2.1.5. Financials (Based on Availability)
- 16.2.2 Cargill Incorporated
- 16.2.2.1. Overview
- 16.2.2.2. Products
- 16.2.2.3. SWOT Analysis
- 16.2.2.4. Recent Developments
- 16.2.2.5. Financials (Based on Availability)
- 16.2.3 International Flavors & Fragrances Inc IFF
- 16.2.3.1. Overview
- 16.2.3.2. Products
- 16.2.3.3. SWOT Analysis
- 16.2.3.4. Recent Developments
- 16.2.3.5. Financials (Based on Availability)
- 16.2.4 Archer Daniels Midland Company
- 16.2.4.1. Overview
- 16.2.4.2. Products
- 16.2.4.3. SWOT Analysis
- 16.2.4.4. Recent Developments
- 16.2.4.5. Financials (Based on Availability)
- 16.2.5 BASF SE
- 16.2.5.1. Overview
- 16.2.5.2. Products
- 16.2.5.3. SWOT Analysis
- 16.2.5.4. Recent Developments
- 16.2.5.5. Financials (Based on Availability)
- 16.2.6 DSM
- 16.2.6.1. Overview
- 16.2.6.2. Products
- 16.2.6.3. SWOT Analysis
- 16.2.6.4. Recent Developments
- 16.2.6.5. Financials (Based on Availability)
- 16.2.7 DuPont
- 16.2.7.1. Overview
- 16.2.7.2. Products
- 16.2.7.3. SWOT Analysis
- 16.2.7.4. Recent Developments
- 16.2.7.5. Financials (Based on Availability)
- 16.2.8 Eastman Chemical Company
- 16.2.8.1. Overview
- 16.2.8.2. Products
- 16.2.8.3. SWOT Analysis
- 16.2.8.4. Recent Developments
- 16.2.8.5. Financials (Based on Availability)
- 16.2.9 Kemin Industries Inc
- 16.2.9.1. Overview
- 16.2.9.2. Products
- 16.2.9.3. SWOT Analysis
- 16.2.9.4. Recent Developments
- 16.2.9.5. Financials (Based on Availability)
- 16.2.10 Advanced Organic Materials S A *List Not Exhaustive
- 16.2.10.1. Overview
- 16.2.10.2. Products
- 16.2.10.3. SWOT Analysis
- 16.2.10.4. Recent Developments
- 16.2.10.5. Financials (Based on Availability)
- 16.2.1 Kalsec Inc
List of Figures
- Figure 1: Global Fortifying Agent Market Revenue Breakdown (Million, %) by Region 2024 & 2032
- Figure 2: North America Fortifying Agent Market Revenue (Million), by Country 2024 & 2032
- Figure 3: North America Fortifying Agent Market Revenue Share (%), by Country 2024 & 2032
- Figure 4: Europe Fortifying Agent Market Revenue (Million), by Country 2024 & 2032
- Figure 5: Europe Fortifying Agent Market Revenue Share (%), by Country 2024 & 2032
- Figure 6: Asia Pacific Fortifying Agent Market Revenue (Million), by Country 2024 & 2032
- Figure 7: Asia Pacific Fortifying Agent Market Revenue Share (%), by Country 2024 & 2032
- Figure 8: South America Fortifying Agent Market Revenue (Million), by Country 2024 & 2032
- Figure 9: South America Fortifying Agent Market Revenue Share (%), by Country 2024 & 2032
- Figure 10: Middle East and Africa Fortifying Agent Market Revenue (Million), by Country 2024 & 2032
- Figure 11: Middle East and Africa Fortifying Agent Market Revenue Share (%), by Country 2024 & 2032
- Figure 12: North America Fortifying Agent Market Revenue (Million), by Type 2024 & 2032
- Figure 13: North America Fortifying Agent Market Revenue Share (%), by Type 2024 & 2032
- Figure 14: North America Fortifying Agent Market Revenue (Million), by Application 2024 & 2032
- Figure 15: North America Fortifying Agent Market Revenue Share (%), by Application 2024 & 2032
- Figure 16: North America Fortifying Agent Market Revenue (Million), by Country 2024 & 2032
- Figure 17: North America Fortifying Agent Market Revenue Share (%), by Country 2024 & 2032
- Figure 18: Europe Fortifying Agent Market Revenue (Million), by Type 2024 & 2032
- Figure 19: Europe Fortifying Agent Market Revenue Share (%), by Type 2024 & 2032
- Figure 20: Europe Fortifying Agent Market Revenue (Million), by Application 2024 & 2032
- Figure 21: Europe Fortifying Agent Market Revenue Share (%), by Application 2024 & 2032
- Figure 22: Europe Fortifying Agent Market Revenue (Million), by Country 2024 & 2032
- Figure 23: Europe Fortifying Agent Market Revenue Share (%), by Country 2024 & 2032
- Figure 24: Asia Pacific Fortifying Agent Market Revenue (Million), by Type 2024 & 2032
- Figure 25: Asia Pacific Fortifying Agent Market Revenue Share (%), by Type 2024 & 2032
- Figure 26: Asia Pacific Fortifying Agent Market Revenue (Million), by Application 2024 & 2032
- Figure 27: Asia Pacific Fortifying Agent Market Revenue Share (%), by Application 2024 & 2032
- Figure 28: Asia Pacific Fortifying Agent Market Revenue (Million), by Country 2024 & 2032
- Figure 29: Asia Pacific Fortifying Agent Market Revenue Share (%), by Country 2024 & 2032
- Figure 30: South America Fortifying Agent Market Revenue (Million), by Type 2024 & 2032
- Figure 31: South America Fortifying Agent Market Revenue Share (%), by Type 2024 & 2032
- Figure 32: South America Fortifying Agent Market Revenue (Million), by Application 2024 & 2032
- Figure 33: South America Fortifying Agent Market Revenue Share (%), by Application 2024 & 2032
- Figure 34: South America Fortifying Agent Market Revenue (Million), by Country 2024 & 2032
- Figure 35: South America Fortifying Agent Market Revenue Share (%), by Country 2024 & 2032
- Figure 36: Middle East and Africa Fortifying Agent Market Revenue (Million), by Type 2024 & 2032
- Figure 37: Middle East and Africa Fortifying Agent Market Revenue Share (%), by Type 2024 & 2032
- Figure 38: Middle East and Africa Fortifying Agent Market Revenue (Million), by Application 2024 & 2032
- Figure 39: Middle East and Africa Fortifying Agent Market Revenue Share (%), by Application 2024 & 2032
- Figure 40: Middle East and Africa Fortifying Agent Market Revenue (Million), by Country 2024 & 2032
- Figure 41: Middle East and Africa Fortifying Agent Market Revenue Share (%), by Country 2024 & 2032
List of Tables
- Table 1: Global Fortifying Agent Market Revenue Million Forecast, by Region 2019 & 2032
- Table 2: Global Fortifying Agent Market Revenue Million Forecast, by Type 2019 & 2032
- Table 3: Global Fortifying Agent Market Revenue Million Forecast, by Application 2019 & 2032
- Table 4: Global Fortifying Agent Market Revenue Million Forecast, by Region 2019 & 2032
- Table 5: Global Fortifying Agent Market Revenue Million Forecast, by Country 2019 & 2032
- Table 6: United States Fortifying Agent Market Revenue (Million) Forecast, by Application 2019 & 2032
- Table 7: Canada Fortifying Agent Market Revenue (Million) Forecast, by Application 2019 & 2032
- Table 8: Mexico Fortifying Agent Market Revenue (Million) Forecast, by Application 2019 & 2032
- Table 9: Rest of North America Fortifying Agent Market Revenue (Million) Forecast, by Application 2019 & 2032
- Table 10: Global Fortifying Agent Market Revenue Million Forecast, by Country 2019 & 2032
- Table 11: United Kingdom Fortifying Agent Market Revenue (Million) Forecast, by Application 2019 & 2032
- Table 12: Germany Fortifying Agent Market Revenue (Million) Forecast, by Application 2019 & 2032
- Table 13: France Fortifying Agent Market Revenue (Million) Forecast, by Application 2019 & 2032
- Table 14: Russia Fortifying Agent Market Revenue (Million) Forecast, by Application 2019 & 2032
- Table 15: Italy Fortifying Agent Market Revenue (Million) Forecast, by Application 2019 & 2032
- Table 16: Spain Fortifying Agent Market Revenue (Million) Forecast, by Application 2019 & 2032
- Table 17: Rest of Europe Fortifying Agent Market Revenue (Million) Forecast, by Application 2019 & 2032
- Table 18: Global Fortifying Agent Market Revenue Million Forecast, by Country 2019 & 2032
- Table 19: India Fortifying Agent Market Revenue (Million) Forecast, by Application 2019 & 2032
- Table 20: China Fortifying Agent Market Revenue (Million) Forecast, by Application 2019 & 2032
- Table 21: Japan Fortifying Agent Market Revenue (Million) Forecast, by Application 2019 & 2032
- Table 22: Australia Fortifying Agent Market Revenue (Million) Forecast, by Application 2019 & 2032
- Table 23: Rest of Asia Pacific Fortifying Agent Market Revenue (Million) Forecast, by Application 2019 & 2032
- Table 24: Global Fortifying Agent Market Revenue Million Forecast, by Country 2019 & 2032
- Table 25: Brazil Fortifying Agent Market Revenue (Million) Forecast, by Application 2019 & 2032
- Table 26: Argentina Fortifying Agent Market Revenue (Million) Forecast, by Application 2019 & 2032
- Table 27: Rest of South America Fortifying Agent Market Revenue (Million) Forecast, by Application 2019 & 2032
- Table 28: Global Fortifying Agent Market Revenue Million Forecast, by Country 2019 & 2032
- Table 29: South Africa Fortifying Agent Market Revenue (Million) Forecast, by Application 2019 & 2032
- Table 30: Saudi Arabia Fortifying Agent Market Revenue (Million) Forecast, by Application 2019 & 2032
- Table 31: Rest of Middle East and Africa Fortifying Agent Market Revenue (Million) Forecast, by Application 2019 & 2032
- Table 32: Global Fortifying Agent Market Revenue Million Forecast, by Type 2019 & 2032
- Table 33: Global Fortifying Agent Market Revenue Million Forecast, by Application 2019 & 2032
- Table 34: Global Fortifying Agent Market Revenue Million Forecast, by Country 2019 & 2032
- Table 35: United States Fortifying Agent Market Revenue (Million) Forecast, by Application 2019 & 2032
- Table 36: Canada Fortifying Agent Market Revenue (Million) Forecast, by Application 2019 & 2032
- Table 37: Mexico Fortifying Agent Market Revenue (Million) Forecast, by Application 2019 & 2032
- Table 38: Rest of North America Fortifying Agent Market Revenue (Million) Forecast, by Application 2019 & 2032
- Table 39: Global Fortifying Agent Market Revenue Million Forecast, by Type 2019 & 2032
- Table 40: Global Fortifying Agent Market Revenue Million Forecast, by Application 2019 & 2032
- Table 41: Global Fortifying Agent Market Revenue Million Forecast, by Country 2019 & 2032
- Table 42: United Kingdom Fortifying Agent Market Revenue (Million) Forecast, by Application 2019 & 2032
- Table 43: Germany Fortifying Agent Market Revenue (Million) Forecast, by Application 2019 & 2032
- Table 44: France Fortifying Agent Market Revenue (Million) Forecast, by Application 2019 & 2032
- Table 45: Russia Fortifying Agent Market Revenue (Million) Forecast, by Application 2019 & 2032
- Table 46: Italy Fortifying Agent Market Revenue (Million) Forecast, by Application 2019 & 2032
- Table 47: Spain Fortifying Agent Market Revenue (Million) Forecast, by Application 2019 & 2032
- Table 48: Rest of Europe Fortifying Agent Market Revenue (Million) Forecast, by Application 2019 & 2032
- Table 49: Global Fortifying Agent Market Revenue Million Forecast, by Type 2019 & 2032
- Table 50: Global Fortifying Agent Market Revenue Million Forecast, by Application 2019 & 2032
- Table 51: Global Fortifying Agent Market Revenue Million Forecast, by Country 2019 & 2032
- Table 52: India Fortifying Agent Market Revenue (Million) Forecast, by Application 2019 & 2032
- Table 53: China Fortifying Agent Market Revenue (Million) Forecast, by Application 2019 & 2032
- Table 54: Japan Fortifying Agent Market Revenue (Million) Forecast, by Application 2019 & 2032
- Table 55: Australia Fortifying Agent Market Revenue (Million) Forecast, by Application 2019 & 2032
- Table 56: Rest of Asia Pacific Fortifying Agent Market Revenue (Million) Forecast, by Application 2019 & 2032
- Table 57: Global Fortifying Agent Market Revenue Million Forecast, by Type 2019 & 2032
- Table 58: Global Fortifying Agent Market Revenue Million Forecast, by Application 2019 & 2032
- Table 59: Global Fortifying Agent Market Revenue Million Forecast, by Country 2019 & 2032
- Table 60: Brazil Fortifying Agent Market Revenue (Million) Forecast, by Application 2019 & 2032
- Table 61: Argentina Fortifying Agent Market Revenue (Million) Forecast, by Application 2019 & 2032
- Table 62: Rest of South America Fortifying Agent Market Revenue (Million) Forecast, by Application 2019 & 2032
- Table 63: Global Fortifying Agent Market Revenue Million Forecast, by Type 2019 & 2032
- Table 64: Global Fortifying Agent Market Revenue Million Forecast, by Application 2019 & 2032
- Table 65: Global Fortifying Agent Market Revenue Million Forecast, by Country 2019 & 2032
- Table 66: South Africa Fortifying Agent Market Revenue (Million) Forecast, by Application 2019 & 2032
- Table 67: Saudi Arabia Fortifying Agent Market Revenue (Million) Forecast, by Application 2019 & 2032
- Table 68: Rest of Middle East and Africa Fortifying Agent Market Revenue (Million) Forecast, by Application 2019 & 2032
Frequently Asked Questions
1. What is the projected Compound Annual Growth Rate (CAGR) of the Fortifying Agent Market?
The projected CAGR is approximately 10.30%.
2. Which companies are prominent players in the Fortifying Agent Market?
Key companies in the market include Kalsec Inc, Cargill Incorporated, International Flavors & Fragrances Inc IFF, Archer Daniels Midland Company, BASF SE, DSM, DuPont, Eastman Chemical Company, Kemin Industries Inc, Advanced Organic Materials S A *List Not Exhaustive.
3. What are the main segments of the Fortifying Agent Market?
The market segments include Type, Application.
4. Can you provide details about the market size?
The market size is estimated to be USD XX Million as of 2022.
5. What are some drivers contributing to market growth?
Increasing Demand for Low-Fat and Low-Calorie Food; Increasing Product Innovation.
6. What are the notable trends driving market growth?
Rising Consumption of Vitamin-infused Foods & Beverages.
7. Are there any restraints impacting market growth?
; Threat of New Entrants; Bargaining Power of Buyers/Consumers; Bargaining Power of Suppliers; Threat of Substitute Products; Degree Of Competition.
8. Can you provide examples of recent developments in the market?
N/A
9. What pricing options are available for accessing the report?
Pricing options include single-user, multi-user, and enterprise licenses priced at USD 4750, USD 5250, and USD 8750 respectively.
10. Is the market size provided in terms of value or volume?
The market size is provided in terms of value, measured in Million.
11. Are there any specific market keywords associated with the report?
Yes, the market keyword associated with the report is "Fortifying Agent Market," which aids in identifying and referencing the specific market segment covered.
12. How do I determine which pricing option suits my needs best?
The pricing options vary based on user requirements and access needs. Individual users may opt for single-user licenses, while businesses requiring broader access may choose multi-user or enterprise licenses for cost-effective access to the report.
13. Are there any additional resources or data provided in the Fortifying Agent Market report?
While the report offers comprehensive insights, it's advisable to review the specific contents or supplementary materials provided to ascertain if additional resources or data are available.
14. How can I stay updated on further developments or reports in the Fortifying Agent Market?
To stay informed about further developments, trends, and reports in the Fortifying Agent Market, consider subscribing to industry newsletters, following relevant companies and organizations, or regularly checking reputable industry news sources and publications.
Methodology
Step 1 - Identification of Relevant Samples Size from Population Database


Step 2 - Approaches for Defining Global Market Size (Value, Volume* & Price*)

Note*: In applicable scenarios
Step 3 - Data Sources
Primary Research
- Web Analytics
- Survey Reports
- Research Institute
- Latest Research Reports
- Opinion Leaders
Secondary Research
- Annual Reports
- White Paper
- Latest Press Release
- Industry Association
- Paid Database
- Investor Presentations

Step 4 - Data Triangulation
Involves using different sources of information in order to increase the validity of a study
These sources are likely to be stakeholders in a program - participants, other researchers, program staff, other community members, and so on.
Then we put all data in single framework & apply various statistical tools to find out the dynamic on the market.
During the analysis stage, feedback from the stakeholder groups would be compared to determine areas of agreement as well as areas of divergence
