

Key Insights
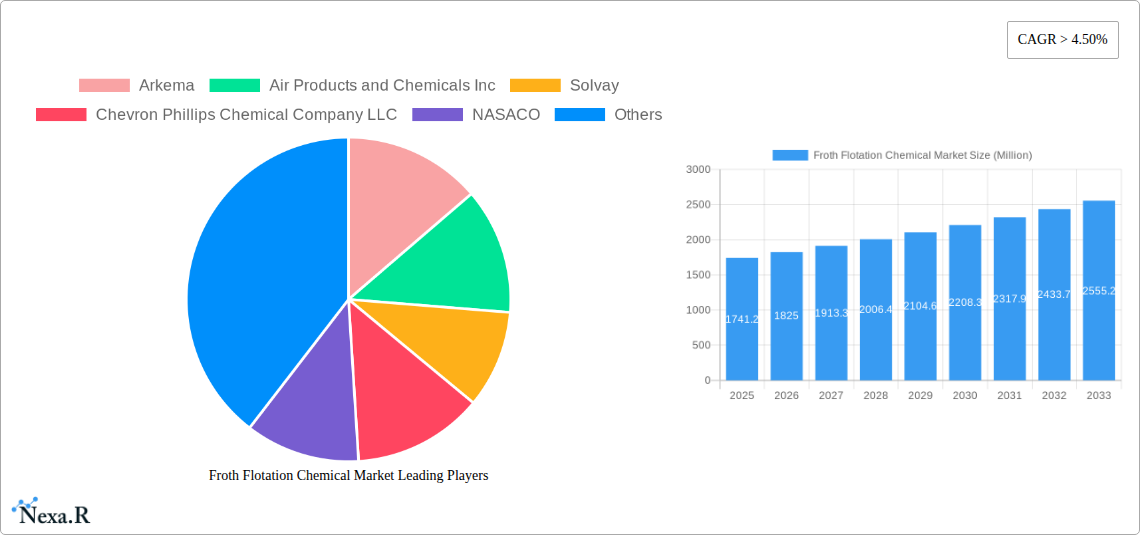
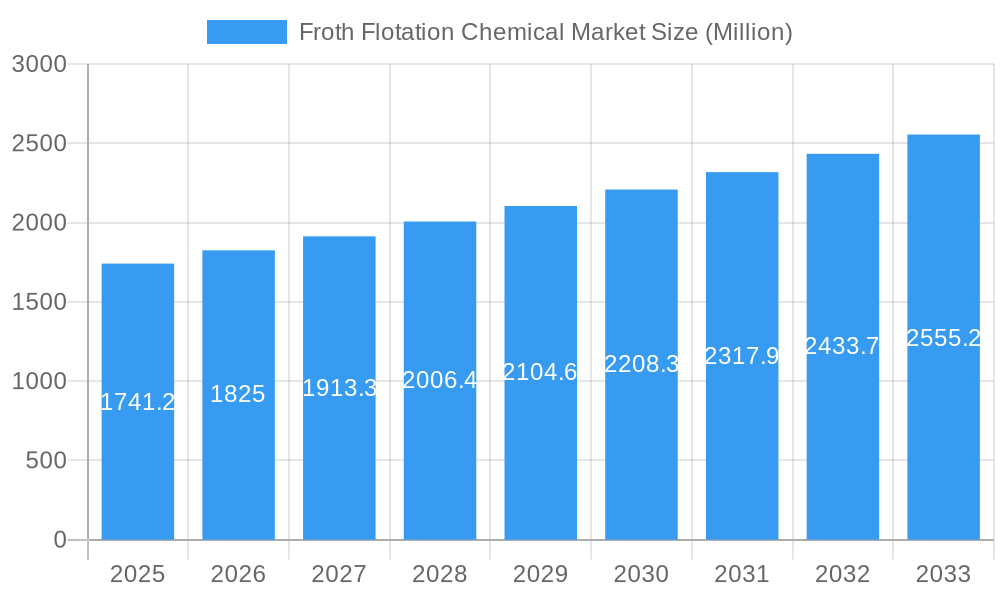
The Froth Flotation Chemical market, valued at $1741.2 million in 2025, is projected to experience robust growth, exhibiting a compound annual growth rate (CAGR) exceeding 4.50% from 2025 to 2033. This expansion is driven by the increasing demand for efficient mineral processing in the mining industry, coupled with the rising need for effective wastewater treatment solutions in industrial and municipal sectors. The growth is further fueled by advancements in reagent technology, leading to improved selectivity, recovery rates, and environmental sustainability. Specific segments like collectors and frothers within reagent types are key contributors to market growth, with collectors holding a larger share due to their crucial role in selective mineral separation. Geographically, the Asia-Pacific region, particularly China and India, is expected to dominate the market, driven by substantial mining activities and infrastructure development. North America and Europe also contribute significantly, fueled by established industries and stringent environmental regulations pushing for more efficient and environmentally sound mineral processing and wastewater treatment. However, price fluctuations in raw materials and potential environmental regulations pose challenges to market growth. The competitive landscape is characterized by a mix of established multinational companies and regional players, driving innovation and competition.
Froth Flotation Chemical Market Market Size (In Billion)
The forecast period (2025-2033) anticipates continued market expansion, propelled by emerging economies' industrialization and sustained demand for metals and minerals. The market segmentation across reagent types (collectors, frothers, modifiers, deactivators) and end-user industries (mining, pulp and paper, industrial waste and sewage treatment) offers diversified growth opportunities. Companies are actively investing in research and development to improve the efficiency and sustainability of their products, catering to the evolving needs of environmentally conscious industries. Furthermore, the increasing adoption of advanced froth flotation technologies further enhances the market's potential. While specific market share data for each segment and region is unavailable, a logical estimation based on industry trends suggests a significant contribution from the mining sector and a balanced distribution across geographic regions, with Asia-Pacific holding a leading position.
Froth Flotation Chemical Market Company Market Share
Froth Flotation Chemical Market: A Comprehensive Market Report (2019-2033)
This in-depth report provides a comprehensive analysis of the Froth Flotation Chemical market, encompassing market dynamics, growth trends, regional dominance, product landscape, key players, and future outlook. The study covers the period from 2019 to 2033, with a focus on the forecast period of 2025-2033 and a base year of 2025. The report meticulously segments the market by reagent type (Collectors, Non-ionic: Frothers), neutral modifiers, deactivators, other reagent types, and end-user industries (Mining, Pulp and Paper, Industrial Waste and Sewage Treatment, Other End-user Industries), providing granular insights into market size and growth potential within each segment. The report also offers valuable intelligence on major market participants including Arkema, Air Products and Chemicals Inc, Solvay, Chevron Phillips Chemical Company LLC, NASACO, Nouryon, BASF SE, Kemira, Dow, and Clariant.
Froth Flotation Chemical Market Market Dynamics & Structure
The Froth Flotation Chemical market exhibits a moderately consolidated structure, with a few major players holding significant market share. The market's dynamics are shaped by several factors, including technological innovation, stringent environmental regulations, the availability of substitute products, and evolving end-user demands. Mergers and acquisitions (M&A) activity plays a crucial role in shaping the competitive landscape.
- Market Concentration: The top 5 players hold approximately xx% of the global market share in 2025.
- Technological Innovation: Continuous innovation in reagent formulations drives market growth, focusing on enhanced selectivity, reduced reagent consumption, and improved environmental performance. However, high R&D costs pose a significant barrier to entry for smaller players.
- Regulatory Framework: Stringent environmental regulations regarding water discharge and waste management influence reagent selection and drive the demand for eco-friendly solutions.
- Competitive Product Substitutes: Alternative separation techniques, such as gravity separation and magnetic separation, pose competitive threats, especially in specific applications.
- End-User Demographics: The mining industry remains the dominant end-user, followed by the pulp and paper industry. The growth of these sectors directly influences market demand.
- M&A Trends: The past five years have witnessed xx M&A deals in the froth flotation chemical market, primarily driven by strategies to expand geographic reach and product portfolios.
Froth Flotation Chemical Market Growth Trends & Insights
The global Froth Flotation Chemical market is projected to witness significant growth during the forecast period (2025-2033). The market size is estimated at $xx Million in 2025 and is expected to reach $xx Million by 2033, exhibiting a Compound Annual Growth Rate (CAGR) of xx%. This growth is primarily driven by the rising demand from the mining and mineral processing industries, coupled with the increasing adoption of advanced froth flotation technologies. Technological disruptions, such as the implementation of AI-driven optimization systems like Solvay's SmartFloat, are further accelerating market growth. The market penetration rate for advanced froth flotation chemicals is expected to increase from xx% in 2025 to xx% by 2033.
Dominant Regions, Countries, or Segments in Froth Flotation Chemical Market
The mining sector significantly contributes to the market's growth; North America and Asia-Pacific are anticipated to be the leading regional markets during the forecast period, driven by robust mining activities and infrastructural development. The Mining segment holds the largest market share among the end-user industries.
Key Drivers:
- Rapid industrialization and urbanization in developing economies.
- Growing demand for minerals and metals.
- Increasing investments in mining infrastructure.
- Favorable government policies and incentives for mining operations.
Dominance Factors:
- High concentration of mining activities in specific regions.
- Presence of established froth flotation chemical manufacturers in these regions.
- Strong economic growth and industrial development.
- Technological advancements in mineral processing techniques.
Froth Flotation Chemical Market Product Landscape
The Froth Flotation Chemical market offers a diverse range of products catering to specific mineral types and processing requirements. Innovations focus on improving reagent selectivity, reducing environmental impact, and enhancing operational efficiency. Recent advancements include the development of bio-based reagents and the integration of digital technologies for real-time process optimization. These innovations offer unique selling propositions, such as lower operating costs, enhanced mineral recovery, and reduced environmental footprint.
Key Drivers, Barriers & Challenges in Froth Flotation Chemical Market
Key Drivers: The increasing demand for minerals and metals from various industries, coupled with technological advancements leading to more efficient and sustainable froth flotation processes, is a major driver. Government regulations promoting environmentally friendly solutions further fuel market growth.
Key Challenges & Restraints: Fluctuations in raw material prices, stringent environmental regulations, and intense competition among existing players pose significant challenges. Supply chain disruptions can also lead to production delays and cost increases, impacting profitability. The market faces challenges from the high capital investment required for new technologies and skilled labor shortages.
Emerging Opportunities in Froth Flotation Chemical Market
The Froth Flotation Chemical market presents several emerging opportunities, including the development of specialized reagents for processing challenging ore types, the expansion into untapped markets in developing economies, and the integration of advanced technologies like AI and machine learning for process optimization. Growing demand for environmentally friendly reagents offers a significant opportunity for manufacturers.
Growth Accelerators in the Froth Flotation Chemical Market Industry
Strategic partnerships between chemical manufacturers and mining companies facilitate the development and implementation of innovative solutions. Technological breakthroughs, such as the development of novel reagent formulations with improved performance characteristics, accelerate market growth. Expanding into new geographical markets with high growth potential will further drive market expansion.
Key Players Shaping the Froth Flotation Chemical Market Market
Notable Milestones in Froth Flotation Chemical Market Sector
- October 2022: Solvay launched 'SmartFloat,' an AI-based reagent optimization system for the mining industry. This signifies a significant advancement in optimizing froth flotation processes and improving efficiency.
In-Depth Froth Flotation Chemical Market Market Outlook
The Froth Flotation Chemical market is poised for sustained growth, driven by technological innovations, strategic partnerships, and expanding end-user industries. The market’s future potential lies in developing sustainable and highly efficient reagents, coupled with the adoption of advanced process control technologies. Strategic acquisitions and investments in R&D will play a crucial role in shaping the competitive landscape and driving long-term growth.
Froth Flotation Chemical Market Segmentation
-
1. Reagent Type
-
1.1. Collectors
- 1.1.1. Cationic
- 1.1.2. Anionic
- 1.1.3. Non-ionic
-
1.2. Frothers
- 1.2.1. Acidic
- 1.2.2. Basic
- 1.2.3. Neutral
-
1.3. Modifiers
- 1.3.1. Acidic Depressants
- 1.3.2. pH modifiers
- 1.3.3. Activators
- 1.3.4. Deactivators
- 1.4. Other Reagent Types
-
1.1. Collectors
-
2. End-user Industry
- 2.1. Mining
- 2.2. Pulp and Paper
- 2.3. Industrial Waste and Sewage Treatment
- 2.4. Other End-user Industries
Froth Flotation Chemical Market Segmentation By Geography
-
1. Asia Pacific
- 1.1. China
- 1.2. India
- 1.3. Japan
- 1.4. South Korea
- 1.5. Rest of Asia Pacific
-
2. North America
- 2.1. United States
- 2.2. Canada
- 2.3. Mexico
-
3. Europe
- 3.1. Germany
- 3.2. United Kingdom
- 3.3. France
- 3.4. Italy
- 3.5. Rest of Europe
-
4. South America
- 4.1. Brazil
- 4.2. Argentina
- 4.3. Rest of South America
-
5. Middle East and Africa
- 5.1. Saudi Arabia
- 5.2. South Africa
- 5.3. Rest of Middle East and Africa
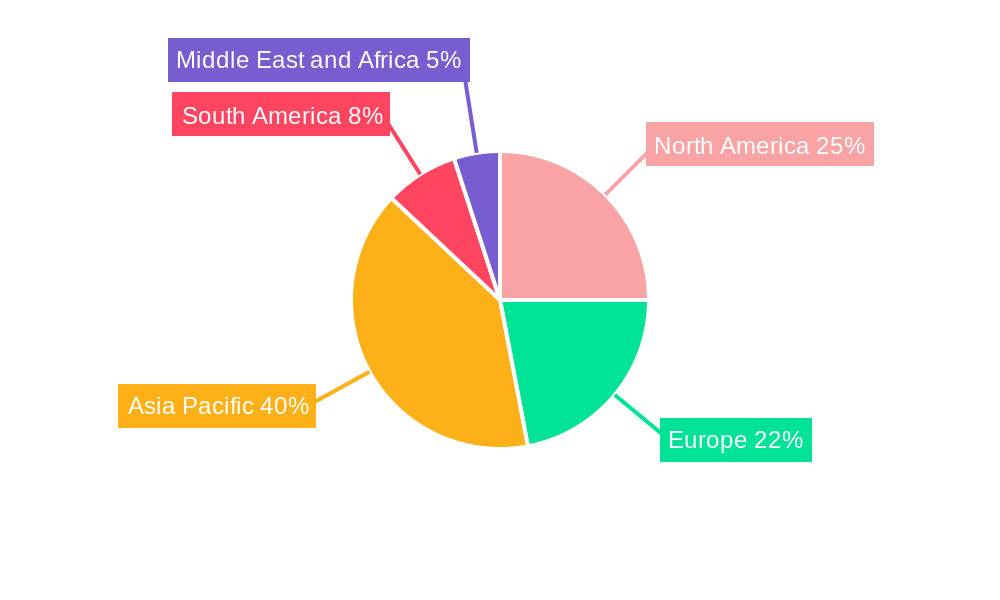
Froth Flotation Chemical Market Regional Market Share
Geographic Coverage of Froth Flotation Chemical Market
Froth Flotation Chemical Market REPORT HIGHLIGHTS
| Aspects | Details |
|---|---|
| Study Period | 2020-2034 |
| Base Year | 2025 |
| Estimated Year | 2026 |
| Forecast Period | 2026-2034 |
| Historical Period | 2020-2025 |
| Growth Rate | CAGR of > 4.50% from 2020-2034 |
| Segmentation |
|
Table of Contents
- 1. Introduction
- 1.1. Research Scope
- 1.2. Market Segmentation
- 1.3. Research Objective
- 1.4. Definitions and Assumptions
- 2. Executive Summary
- 2.1. Market Snapshot
- 3. Market Dynamics
- 3.1. Market Drivers
- 3.2. Market Restrains
- 3.3. Market Trends
- 3.4. Market Opportunities
- 4. Market Factor Analysis
- 4.1. Porters Five Forces
- 4.1.1. Bargaining Power of Suppliers
- 4.1.2. Bargaining Power of Buyers
- 4.1.3. Threat of New Entrants
- 4.1.4. Threat of Substitutes
- 4.1.5. Competitive Rivalry
- 4.2. PESTEL analysis
- 4.3. BCG Analysis
- 4.3.1. Stars (High Growth, High Market Share)
- 4.3.2. Cash Cows (Low Growth, High Market Share)
- 4.3.3. Question Mark (High Growth, Low Market Share)
- 4.3.4. Dogs (Low Growth, Low Market Share)
- 4.4. Ansoff Matrix Analysis
- 4.5. Supply Chain Analysis
- 4.6. Regulatory Landscape
- 4.7. Current Market Potential and Opportunity Assessment (TAM–SAM–SOM Framework)
- 4.8. NRP Analyst Note
- 4.1. Porters Five Forces
- 5. Market Analysis, Insights and Forecast 2021-2033
- 5.1. Market Analysis, Insights and Forecast - by Reagent Type
- 5.1.1. Collectors
- 5.1.1.1. Cationic
- 5.1.1.2. Anionic
- 5.1.1.3. Non-ionic
- 5.1.2. Frothers
- 5.1.2.1. Acidic
- 5.1.2.2. Basic
- 5.1.2.3. Neutral
- 5.1.3. Modifiers
- 5.1.3.1. Acidic Depressants
- 5.1.3.2. pH modifiers
- 5.1.3.3. Activators
- 5.1.3.4. Deactivators
- 5.1.4. Other Reagent Types
- 5.1.1. Collectors
- 5.2. Market Analysis, Insights and Forecast - by End-user Industry
- 5.2.1. Mining
- 5.2.2. Pulp and Paper
- 5.2.3. Industrial Waste and Sewage Treatment
- 5.2.4. Other End-user Industries
- 5.3. Market Analysis, Insights and Forecast - by Region
- 5.3.1. Asia Pacific
- 5.3.2. North America
- 5.3.3. Europe
- 5.3.4. South America
- 5.3.5. Middle East and Africa
- 5.1. Market Analysis, Insights and Forecast - by Reagent Type
- 6. Global Froth Flotation Chemical Market Analysis, Insights and Forecast, 2021-2033
- 6.1. Market Analysis, Insights and Forecast - by Reagent Type
- 6.1.1. Collectors
- 6.1.1.1. Cationic
- 6.1.1.2. Anionic
- 6.1.1.3. Non-ionic
- 6.1.2. Frothers
- 6.1.2.1. Acidic
- 6.1.2.2. Basic
- 6.1.2.3. Neutral
- 6.1.3. Modifiers
- 6.1.3.1. Acidic Depressants
- 6.1.3.2. pH modifiers
- 6.1.3.3. Activators
- 6.1.3.4. Deactivators
- 6.1.4. Other Reagent Types
- 6.1.1. Collectors
- 6.2. Market Analysis, Insights and Forecast - by End-user Industry
- 6.2.1. Mining
- 6.2.2. Pulp and Paper
- 6.2.3. Industrial Waste and Sewage Treatment
- 6.2.4. Other End-user Industries
- 6.1. Market Analysis, Insights and Forecast - by Reagent Type
- 7. Asia Pacific Froth Flotation Chemical Market Analysis, Insights and Forecast, 2020-2032
- 7.1. Market Analysis, Insights and Forecast - by Reagent Type
- 7.1.1. Collectors
- 7.1.1.1. Cationic
- 7.1.1.2. Anionic
- 7.1.1.3. Non-ionic
- 7.1.2. Frothers
- 7.1.2.1. Acidic
- 7.1.2.2. Basic
- 7.1.2.3. Neutral
- 7.1.3. Modifiers
- 7.1.3.1. Acidic Depressants
- 7.1.3.2. pH modifiers
- 7.1.3.3. Activators
- 7.1.3.4. Deactivators
- 7.1.4. Other Reagent Types
- 7.1.1. Collectors
- 7.2. Market Analysis, Insights and Forecast - by End-user Industry
- 7.2.1. Mining
- 7.2.2. Pulp and Paper
- 7.2.3. Industrial Waste and Sewage Treatment
- 7.2.4. Other End-user Industries
- 7.1. Market Analysis, Insights and Forecast - by Reagent Type
- 8. North America Froth Flotation Chemical Market Analysis, Insights and Forecast, 2020-2032
- 8.1. Market Analysis, Insights and Forecast - by Reagent Type
- 8.1.1. Collectors
- 8.1.1.1. Cationic
- 8.1.1.2. Anionic
- 8.1.1.3. Non-ionic
- 8.1.2. Frothers
- 8.1.2.1. Acidic
- 8.1.2.2. Basic
- 8.1.2.3. Neutral
- 8.1.3. Modifiers
- 8.1.3.1. Acidic Depressants
- 8.1.3.2. pH modifiers
- 8.1.3.3. Activators
- 8.1.3.4. Deactivators
- 8.1.4. Other Reagent Types
- 8.1.1. Collectors
- 8.2. Market Analysis, Insights and Forecast - by End-user Industry
- 8.2.1. Mining
- 8.2.2. Pulp and Paper
- 8.2.3. Industrial Waste and Sewage Treatment
- 8.2.4. Other End-user Industries
- 8.1. Market Analysis, Insights and Forecast - by Reagent Type
- 9. Europe Froth Flotation Chemical Market Analysis, Insights and Forecast, 2020-2032
- 9.1. Market Analysis, Insights and Forecast - by Reagent Type
- 9.1.1. Collectors
- 9.1.1.1. Cationic
- 9.1.1.2. Anionic
- 9.1.1.3. Non-ionic
- 9.1.2. Frothers
- 9.1.2.1. Acidic
- 9.1.2.2. Basic
- 9.1.2.3. Neutral
- 9.1.3. Modifiers
- 9.1.3.1. Acidic Depressants
- 9.1.3.2. pH modifiers
- 9.1.3.3. Activators
- 9.1.3.4. Deactivators
- 9.1.4. Other Reagent Types
- 9.1.1. Collectors
- 9.2. Market Analysis, Insights and Forecast - by End-user Industry
- 9.2.1. Mining
- 9.2.2. Pulp and Paper
- 9.2.3. Industrial Waste and Sewage Treatment
- 9.2.4. Other End-user Industries
- 9.1. Market Analysis, Insights and Forecast - by Reagent Type
- 10. South America Froth Flotation Chemical Market Analysis, Insights and Forecast, 2020-2032
- 10.1. Market Analysis, Insights and Forecast - by Reagent Type
- 10.1.1. Collectors
- 10.1.1.1. Cationic
- 10.1.1.2. Anionic
- 10.1.1.3. Non-ionic
- 10.1.2. Frothers
- 10.1.2.1. Acidic
- 10.1.2.2. Basic
- 10.1.2.3. Neutral
- 10.1.3. Modifiers
- 10.1.3.1. Acidic Depressants
- 10.1.3.2. pH modifiers
- 10.1.3.3. Activators
- 10.1.3.4. Deactivators
- 10.1.4. Other Reagent Types
- 10.1.1. Collectors
- 10.2. Market Analysis, Insights and Forecast - by End-user Industry
- 10.2.1. Mining
- 10.2.2. Pulp and Paper
- 10.2.3. Industrial Waste and Sewage Treatment
- 10.2.4. Other End-user Industries
- 10.1. Market Analysis, Insights and Forecast - by Reagent Type
- 11. Middle East and Africa Froth Flotation Chemical Market Analysis, Insights and Forecast, 2020-2032
- 11.1. Market Analysis, Insights and Forecast - by Reagent Type
- 11.1.1. Collectors
- 11.1.1.1. Cationic
- 11.1.1.2. Anionic
- 11.1.1.3. Non-ionic
- 11.1.2. Frothers
- 11.1.2.1. Acidic
- 11.1.2.2. Basic
- 11.1.2.3. Neutral
- 11.1.3. Modifiers
- 11.1.3.1. Acidic Depressants
- 11.1.3.2. pH modifiers
- 11.1.3.3. Activators
- 11.1.3.4. Deactivators
- 11.1.4. Other Reagent Types
- 11.1.1. Collectors
- 11.2. Market Analysis, Insights and Forecast - by End-user Industry
- 11.2.1. Mining
- 11.2.2. Pulp and Paper
- 11.2.3. Industrial Waste and Sewage Treatment
- 11.2.4. Other End-user Industries
- 11.1. Market Analysis, Insights and Forecast - by Reagent Type
- 12. Competitive Analysis
- 12.1. Company Profiles
- 12.1.1 Arkema
- 12.1.1.1. Company Overview
- 12.1.1.2. Products
- 12.1.1.3. Company Financials
- 12.1.1.4. SWOT Analysis
- 12.1.2 Air Products and Chemicals Inc
- 12.1.2.1. Company Overview
- 12.1.2.2. Products
- 12.1.2.3. Company Financials
- 12.1.2.4. SWOT Analysis
- 12.1.3 Solvay
- 12.1.3.1. Company Overview
- 12.1.3.2. Products
- 12.1.3.3. Company Financials
- 12.1.3.4. SWOT Analysis
- 12.1.4 Chevron Phillips Chemical Company LLC
- 12.1.4.1. Company Overview
- 12.1.4.2. Products
- 12.1.4.3. Company Financials
- 12.1.4.4. SWOT Analysis
- 12.1.5 NASACO
- 12.1.5.1. Company Overview
- 12.1.5.2. Products
- 12.1.5.3. Company Financials
- 12.1.5.4. SWOT Analysis
- 12.1.6 Nouryon*List Not Exhaustive
- 12.1.6.1. Company Overview
- 12.1.6.2. Products
- 12.1.6.3. Company Financials
- 12.1.6.4. SWOT Analysis
- 12.1.7 BASF SE
- 12.1.7.1. Company Overview
- 12.1.7.2. Products
- 12.1.7.3. Company Financials
- 12.1.7.4. SWOT Analysis
- 12.1.8 Kemira
- 12.1.8.1. Company Overview
- 12.1.8.2. Products
- 12.1.8.3. Company Financials
- 12.1.8.4. SWOT Analysis
- 12.1.9 Dow
- 12.1.9.1. Company Overview
- 12.1.9.2. Products
- 12.1.9.3. Company Financials
- 12.1.9.4. SWOT Analysis
- 12.1.10 CLARIANT
- 12.1.10.1. Company Overview
- 12.1.10.2. Products
- 12.1.10.3. Company Financials
- 12.1.10.4. SWOT Analysis
- 12.1.1 Arkema
- 12.2. Market Entropy
- 12.2.1 Company's Key Areas Served
- 12.2.2 Recent Developments
- 12.3. Company Market Share Analysis 2025
- 12.3.1 Top 5 Companies Market Share Analysis
- 12.3.2 Top 3 Companies Market Share Analysis
- 12.4. List of Potential Customers
- 13. Research Methodology
List of Figures
- Figure 1: Global Froth Flotation Chemical Market Revenue Breakdown (Million, %) by Region 2025 & 2033
- Figure 2: Global Froth Flotation Chemical Market Volume Breakdown (K Tons, %) by Region 2025 & 2033
- Figure 3: Asia Pacific Froth Flotation Chemical Market Revenue (Million), by Reagent Type 2025 & 2033
- Figure 4: Asia Pacific Froth Flotation Chemical Market Volume (K Tons), by Reagent Type 2025 & 2033
- Figure 5: Asia Pacific Froth Flotation Chemical Market Revenue Share (%), by Reagent Type 2025 & 2033
- Figure 6: Asia Pacific Froth Flotation Chemical Market Volume Share (%), by Reagent Type 2025 & 2033
- Figure 7: Asia Pacific Froth Flotation Chemical Market Revenue (Million), by End-user Industry 2025 & 2033
- Figure 8: Asia Pacific Froth Flotation Chemical Market Volume (K Tons), by End-user Industry 2025 & 2033
- Figure 9: Asia Pacific Froth Flotation Chemical Market Revenue Share (%), by End-user Industry 2025 & 2033
- Figure 10: Asia Pacific Froth Flotation Chemical Market Volume Share (%), by End-user Industry 2025 & 2033
- Figure 11: Asia Pacific Froth Flotation Chemical Market Revenue (Million), by Country 2025 & 2033
- Figure 12: Asia Pacific Froth Flotation Chemical Market Volume (K Tons), by Country 2025 & 2033
- Figure 13: Asia Pacific Froth Flotation Chemical Market Revenue Share (%), by Country 2025 & 2033
- Figure 14: Asia Pacific Froth Flotation Chemical Market Volume Share (%), by Country 2025 & 2033
- Figure 15: North America Froth Flotation Chemical Market Revenue (Million), by Reagent Type 2025 & 2033
- Figure 16: North America Froth Flotation Chemical Market Volume (K Tons), by Reagent Type 2025 & 2033
- Figure 17: North America Froth Flotation Chemical Market Revenue Share (%), by Reagent Type 2025 & 2033
- Figure 18: North America Froth Flotation Chemical Market Volume Share (%), by Reagent Type 2025 & 2033
- Figure 19: North America Froth Flotation Chemical Market Revenue (Million), by End-user Industry 2025 & 2033
- Figure 20: North America Froth Flotation Chemical Market Volume (K Tons), by End-user Industry 2025 & 2033
- Figure 21: North America Froth Flotation Chemical Market Revenue Share (%), by End-user Industry 2025 & 2033
- Figure 22: North America Froth Flotation Chemical Market Volume Share (%), by End-user Industry 2025 & 2033
- Figure 23: North America Froth Flotation Chemical Market Revenue (Million), by Country 2025 & 2033
- Figure 24: North America Froth Flotation Chemical Market Volume (K Tons), by Country 2025 & 2033
- Figure 25: North America Froth Flotation Chemical Market Revenue Share (%), by Country 2025 & 2033
- Figure 26: North America Froth Flotation Chemical Market Volume Share (%), by Country 2025 & 2033
- Figure 27: Europe Froth Flotation Chemical Market Revenue (Million), by Reagent Type 2025 & 2033
- Figure 28: Europe Froth Flotation Chemical Market Volume (K Tons), by Reagent Type 2025 & 2033
- Figure 29: Europe Froth Flotation Chemical Market Revenue Share (%), by Reagent Type 2025 & 2033
- Figure 30: Europe Froth Flotation Chemical Market Volume Share (%), by Reagent Type 2025 & 2033
- Figure 31: Europe Froth Flotation Chemical Market Revenue (Million), by End-user Industry 2025 & 2033
- Figure 32: Europe Froth Flotation Chemical Market Volume (K Tons), by End-user Industry 2025 & 2033
- Figure 33: Europe Froth Flotation Chemical Market Revenue Share (%), by End-user Industry 2025 & 2033
- Figure 34: Europe Froth Flotation Chemical Market Volume Share (%), by End-user Industry 2025 & 2033
- Figure 35: Europe Froth Flotation Chemical Market Revenue (Million), by Country 2025 & 2033
- Figure 36: Europe Froth Flotation Chemical Market Volume (K Tons), by Country 2025 & 2033
- Figure 37: Europe Froth Flotation Chemical Market Revenue Share (%), by Country 2025 & 2033
- Figure 38: Europe Froth Flotation Chemical Market Volume Share (%), by Country 2025 & 2033
- Figure 39: South America Froth Flotation Chemical Market Revenue (Million), by Reagent Type 2025 & 2033
- Figure 40: South America Froth Flotation Chemical Market Volume (K Tons), by Reagent Type 2025 & 2033
- Figure 41: South America Froth Flotation Chemical Market Revenue Share (%), by Reagent Type 2025 & 2033
- Figure 42: South America Froth Flotation Chemical Market Volume Share (%), by Reagent Type 2025 & 2033
- Figure 43: South America Froth Flotation Chemical Market Revenue (Million), by End-user Industry 2025 & 2033
- Figure 44: South America Froth Flotation Chemical Market Volume (K Tons), by End-user Industry 2025 & 2033
- Figure 45: South America Froth Flotation Chemical Market Revenue Share (%), by End-user Industry 2025 & 2033
- Figure 46: South America Froth Flotation Chemical Market Volume Share (%), by End-user Industry 2025 & 2033
- Figure 47: South America Froth Flotation Chemical Market Revenue (Million), by Country 2025 & 2033
- Figure 48: South America Froth Flotation Chemical Market Volume (K Tons), by Country 2025 & 2033
- Figure 49: South America Froth Flotation Chemical Market Revenue Share (%), by Country 2025 & 2033
- Figure 50: South America Froth Flotation Chemical Market Volume Share (%), by Country 2025 & 2033
- Figure 51: Middle East and Africa Froth Flotation Chemical Market Revenue (Million), by Reagent Type 2025 & 2033
- Figure 52: Middle East and Africa Froth Flotation Chemical Market Volume (K Tons), by Reagent Type 2025 & 2033
- Figure 53: Middle East and Africa Froth Flotation Chemical Market Revenue Share (%), by Reagent Type 2025 & 2033
- Figure 54: Middle East and Africa Froth Flotation Chemical Market Volume Share (%), by Reagent Type 2025 & 2033
- Figure 55: Middle East and Africa Froth Flotation Chemical Market Revenue (Million), by End-user Industry 2025 & 2033
- Figure 56: Middle East and Africa Froth Flotation Chemical Market Volume (K Tons), by End-user Industry 2025 & 2033
- Figure 57: Middle East and Africa Froth Flotation Chemical Market Revenue Share (%), by End-user Industry 2025 & 2033
- Figure 58: Middle East and Africa Froth Flotation Chemical Market Volume Share (%), by End-user Industry 2025 & 2033
- Figure 59: Middle East and Africa Froth Flotation Chemical Market Revenue (Million), by Country 2025 & 2033
- Figure 60: Middle East and Africa Froth Flotation Chemical Market Volume (K Tons), by Country 2025 & 2033
- Figure 61: Middle East and Africa Froth Flotation Chemical Market Revenue Share (%), by Country 2025 & 2033
- Figure 62: Middle East and Africa Froth Flotation Chemical Market Volume Share (%), by Country 2025 & 2033
List of Tables
- Table 1: Global Froth Flotation Chemical Market Revenue Million Forecast, by Reagent Type 2020 & 2033
- Table 2: Global Froth Flotation Chemical Market Volume K Tons Forecast, by Reagent Type 2020 & 2033
- Table 3: Global Froth Flotation Chemical Market Revenue Million Forecast, by End-user Industry 2020 & 2033
- Table 4: Global Froth Flotation Chemical Market Volume K Tons Forecast, by End-user Industry 2020 & 2033
- Table 5: Global Froth Flotation Chemical Market Revenue Million Forecast, by Region 2020 & 2033
- Table 6: Global Froth Flotation Chemical Market Volume K Tons Forecast, by Region 2020 & 2033
- Table 7: Global Froth Flotation Chemical Market Revenue Million Forecast, by Reagent Type 2020 & 2033
- Table 8: Global Froth Flotation Chemical Market Volume K Tons Forecast, by Reagent Type 2020 & 2033
- Table 9: Global Froth Flotation Chemical Market Revenue Million Forecast, by End-user Industry 2020 & 2033
- Table 10: Global Froth Flotation Chemical Market Volume K Tons Forecast, by End-user Industry 2020 & 2033
- Table 11: Global Froth Flotation Chemical Market Revenue Million Forecast, by Country 2020 & 2033
- Table 12: Global Froth Flotation Chemical Market Volume K Tons Forecast, by Country 2020 & 2033
- Table 13: China Froth Flotation Chemical Market Revenue (Million) Forecast, by Application 2020 & 2033
- Table 14: China Froth Flotation Chemical Market Volume (K Tons) Forecast, by Application 2020 & 2033
- Table 15: India Froth Flotation Chemical Market Revenue (Million) Forecast, by Application 2020 & 2033
- Table 16: India Froth Flotation Chemical Market Volume (K Tons) Forecast, by Application 2020 & 2033
- Table 17: Japan Froth Flotation Chemical Market Revenue (Million) Forecast, by Application 2020 & 2033
- Table 18: Japan Froth Flotation Chemical Market Volume (K Tons) Forecast, by Application 2020 & 2033
- Table 19: South Korea Froth Flotation Chemical Market Revenue (Million) Forecast, by Application 2020 & 2033
- Table 20: South Korea Froth Flotation Chemical Market Volume (K Tons) Forecast, by Application 2020 & 2033
- Table 21: Rest of Asia Pacific Froth Flotation Chemical Market Revenue (Million) Forecast, by Application 2020 & 2033
- Table 22: Rest of Asia Pacific Froth Flotation Chemical Market Volume (K Tons) Forecast, by Application 2020 & 2033
- Table 23: Global Froth Flotation Chemical Market Revenue Million Forecast, by Reagent Type 2020 & 2033
- Table 24: Global Froth Flotation Chemical Market Volume K Tons Forecast, by Reagent Type 2020 & 2033
- Table 25: Global Froth Flotation Chemical Market Revenue Million Forecast, by End-user Industry 2020 & 2033
- Table 26: Global Froth Flotation Chemical Market Volume K Tons Forecast, by End-user Industry 2020 & 2033
- Table 27: Global Froth Flotation Chemical Market Revenue Million Forecast, by Country 2020 & 2033
- Table 28: Global Froth Flotation Chemical Market Volume K Tons Forecast, by Country 2020 & 2033
- Table 29: United States Froth Flotation Chemical Market Revenue (Million) Forecast, by Application 2020 & 2033
- Table 30: United States Froth Flotation Chemical Market Volume (K Tons) Forecast, by Application 2020 & 2033
- Table 31: Canada Froth Flotation Chemical Market Revenue (Million) Forecast, by Application 2020 & 2033
- Table 32: Canada Froth Flotation Chemical Market Volume (K Tons) Forecast, by Application 2020 & 2033
- Table 33: Mexico Froth Flotation Chemical Market Revenue (Million) Forecast, by Application 2020 & 2033
- Table 34: Mexico Froth Flotation Chemical Market Volume (K Tons) Forecast, by Application 2020 & 2033
- Table 35: Global Froth Flotation Chemical Market Revenue Million Forecast, by Reagent Type 2020 & 2033
- Table 36: Global Froth Flotation Chemical Market Volume K Tons Forecast, by Reagent Type 2020 & 2033
- Table 37: Global Froth Flotation Chemical Market Revenue Million Forecast, by End-user Industry 2020 & 2033
- Table 38: Global Froth Flotation Chemical Market Volume K Tons Forecast, by End-user Industry 2020 & 2033
- Table 39: Global Froth Flotation Chemical Market Revenue Million Forecast, by Country 2020 & 2033
- Table 40: Global Froth Flotation Chemical Market Volume K Tons Forecast, by Country 2020 & 2033
- Table 41: Germany Froth Flotation Chemical Market Revenue (Million) Forecast, by Application 2020 & 2033
- Table 42: Germany Froth Flotation Chemical Market Volume (K Tons) Forecast, by Application 2020 & 2033
- Table 43: United Kingdom Froth Flotation Chemical Market Revenue (Million) Forecast, by Application 2020 & 2033
- Table 44: United Kingdom Froth Flotation Chemical Market Volume (K Tons) Forecast, by Application 2020 & 2033
- Table 45: France Froth Flotation Chemical Market Revenue (Million) Forecast, by Application 2020 & 2033
- Table 46: France Froth Flotation Chemical Market Volume (K Tons) Forecast, by Application 2020 & 2033
- Table 47: Italy Froth Flotation Chemical Market Revenue (Million) Forecast, by Application 2020 & 2033
- Table 48: Italy Froth Flotation Chemical Market Volume (K Tons) Forecast, by Application 2020 & 2033
- Table 49: Rest of Europe Froth Flotation Chemical Market Revenue (Million) Forecast, by Application 2020 & 2033
- Table 50: Rest of Europe Froth Flotation Chemical Market Volume (K Tons) Forecast, by Application 2020 & 2033
- Table 51: Global Froth Flotation Chemical Market Revenue Million Forecast, by Reagent Type 2020 & 2033
- Table 52: Global Froth Flotation Chemical Market Volume K Tons Forecast, by Reagent Type 2020 & 2033
- Table 53: Global Froth Flotation Chemical Market Revenue Million Forecast, by End-user Industry 2020 & 2033
- Table 54: Global Froth Flotation Chemical Market Volume K Tons Forecast, by End-user Industry 2020 & 2033
- Table 55: Global Froth Flotation Chemical Market Revenue Million Forecast, by Country 2020 & 2033
- Table 56: Global Froth Flotation Chemical Market Volume K Tons Forecast, by Country 2020 & 2033
- Table 57: Brazil Froth Flotation Chemical Market Revenue (Million) Forecast, by Application 2020 & 2033
- Table 58: Brazil Froth Flotation Chemical Market Volume (K Tons) Forecast, by Application 2020 & 2033
- Table 59: Argentina Froth Flotation Chemical Market Revenue (Million) Forecast, by Application 2020 & 2033
- Table 60: Argentina Froth Flotation Chemical Market Volume (K Tons) Forecast, by Application 2020 & 2033
- Table 61: Rest of South America Froth Flotation Chemical Market Revenue (Million) Forecast, by Application 2020 & 2033
- Table 62: Rest of South America Froth Flotation Chemical Market Volume (K Tons) Forecast, by Application 2020 & 2033
- Table 63: Global Froth Flotation Chemical Market Revenue Million Forecast, by Reagent Type 2020 & 2033
- Table 64: Global Froth Flotation Chemical Market Volume K Tons Forecast, by Reagent Type 2020 & 2033
- Table 65: Global Froth Flotation Chemical Market Revenue Million Forecast, by End-user Industry 2020 & 2033
- Table 66: Global Froth Flotation Chemical Market Volume K Tons Forecast, by End-user Industry 2020 & 2033
- Table 67: Global Froth Flotation Chemical Market Revenue Million Forecast, by Country 2020 & 2033
- Table 68: Global Froth Flotation Chemical Market Volume K Tons Forecast, by Country 2020 & 2033
- Table 69: Saudi Arabia Froth Flotation Chemical Market Revenue (Million) Forecast, by Application 2020 & 2033
- Table 70: Saudi Arabia Froth Flotation Chemical Market Volume (K Tons) Forecast, by Application 2020 & 2033
- Table 71: South Africa Froth Flotation Chemical Market Revenue (Million) Forecast, by Application 2020 & 2033
- Table 72: South Africa Froth Flotation Chemical Market Volume (K Tons) Forecast, by Application 2020 & 2033
- Table 73: Rest of Middle East and Africa Froth Flotation Chemical Market Revenue (Million) Forecast, by Application 2020 & 2033
- Table 74: Rest of Middle East and Africa Froth Flotation Chemical Market Volume (K Tons) Forecast, by Application 2020 & 2033
Frequently Asked Questions
1. What is the projected Compound Annual Growth Rate (CAGR) of the Froth Flotation Chemical Market?
The projected CAGR is approximately > 4.50%.
2. Which companies are prominent players in the Froth Flotation Chemical Market?
Key companies in the market include Arkema, Air Products and Chemicals Inc, Solvay, Chevron Phillips Chemical Company LLC, NASACO, Nouryon*List Not Exhaustive, BASF SE, Kemira, Dow, CLARIANT.
3. What are the main segments of the Froth Flotation Chemical Market?
The market segments include Reagent Type, End-user Industry.
4. Can you provide details about the market size?
The market size is estimated to be USD 1741.2 Million as of 2022.
5. What are some drivers contributing to market growth?
Rising Demand for Froth Flotation Chemicals in Asia-Pacific; Increasing Mining Activities in Canada and Mexico; Other Drivers.
6. What are the notable trends driving market growth?
Rising Demand from the Mining Industry.
7. Are there any restraints impacting market growth?
Stringent Policies and Changing Regulatory Landscape Exist in North America and Europe; Other Restraints.
8. Can you provide examples of recent developments in the market?
October 2022: Solvay launched a digital mining solution, 'SmartFloat,' an AI-based reagent optimization system. It helps mining companies capture more value from their data and optimize froth flotation processes.
9. What pricing options are available for accessing the report?
Pricing options include single-user, multi-user, and enterprise licenses priced at USD 4750, USD 5250, and USD 8750 respectively.
10. Is the market size provided in terms of value or volume?
The market size is provided in terms of value, measured in Million and volume, measured in K Tons.
11. Are there any specific market keywords associated with the report?
Yes, the market keyword associated with the report is "Froth Flotation Chemical Market," which aids in identifying and referencing the specific market segment covered.
12. How do I determine which pricing option suits my needs best?
The pricing options vary based on user requirements and access needs. Individual users may opt for single-user licenses, while businesses requiring broader access may choose multi-user or enterprise licenses for cost-effective access to the report.
13. Are there any additional resources or data provided in the Froth Flotation Chemical Market report?
While the report offers comprehensive insights, it's advisable to review the specific contents or supplementary materials provided to ascertain if additional resources or data are available.
14. How can I stay updated on further developments or reports in the Froth Flotation Chemical Market?
To stay informed about further developments, trends, and reports in the Froth Flotation Chemical Market, consider subscribing to industry newsletters, following relevant companies and organizations, or regularly checking reputable industry news sources and publications.
Methodology
Step 1 - Identification of Relevant Samples Size from Population Database


Step 2 - Approaches for Defining Global Market Size (Value, Volume* & Price*)

Note*: In applicable scenarios
Step 3 - Data Sources
Primary Research
- Web Analytics
- Survey Reports
- Research Institute
- Latest Research Reports
- Opinion Leaders
Secondary Research
- Annual Reports
- White Paper
- Latest Press Release
- Industry Association
- Paid Database
- Investor Presentations

Step 4 - Data Triangulation
Involves using different sources of information in order to increase the validity of a study
These sources are likely to be stakeholders in a program - participants, other researchers, program staff, other community members, and so on.
Then we put all data in single framework & apply various statistical tools to find out the dynamic on the market.
During the analysis stage, feedback from the stakeholder groups would be compared to determine areas of agreement as well as areas of divergence