

Key Insights
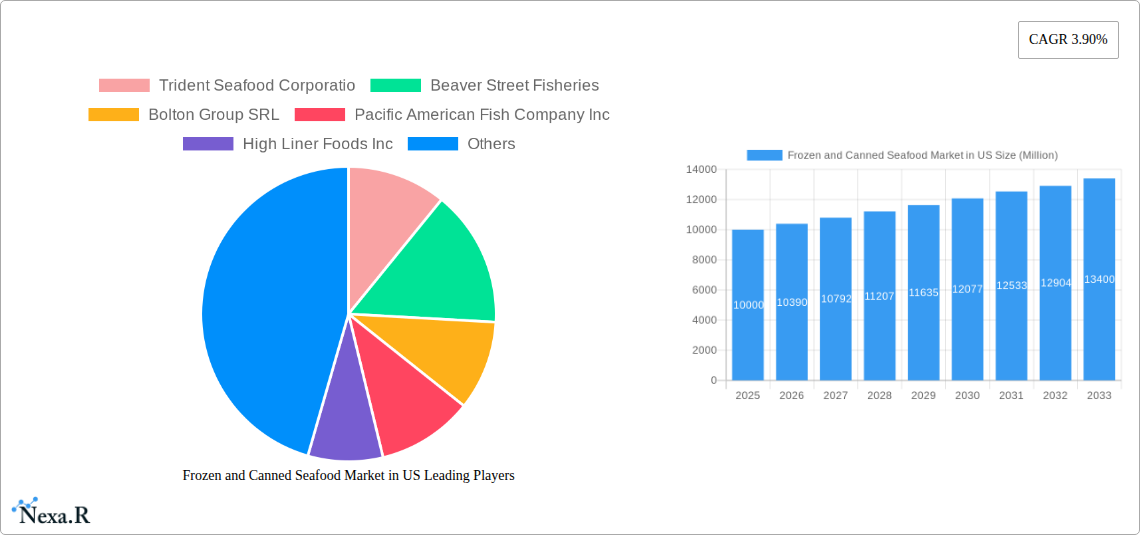
The US frozen and canned seafood market, valued at approximately $XX million in 2025, is projected to experience steady growth, with a compound annual growth rate (CAGR) of 3.90% from 2025 to 2033. This growth is fueled by several key drivers. Increasing consumer demand for convenient, healthy, and protein-rich food options is a significant factor. The rising popularity of seafood in various cuisines and its perceived health benefits, such as omega-3 fatty acids, further contribute to market expansion. The growth is also driven by advancements in freezing and canning technologies, leading to improved product quality and extended shelf life. However, market expansion faces certain restraints, primarily fluctuating seafood prices due to supply chain issues and environmental concerns. Furthermore, consumer preference for fresh seafood over processed options, particularly among health-conscious consumers, presents a challenge. The market is segmented by type (fish, shrimp, other seafood), distribution channel (off-trade, on-trade), and region (Northeast, Southeast, Midwest, Southwest, West). Leading companies such as Trident Seafood Corporation, High Liner Foods Inc., and Thai Union Group PCL are major players, leveraging their established distribution networks and brand recognition to maintain market share. The projected growth indicates significant opportunities for both established players and new entrants, particularly those focusing on innovation, sustainability, and catering to evolving consumer preferences.
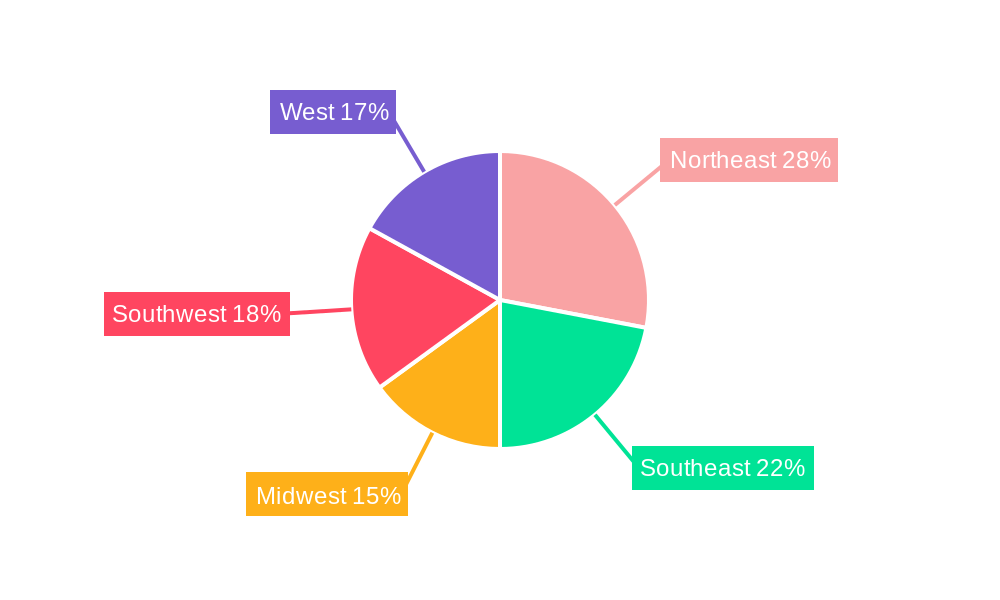
The regional breakdown of the US market reveals variations in consumption patterns. The Northeast and West Coast, with their proximity to major fishing ports and higher seafood consumption rates, are likely to hold larger market shares. The Midwest and South, while exhibiting lower per capita consumption, are still expected to witness growth due to increasing population and changing dietary habits. Future growth strategies should prioritize sustainable sourcing practices, investing in technological advancements to reduce costs and improve product quality, and engaging in targeted marketing campaigns to address evolving consumer preferences for healthier and more ethically sourced seafood. Market diversification, including exploring new product formats and catering to niche dietary requirements, will also be crucial for sustained success in this dynamic market.
Frozen and Canned Seafood Market in US: A Comprehensive Market Report (2019-2033)
This in-depth report provides a comprehensive analysis of the Frozen and Canned Seafood Market in the US, covering market dynamics, growth trends, key players, and future outlook. The study period spans from 2019 to 2033, with 2025 serving as the base and estimated year. The report offers invaluable insights for industry professionals, investors, and stakeholders seeking to understand and capitalize on opportunities within this dynamic market. The report segments the market by Type (Fish, Shrimp, Other Seafood) and Distribution Channel (Off-Trade, On-Trade).
Frozen and Canned Seafood Market in US Market Dynamics & Structure
This section analyzes the competitive landscape, technological advancements, regulatory environment, and market trends within the US frozen and canned seafood market. The market is moderately concentrated, with key players holding significant market share, but also witnessing increased competition from smaller, specialized businesses focusing on sustainability and niche products. Technological innovation centers around improved freezing and canning techniques, extended shelf-life solutions, and enhanced packaging to maintain product quality and reduce waste. Stringent regulatory frameworks concerning food safety, labeling, and sustainable fishing practices significantly influence market operations. Consumer preference for healthier and sustainably sourced seafood continues to drive demand for specific product types. The market also faces competition from fresh seafood and alternative protein sources. Mergers and acquisitions (M&A) activity has been moderate, with larger players consolidating their market position and expanding their product portfolios.
- Market Concentration: Moderately concentrated, with the top 5 players holding approximately xx% market share in 2024.
- Technological Innovation: Focus on improved freezing/canning, extended shelf-life, and sustainable packaging.
- Regulatory Framework: Stringent food safety, labeling, and sustainable fishing regulations.
- Competitive Substitutes: Fresh seafood, plant-based alternatives, and other protein sources.
- End-User Demographics: Growing demand from health-conscious consumers and increasing popularity of convenient food options.
- M&A Activity: Moderate M&A activity, with strategic acquisitions aiming for market consolidation and expansion. xx deals recorded between 2019-2024.
Frozen and Canned Seafood Market in US Growth Trends & Insights
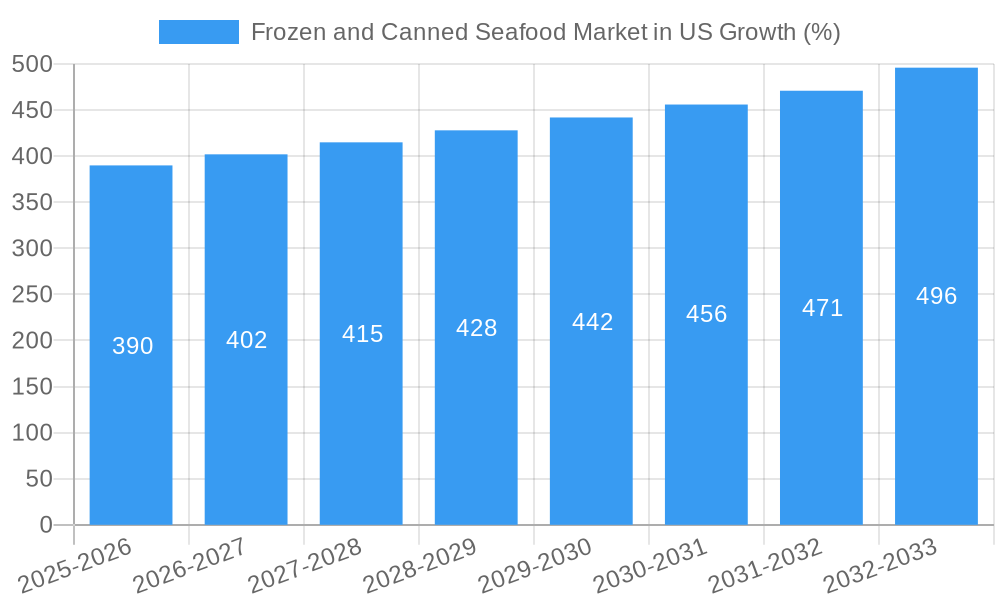
The US frozen and canned seafood market experienced steady growth during the historical period (2019-2024), driven by factors such as rising disposable incomes, changing consumer preferences towards convenient and ready-to-eat meals, and increased health awareness. The market size witnessed a Compound Annual Growth Rate (CAGR) of xx% during this period, reaching an estimated value of $xx million in 2024. The adoption rate of frozen and canned seafood products remains high, particularly within the off-trade channel. Technological disruptions, such as improved packaging and preservation techniques, have further enhanced product quality and extended shelf life, bolstering market growth. Shifting consumer behaviors towards healthier and more sustainable food choices have influenced product innovation, with a growing focus on sustainably sourced and ethically produced seafood. The forecast period (2025-2033) is projected to witness continued growth, albeit at a slightly moderated pace, with a projected CAGR of xx%, driven by sustained demand and further market penetration in key segments. The market is expected to reach $xx million by 2033.
Dominant Regions, Countries, or Segments in Frozen and Canned Seafood Market in US
The Off-Trade distribution channel dominates the US frozen and canned seafood market, accounting for approximately xx% of total sales in 2024. This is primarily driven by the widespread availability of these products in supermarkets, hypermarkets, and convenience stores. The Fish segment holds the largest market share among product types, followed by Shrimp and Other Seafood. Key drivers contributing to this dominance include high consumer demand, wide product availability, established distribution networks, and relatively competitive pricing. Regional dominance is spread across the country, with higher consumption in coastal areas and population centers with high seafood consumption traditions.
- Key Drivers for Off-Trade dominance: Wide product availability, established retail channels, competitive pricing.
- Key Drivers for Fish segment dominance: High consumer demand, established supply chain, versatile culinary uses.
- Growth Potential: Continued growth expected across all segments, with potential for increased penetration in less developed regions.
Frozen and Canned Seafood Market in US Product Landscape
The frozen and canned seafood market showcases a wide range of products, catering to diverse consumer preferences. Innovations focus on enhancing product quality, extending shelf life, and improving convenience. Ready-to-eat meals, value-added products (e.g., pre-marinated seafood), and sustainable packaging are some key product innovations. Performance metrics such as shelf life, nutritional value, and taste are crucial factors driving consumer choice. Unique selling propositions often highlight sustainable sourcing, ethical practices, and high-quality ingredients. Technological advancements in processing and packaging play a pivotal role in maintaining product quality and reducing waste.
Key Drivers, Barriers & Challenges in Frozen and Canned Seafood Market in US
Key Drivers: Rising disposable incomes, increased demand for convenient food options, growing health consciousness, and the expanding popularity of seafood in diverse cuisines. Government initiatives promoting sustainable fisheries also contribute to market growth.
Key Challenges: Supply chain disruptions caused by fluctuating fish stocks, geopolitical instability, and logistical bottlenecks. Strict regulatory requirements around food safety and sustainability can increase operational costs. Intense competition from fresh seafood and alternative protein sources poses another challenge. Fluctuations in raw material prices also impact profitability. The estimated impact of supply chain disruptions on market growth in 2024 is approximately xx%.
Emerging Opportunities in Frozen and Canned Seafood Market in US
Emerging opportunities include catering to the growing demand for ready-to-eat and value-added seafood products, tapping into untapped markets through innovative product formats and packaging, focusing on health-conscious and sustainable options, and leveraging e-commerce platforms to expand distribution channels.
Growth Accelerators in the Frozen and Canned Seafood Market in US Industry
Long-term growth is expected to be driven by continuous innovation in product development, expansion into new markets (e.g., online retailers, food service), strategic partnerships to improve supply chain efficiency, and targeted marketing campaigns highlighting the nutritional benefits and convenience of frozen and canned seafood. The adoption of advanced technologies for processing and preservation will further propel market expansion.
Key Players Shaping the Frozen and Canned Seafood Market in US Market
- Trident Seafood Corporation
- Beaver Street Fisheries
- Bolton Group SRL
- Pacific American Fish Company Inc
- High Liner Foods Inc
- Millennium Ocean Star Corporation
- Sysco Corporation
- Thai Union Group PCL
- American Tuna Inc
- Dongwon Industries Ltd
- Mowi ASA
Notable Milestones in Frozen and Canned Seafood Market in US Sector
- August 2022: American Tuna, Inc. received the 2022 MSC US Ocean Champion Award, highlighting the growing importance of sustainability in the industry.
- February 2022: Sysco's acquisition of The Coastal Companies expanded its reach and capabilities in the Mid-Atlantic region, impacting the fresh produce and value-added seafood segments.
- January 2022: Hain Celestial Group's acquisition of That’s How We Roll, while not directly related to seafood, signals the ongoing M&A activity in the broader food industry, indicating potential future consolidation in seafood as well.
In-Depth Frozen and Canned Seafood Market in US Market Outlook
The US frozen and canned seafood market is poised for continued growth, driven by evolving consumer preferences and technological advancements. Strategic investments in sustainable practices, expansion into new markets, and the introduction of innovative products will be crucial for achieving long-term success. The market presents significant opportunities for established players and new entrants seeking to capitalize on the growing demand for convenient, healthy, and sustainably sourced seafood. Further consolidation through mergers and acquisitions is also anticipated.
Frozen and Canned Seafood Market in US Segmentation
-
1. Type
- 1.1. Fish
- 1.2. Shrimp
- 1.3. Other Seafood
-
2. Distribution Channel
-
2.1. Off-Trade
- 2.1.1. Convenience Stores
- 2.1.2. Online Channel
- 2.1.3. Supermarkets and Hypermarkets
- 2.1.4. Others
- 2.2. On-Trade
-
2.1. Off-Trade
Frozen and Canned Seafood Market in US Segmentation By Geography
-
1. North America
- 1.1. United States
- 1.2. Canada
- 1.3. Mexico
-
2. South America
- 2.1. Brazil
- 2.2. Argentina
- 2.3. Rest of South America
-
3. Europe
- 3.1. United Kingdom
- 3.2. Germany
- 3.3. France
- 3.4. Italy
- 3.5. Spain
- 3.6. Russia
- 3.7. Benelux
- 3.8. Nordics
- 3.9. Rest of Europe
-
4. Middle East & Africa
- 4.1. Turkey
- 4.2. Israel
- 4.3. GCC
- 4.4. North Africa
- 4.5. South Africa
- 4.6. Rest of Middle East & Africa
-
5. Asia Pacific
- 5.1. China
- 5.2. India
- 5.3. Japan
- 5.4. South Korea
- 5.5. ASEAN
- 5.6. Oceania
- 5.7. Rest of Asia Pacific
Frozen and Canned Seafood Market in US REPORT HIGHLIGHTS
| Aspects | Details |
|---|---|
| Study Period | 2019-2033 |
| Base Year | 2024 |
| Estimated Year | 2025 |
| Forecast Period | 2025-2033 |
| Historical Period | 2019-2024 |
| Growth Rate | CAGR of 3.90% from 2019-2033 |
| Segmentation |
|
Table of Contents
- 1. Introduction
- 1.1. Research Scope
- 1.2. Market Segmentation
- 1.3. Research Methodology
- 1.4. Definitions and Assumptions
- 2. Executive Summary
- 2.1. Introduction
- 3. Market Dynamics
- 3.1. Introduction
- 3.2. Market Drivers
- 3.2.1. Growing Demand for Free-From Foods Boosts Market Growth; Growing Intolerance Toward Gluten and the Prevalence of Celiac Disease
- 3.3. Market Restrains
- 3.3.1. Price Fluctuations of Raw Material May Affect Growth
- 3.4. Market Trends
- 3.4.1. OTHER KEY INDUSTRY TRENDS COVERED IN THE REPORT
- 4. Market Factor Analysis
- 4.1. Porters Five Forces
- 4.2. Supply/Value Chain
- 4.3. PESTEL analysis
- 4.4. Market Entropy
- 4.5. Patent/Trademark Analysis
- 5. Global Frozen and Canned Seafood Market in US Analysis, Insights and Forecast, 2019-2031
- 5.1. Market Analysis, Insights and Forecast - by Type
- 5.1.1. Fish
- 5.1.2. Shrimp
- 5.1.3. Other Seafood
- 5.2. Market Analysis, Insights and Forecast - by Distribution Channel
- 5.2.1. Off-Trade
- 5.2.1.1. Convenience Stores
- 5.2.1.2. Online Channel
- 5.2.1.3. Supermarkets and Hypermarkets
- 5.2.1.4. Others
- 5.2.2. On-Trade
- 5.2.1. Off-Trade
- 5.3. Market Analysis, Insights and Forecast - by Region
- 5.3.1. North America
- 5.3.2. South America
- 5.3.3. Europe
- 5.3.4. Middle East & Africa
- 5.3.5. Asia Pacific
- 5.1. Market Analysis, Insights and Forecast - by Type
- 6. North America Frozen and Canned Seafood Market in US Analysis, Insights and Forecast, 2019-2031
- 6.1. Market Analysis, Insights and Forecast - by Type
- 6.1.1. Fish
- 6.1.2. Shrimp
- 6.1.3. Other Seafood
- 6.2. Market Analysis, Insights and Forecast - by Distribution Channel
- 6.2.1. Off-Trade
- 6.2.1.1. Convenience Stores
- 6.2.1.2. Online Channel
- 6.2.1.3. Supermarkets and Hypermarkets
- 6.2.1.4. Others
- 6.2.2. On-Trade
- 6.2.1. Off-Trade
- 6.1. Market Analysis, Insights and Forecast - by Type
- 7. South America Frozen and Canned Seafood Market in US Analysis, Insights and Forecast, 2019-2031
- 7.1. Market Analysis, Insights and Forecast - by Type
- 7.1.1. Fish
- 7.1.2. Shrimp
- 7.1.3. Other Seafood
- 7.2. Market Analysis, Insights and Forecast - by Distribution Channel
- 7.2.1. Off-Trade
- 7.2.1.1. Convenience Stores
- 7.2.1.2. Online Channel
- 7.2.1.3. Supermarkets and Hypermarkets
- 7.2.1.4. Others
- 7.2.2. On-Trade
- 7.2.1. Off-Trade
- 7.1. Market Analysis, Insights and Forecast - by Type
- 8. Europe Frozen and Canned Seafood Market in US Analysis, Insights and Forecast, 2019-2031
- 8.1. Market Analysis, Insights and Forecast - by Type
- 8.1.1. Fish
- 8.1.2. Shrimp
- 8.1.3. Other Seafood
- 8.2. Market Analysis, Insights and Forecast - by Distribution Channel
- 8.2.1. Off-Trade
- 8.2.1.1. Convenience Stores
- 8.2.1.2. Online Channel
- 8.2.1.3. Supermarkets and Hypermarkets
- 8.2.1.4. Others
- 8.2.2. On-Trade
- 8.2.1. Off-Trade
- 8.1. Market Analysis, Insights and Forecast - by Type
- 9. Middle East & Africa Frozen and Canned Seafood Market in US Analysis, Insights and Forecast, 2019-2031
- 9.1. Market Analysis, Insights and Forecast - by Type
- 9.1.1. Fish
- 9.1.2. Shrimp
- 9.1.3. Other Seafood
- 9.2. Market Analysis, Insights and Forecast - by Distribution Channel
- 9.2.1. Off-Trade
- 9.2.1.1. Convenience Stores
- 9.2.1.2. Online Channel
- 9.2.1.3. Supermarkets and Hypermarkets
- 9.2.1.4. Others
- 9.2.2. On-Trade
- 9.2.1. Off-Trade
- 9.1. Market Analysis, Insights and Forecast - by Type
- 10. Asia Pacific Frozen and Canned Seafood Market in US Analysis, Insights and Forecast, 2019-2031
- 10.1. Market Analysis, Insights and Forecast - by Type
- 10.1.1. Fish
- 10.1.2. Shrimp
- 10.1.3. Other Seafood
- 10.2. Market Analysis, Insights and Forecast - by Distribution Channel
- 10.2.1. Off-Trade
- 10.2.1.1. Convenience Stores
- 10.2.1.2. Online Channel
- 10.2.1.3. Supermarkets and Hypermarkets
- 10.2.1.4. Others
- 10.2.2. On-Trade
- 10.2.1. Off-Trade
- 10.1. Market Analysis, Insights and Forecast - by Type
- 11. Northeast Frozen and Canned Seafood Market in US Analysis, Insights and Forecast, 2019-2031
- 12. Southeast Frozen and Canned Seafood Market in US Analysis, Insights and Forecast, 2019-2031
- 13. Midwest Frozen and Canned Seafood Market in US Analysis, Insights and Forecast, 2019-2031
- 14. Southwest Frozen and Canned Seafood Market in US Analysis, Insights and Forecast, 2019-2031
- 15. West Frozen and Canned Seafood Market in US Analysis, Insights and Forecast, 2019-2031
- 16. Competitive Analysis
- 16.1. Global Market Share Analysis 2024
- 16.2. Company Profiles
- 16.2.1 Trident Seafood Corporatio
- 16.2.1.1. Overview
- 16.2.1.2. Products
- 16.2.1.3. SWOT Analysis
- 16.2.1.4. Recent Developments
- 16.2.1.5. Financials (Based on Availability)
- 16.2.2 Beaver Street Fisheries
- 16.2.2.1. Overview
- 16.2.2.2. Products
- 16.2.2.3. SWOT Analysis
- 16.2.2.4. Recent Developments
- 16.2.2.5. Financials (Based on Availability)
- 16.2.3 Bolton Group SRL
- 16.2.3.1. Overview
- 16.2.3.2. Products
- 16.2.3.3. SWOT Analysis
- 16.2.3.4. Recent Developments
- 16.2.3.5. Financials (Based on Availability)
- 16.2.4 Pacific American Fish Company Inc
- 16.2.4.1. Overview
- 16.2.4.2. Products
- 16.2.4.3. SWOT Analysis
- 16.2.4.4. Recent Developments
- 16.2.4.5. Financials (Based on Availability)
- 16.2.5 High Liner Foods Inc
- 16.2.5.1. Overview
- 16.2.5.2. Products
- 16.2.5.3. SWOT Analysis
- 16.2.5.4. Recent Developments
- 16.2.5.5. Financials (Based on Availability)
- 16.2.6 Millennium Ocean Star Corporation
- 16.2.6.1. Overview
- 16.2.6.2. Products
- 16.2.6.3. SWOT Analysis
- 16.2.6.4. Recent Developments
- 16.2.6.5. Financials (Based on Availability)
- 16.2.7 Sysco Corporation
- 16.2.7.1. Overview
- 16.2.7.2. Products
- 16.2.7.3. SWOT Analysis
- 16.2.7.4. Recent Developments
- 16.2.7.5. Financials (Based on Availability)
- 16.2.8 Thai Union Group PCL
- 16.2.8.1. Overview
- 16.2.8.2. Products
- 16.2.8.3. SWOT Analysis
- 16.2.8.4. Recent Developments
- 16.2.8.5. Financials (Based on Availability)
- 16.2.9 American Tuna Inc
- 16.2.9.1. Overview
- 16.2.9.2. Products
- 16.2.9.3. SWOT Analysis
- 16.2.9.4. Recent Developments
- 16.2.9.5. Financials (Based on Availability)
- 16.2.10 Dongwon Industries Ltd
- 16.2.10.1. Overview
- 16.2.10.2. Products
- 16.2.10.3. SWOT Analysis
- 16.2.10.4. Recent Developments
- 16.2.10.5. Financials (Based on Availability)
- 16.2.11 Mowi ASA
- 16.2.11.1. Overview
- 16.2.11.2. Products
- 16.2.11.3. SWOT Analysis
- 16.2.11.4. Recent Developments
- 16.2.11.5. Financials (Based on Availability)
- 16.2.1 Trident Seafood Corporatio
List of Figures
- Figure 1: Global Frozen and Canned Seafood Market in US Revenue Breakdown (Million, %) by Region 2024 & 2032
- Figure 2: United states Frozen and Canned Seafood Market in US Revenue (Million), by Country 2024 & 2032
- Figure 3: United states Frozen and Canned Seafood Market in US Revenue Share (%), by Country 2024 & 2032
- Figure 4: North America Frozen and Canned Seafood Market in US Revenue (Million), by Type 2024 & 2032
- Figure 5: North America Frozen and Canned Seafood Market in US Revenue Share (%), by Type 2024 & 2032
- Figure 6: North America Frozen and Canned Seafood Market in US Revenue (Million), by Distribution Channel 2024 & 2032
- Figure 7: North America Frozen and Canned Seafood Market in US Revenue Share (%), by Distribution Channel 2024 & 2032
- Figure 8: North America Frozen and Canned Seafood Market in US Revenue (Million), by Country 2024 & 2032
- Figure 9: North America Frozen and Canned Seafood Market in US Revenue Share (%), by Country 2024 & 2032
- Figure 10: South America Frozen and Canned Seafood Market in US Revenue (Million), by Type 2024 & 2032
- Figure 11: South America Frozen and Canned Seafood Market in US Revenue Share (%), by Type 2024 & 2032
- Figure 12: South America Frozen and Canned Seafood Market in US Revenue (Million), by Distribution Channel 2024 & 2032
- Figure 13: South America Frozen and Canned Seafood Market in US Revenue Share (%), by Distribution Channel 2024 & 2032
- Figure 14: South America Frozen and Canned Seafood Market in US Revenue (Million), by Country 2024 & 2032
- Figure 15: South America Frozen and Canned Seafood Market in US Revenue Share (%), by Country 2024 & 2032
- Figure 16: Europe Frozen and Canned Seafood Market in US Revenue (Million), by Type 2024 & 2032
- Figure 17: Europe Frozen and Canned Seafood Market in US Revenue Share (%), by Type 2024 & 2032
- Figure 18: Europe Frozen and Canned Seafood Market in US Revenue (Million), by Distribution Channel 2024 & 2032
- Figure 19: Europe Frozen and Canned Seafood Market in US Revenue Share (%), by Distribution Channel 2024 & 2032
- Figure 20: Europe Frozen and Canned Seafood Market in US Revenue (Million), by Country 2024 & 2032
- Figure 21: Europe Frozen and Canned Seafood Market in US Revenue Share (%), by Country 2024 & 2032
- Figure 22: Middle East & Africa Frozen and Canned Seafood Market in US Revenue (Million), by Type 2024 & 2032
- Figure 23: Middle East & Africa Frozen and Canned Seafood Market in US Revenue Share (%), by Type 2024 & 2032
- Figure 24: Middle East & Africa Frozen and Canned Seafood Market in US Revenue (Million), by Distribution Channel 2024 & 2032
- Figure 25: Middle East & Africa Frozen and Canned Seafood Market in US Revenue Share (%), by Distribution Channel 2024 & 2032
- Figure 26: Middle East & Africa Frozen and Canned Seafood Market in US Revenue (Million), by Country 2024 & 2032
- Figure 27: Middle East & Africa Frozen and Canned Seafood Market in US Revenue Share (%), by Country 2024 & 2032
- Figure 28: Asia Pacific Frozen and Canned Seafood Market in US Revenue (Million), by Type 2024 & 2032
- Figure 29: Asia Pacific Frozen and Canned Seafood Market in US Revenue Share (%), by Type 2024 & 2032
- Figure 30: Asia Pacific Frozen and Canned Seafood Market in US Revenue (Million), by Distribution Channel 2024 & 2032
- Figure 31: Asia Pacific Frozen and Canned Seafood Market in US Revenue Share (%), by Distribution Channel 2024 & 2032
- Figure 32: Asia Pacific Frozen and Canned Seafood Market in US Revenue (Million), by Country 2024 & 2032
- Figure 33: Asia Pacific Frozen and Canned Seafood Market in US Revenue Share (%), by Country 2024 & 2032
List of Tables
- Table 1: Global Frozen and Canned Seafood Market in US Revenue Million Forecast, by Region 2019 & 2032
- Table 2: Global Frozen and Canned Seafood Market in US Revenue Million Forecast, by Type 2019 & 2032
- Table 3: Global Frozen and Canned Seafood Market in US Revenue Million Forecast, by Distribution Channel 2019 & 2032
- Table 4: Global Frozen and Canned Seafood Market in US Revenue Million Forecast, by Region 2019 & 2032
- Table 5: Global Frozen and Canned Seafood Market in US Revenue Million Forecast, by Country 2019 & 2032
- Table 6: Northeast Frozen and Canned Seafood Market in US Revenue (Million) Forecast, by Application 2019 & 2032
- Table 7: Southeast Frozen and Canned Seafood Market in US Revenue (Million) Forecast, by Application 2019 & 2032
- Table 8: Midwest Frozen and Canned Seafood Market in US Revenue (Million) Forecast, by Application 2019 & 2032
- Table 9: Southwest Frozen and Canned Seafood Market in US Revenue (Million) Forecast, by Application 2019 & 2032
- Table 10: West Frozen and Canned Seafood Market in US Revenue (Million) Forecast, by Application 2019 & 2032
- Table 11: Global Frozen and Canned Seafood Market in US Revenue Million Forecast, by Type 2019 & 2032
- Table 12: Global Frozen and Canned Seafood Market in US Revenue Million Forecast, by Distribution Channel 2019 & 2032
- Table 13: Global Frozen and Canned Seafood Market in US Revenue Million Forecast, by Country 2019 & 2032
- Table 14: United States Frozen and Canned Seafood Market in US Revenue (Million) Forecast, by Application 2019 & 2032
- Table 15: Canada Frozen and Canned Seafood Market in US Revenue (Million) Forecast, by Application 2019 & 2032
- Table 16: Mexico Frozen and Canned Seafood Market in US Revenue (Million) Forecast, by Application 2019 & 2032
- Table 17: Global Frozen and Canned Seafood Market in US Revenue Million Forecast, by Type 2019 & 2032
- Table 18: Global Frozen and Canned Seafood Market in US Revenue Million Forecast, by Distribution Channel 2019 & 2032
- Table 19: Global Frozen and Canned Seafood Market in US Revenue Million Forecast, by Country 2019 & 2032
- Table 20: Brazil Frozen and Canned Seafood Market in US Revenue (Million) Forecast, by Application 2019 & 2032
- Table 21: Argentina Frozen and Canned Seafood Market in US Revenue (Million) Forecast, by Application 2019 & 2032
- Table 22: Rest of South America Frozen and Canned Seafood Market in US Revenue (Million) Forecast, by Application 2019 & 2032
- Table 23: Global Frozen and Canned Seafood Market in US Revenue Million Forecast, by Type 2019 & 2032
- Table 24: Global Frozen and Canned Seafood Market in US Revenue Million Forecast, by Distribution Channel 2019 & 2032
- Table 25: Global Frozen and Canned Seafood Market in US Revenue Million Forecast, by Country 2019 & 2032
- Table 26: United Kingdom Frozen and Canned Seafood Market in US Revenue (Million) Forecast, by Application 2019 & 2032
- Table 27: Germany Frozen and Canned Seafood Market in US Revenue (Million) Forecast, by Application 2019 & 2032
- Table 28: France Frozen and Canned Seafood Market in US Revenue (Million) Forecast, by Application 2019 & 2032
- Table 29: Italy Frozen and Canned Seafood Market in US Revenue (Million) Forecast, by Application 2019 & 2032
- Table 30: Spain Frozen and Canned Seafood Market in US Revenue (Million) Forecast, by Application 2019 & 2032
- Table 31: Russia Frozen and Canned Seafood Market in US Revenue (Million) Forecast, by Application 2019 & 2032
- Table 32: Benelux Frozen and Canned Seafood Market in US Revenue (Million) Forecast, by Application 2019 & 2032
- Table 33: Nordics Frozen and Canned Seafood Market in US Revenue (Million) Forecast, by Application 2019 & 2032
- Table 34: Rest of Europe Frozen and Canned Seafood Market in US Revenue (Million) Forecast, by Application 2019 & 2032
- Table 35: Global Frozen and Canned Seafood Market in US Revenue Million Forecast, by Type 2019 & 2032
- Table 36: Global Frozen and Canned Seafood Market in US Revenue Million Forecast, by Distribution Channel 2019 & 2032
- Table 37: Global Frozen and Canned Seafood Market in US Revenue Million Forecast, by Country 2019 & 2032
- Table 38: Turkey Frozen and Canned Seafood Market in US Revenue (Million) Forecast, by Application 2019 & 2032
- Table 39: Israel Frozen and Canned Seafood Market in US Revenue (Million) Forecast, by Application 2019 & 2032
- Table 40: GCC Frozen and Canned Seafood Market in US Revenue (Million) Forecast, by Application 2019 & 2032
- Table 41: North Africa Frozen and Canned Seafood Market in US Revenue (Million) Forecast, by Application 2019 & 2032
- Table 42: South Africa Frozen and Canned Seafood Market in US Revenue (Million) Forecast, by Application 2019 & 2032
- Table 43: Rest of Middle East & Africa Frozen and Canned Seafood Market in US Revenue (Million) Forecast, by Application 2019 & 2032
- Table 44: Global Frozen and Canned Seafood Market in US Revenue Million Forecast, by Type 2019 & 2032
- Table 45: Global Frozen and Canned Seafood Market in US Revenue Million Forecast, by Distribution Channel 2019 & 2032
- Table 46: Global Frozen and Canned Seafood Market in US Revenue Million Forecast, by Country 2019 & 2032
- Table 47: China Frozen and Canned Seafood Market in US Revenue (Million) Forecast, by Application 2019 & 2032
- Table 48: India Frozen and Canned Seafood Market in US Revenue (Million) Forecast, by Application 2019 & 2032
- Table 49: Japan Frozen and Canned Seafood Market in US Revenue (Million) Forecast, by Application 2019 & 2032
- Table 50: South Korea Frozen and Canned Seafood Market in US Revenue (Million) Forecast, by Application 2019 & 2032
- Table 51: ASEAN Frozen and Canned Seafood Market in US Revenue (Million) Forecast, by Application 2019 & 2032
- Table 52: Oceania Frozen and Canned Seafood Market in US Revenue (Million) Forecast, by Application 2019 & 2032
- Table 53: Rest of Asia Pacific Frozen and Canned Seafood Market in US Revenue (Million) Forecast, by Application 2019 & 2032
Frequently Asked Questions
1. What is the projected Compound Annual Growth Rate (CAGR) of the Frozen and Canned Seafood Market in US?
The projected CAGR is approximately 3.90%.
2. Which companies are prominent players in the Frozen and Canned Seafood Market in US?
Key companies in the market include Trident Seafood Corporatio, Beaver Street Fisheries, Bolton Group SRL, Pacific American Fish Company Inc, High Liner Foods Inc, Millennium Ocean Star Corporation, Sysco Corporation, Thai Union Group PCL, American Tuna Inc, Dongwon Industries Ltd, Mowi ASA.
3. What are the main segments of the Frozen and Canned Seafood Market in US?
The market segments include Type, Distribution Channel.
4. Can you provide details about the market size?
The market size is estimated to be USD XX Million as of 2022.
5. What are some drivers contributing to market growth?
Growing Demand for Free-From Foods Boosts Market Growth; Growing Intolerance Toward Gluten and the Prevalence of Celiac Disease.
6. What are the notable trends driving market growth?
OTHER KEY INDUSTRY TRENDS COVERED IN THE REPORT.
7. Are there any restraints impacting market growth?
Price Fluctuations of Raw Material May Affect Growth.
8. Can you provide examples of recent developments in the market?
August 2022: The Marine Stewardship Council (MSC) awarded American Tuna, Inc. a 2022 MSC US Ocean Champion Award for their continued dedication to seafood sustainability and ocean health.February 2022: Sysco announced the completion of the acquisition of The Coastal Companies, a leading fresh produce distributor and value-added processer. The acquisition will operate as part of FreshPoint, Sysco’s specialty produce business, and enables FreshPoint to enhance its service in the important Mid-Atlantic region, strategically diversify its portfolio by adding retail and ready-to-eat capabilities, and add state-of-the-art facilities with capacity for growth.January 2022: The Hain Celestial Group, Inc. announced that it has entered into an agreement to acquire That’s How We Roll, the producer and marketer of ParmCrisps® and Thinsters®, two fast-growing, better-for-you brands offering delicious, convenient products that are consumer favorites from Clearlake Capital Group.
9. What pricing options are available for accessing the report?
Pricing options include single-user, multi-user, and enterprise licenses priced at USD 3800, USD 4500, and USD 5800 respectively.
10. Is the market size provided in terms of value or volume?
The market size is provided in terms of value, measured in Million.
11. Are there any specific market keywords associated with the report?
Yes, the market keyword associated with the report is "Frozen and Canned Seafood Market in US," which aids in identifying and referencing the specific market segment covered.
12. How do I determine which pricing option suits my needs best?
The pricing options vary based on user requirements and access needs. Individual users may opt for single-user licenses, while businesses requiring broader access may choose multi-user or enterprise licenses for cost-effective access to the report.
13. Are there any additional resources or data provided in the Frozen and Canned Seafood Market in US report?
While the report offers comprehensive insights, it's advisable to review the specific contents or supplementary materials provided to ascertain if additional resources or data are available.
14. How can I stay updated on further developments or reports in the Frozen and Canned Seafood Market in US?
To stay informed about further developments, trends, and reports in the Frozen and Canned Seafood Market in US, consider subscribing to industry newsletters, following relevant companies and organizations, or regularly checking reputable industry news sources and publications.
Methodology
Step 1 - Identification of Relevant Samples Size from Population Database


Step 2 - Approaches for Defining Global Market Size (Value, Volume* & Price*)

Note*: In applicable scenarios
Step 3 - Data Sources
Primary Research
- Web Analytics
- Survey Reports
- Research Institute
- Latest Research Reports
- Opinion Leaders
Secondary Research
- Annual Reports
- White Paper
- Latest Press Release
- Industry Association
- Paid Database
- Investor Presentations

Step 4 - Data Triangulation
Involves using different sources of information in order to increase the validity of a study
These sources are likely to be stakeholders in a program - participants, other researchers, program staff, other community members, and so on.
Then we put all data in single framework & apply various statistical tools to find out the dynamic on the market.
During the analysis stage, feedback from the stakeholder groups would be compared to determine areas of agreement as well as areas of divergence
