

Key Insights
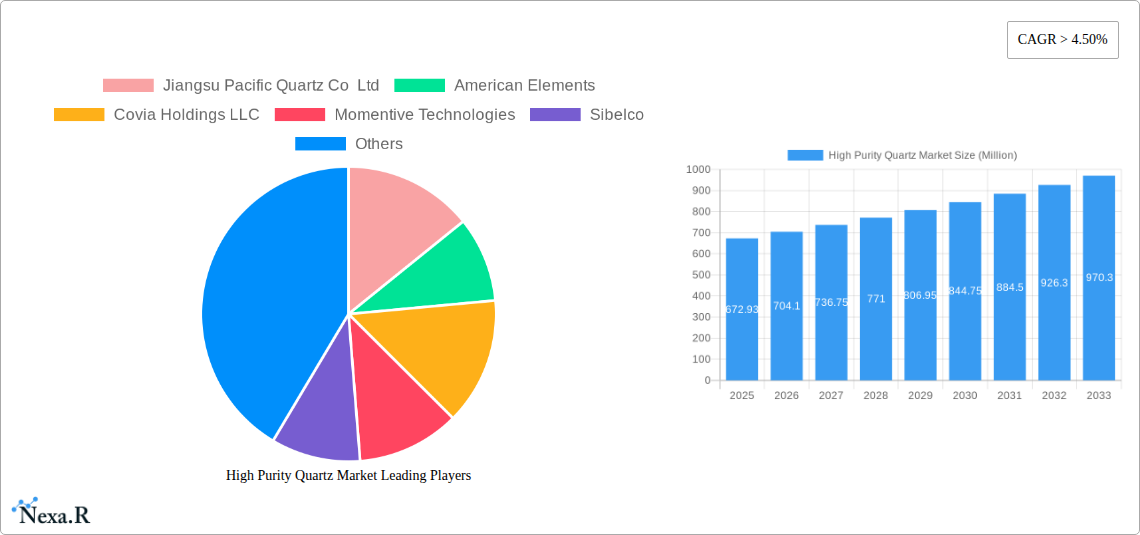
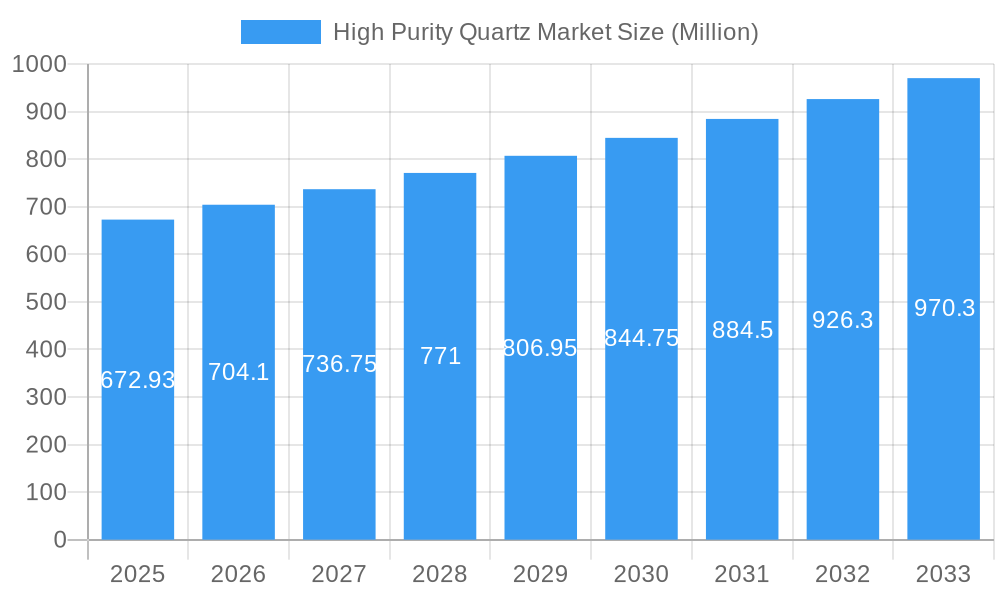
The global High Purity Quartz (HPQ) market is projected to experience robust growth, currently valued at approximately USD 672.93 million. Driven by the escalating demand for advanced electronics, renewable energy solutions, and sophisticated telecommunications infrastructure, the market is anticipated to expand at a Compound Annual Growth Rate (CAGR) exceeding 4.50% throughout the forecast period of 2025-2033. Key applications such as semiconductor manufacturing, solar energy production, and advanced lighting systems are the primary catalysts for this expansion. The increasing miniaturization and complexity of electronic components, coupled with the global push towards sustainable energy, are directly fueling the need for HPQ's exceptional properties – its purity, thermal stability, and optical transparency.
High Purity Quartz Market Market Size (In Million)
Emerging trends also point towards significant opportunities within the telecommunications and optics sectors, especially with the rollout of 5G technology and advancements in fiber optics. While the market benefits from strong demand, potential restraints may arise from the highly specialized nature of HPQ extraction and processing, which can lead to supply chain complexities and price volatility. Geographically, the Asia Pacific region, led by China and South Korea, is expected to dominate market share due to its substantial manufacturing base in semiconductors and electronics. North America and Europe also represent significant markets, driven by technological innovation and government initiatives supporting renewable energy adoption. Companies like Jiangsu Pacific Quartz Co Ltd, American Elements, and Sibelco are key players actively shaping the market landscape through their innovative products and strategic expansions.
High Purity Quartz Market Company Market Share
This in-depth report provides a detailed analysis of the global High Purity Quartz (HPQ) market, offering critical insights into market dynamics, growth trends, regional dominance, product landscape, drivers, challenges, opportunities, and the key players shaping this vital sector. Covering the period from 2019 to 2033, with a base and estimated year of 2025, this report is essential for industry professionals seeking to understand the evolving High Purity Quartz market size, High Purity Quartz market share, and future trajectory.
High Purity Quartz Market Dynamics & Structure
The global High Purity Quartz market is characterized by a moderate to high degree of concentration, with a few key players holding significant market share. Technological innovation remains a primary driver, fueled by the increasing demand for ultra-pure materials in advanced manufacturing processes. Stringent regulatory frameworks, particularly concerning environmental standards and material purity, also influence market operations and product development. Competitive product substitutes, though limited for the most demanding applications, are emerging in niche areas. End-user demographics are increasingly focused on high-growth sectors like semiconductors and solar energy. Mergers and acquisitions (M&A) trends are indicative of consolidation and strategic expansion within the industry, aiming to secure raw material supply and enhance technological capabilities. For instance, M&A deal volumes have seen a steady increase, reflecting a strategic imperative for vertical integration and market expansion. Innovation barriers are primarily related to the complex extraction and purification processes required to achieve the exceptionally high purity levels demanded by the market.
- Market Concentration: Moderate to High, with leading players dominating specific segments.
- Technological Innovation Drivers: Demand for higher purity, miniaturization in electronics, and efficiency in solar energy.
- Regulatory Frameworks: Focus on environmental compliance, purity standards, and responsible sourcing.
- Competitive Product Substitutes: Limited for critical applications, but emerging in less demanding segments.
- End-User Demographics: Dominated by semiconductor manufacturers, solar panel producers, and advanced lighting industries.
- M&A Trends: Increasing consolidation and strategic acquisitions to enhance supply chain security and technological portfolios.
- Innovation Barriers: High capital investment for purification technology, complex geological sourcing, and stringent quality control.
High Purity Quartz Market Growth Trends & Insights
The High Purity Quartz market is poised for robust growth, driven by the insatiable demand for advanced materials across multiple high-technology sectors. From 2019 to 2033, the market is expected to witness a significant expansion in its High Purity Quartz market size and High Purity Quartz market value. The CAGR for the forecast period is estimated at xx%, reflecting strong upward momentum. Adoption rates of HPQ in critical applications, such as semiconductor manufacturing for advanced microchips and solar energy for highly efficient photovoltaic cells, are accelerating. Technological disruptions, including advancements in purification techniques and novel applications, are continuously reshaping the market landscape. Consumer behavior shifts, particularly the global drive towards renewable energy and the proliferation of sophisticated electronic devices, are directly influencing the demand for ultra-pure quartz. Market penetration is projected to deepen, especially in developing economies that are rapidly expanding their semiconductor and solar manufacturing capabilities. The global High Purity Quartz market growth is further propelled by the increasing need for high-performance materials in telecommunications and specialized optics. This sustained demand underscores the foundational role of HPQ in driving innovation across a spectrum of cutting-edge industries.
Dominant Regions, Countries, or Segments in High Purity Quartz Market
The Semiconductor segment within the High Purity Quartz market stands as the dominant force, consistently driving significant demand and influencing global market trends. This segment's dominance is intrinsically linked to the ever-growing need for ultra-pure quartz in the manufacturing of silicon wafers, crucibles for crystal growth, and other critical components essential for producing advanced semiconductors. The intricate and sensitive nature of semiconductor fabrication necessitates materials with extremely low impurity levels, making high purity quartz an indispensable raw material. Economic policies that favor the expansion of domestic semiconductor manufacturing capabilities, coupled with substantial investments in research and development, further solidify the semiconductor segment's leading position. Infrastructure development specifically tailored to support advanced manufacturing facilities also plays a crucial role.
The global High Purity Quartz market share for the semiconductor application is estimated to be around xx% in 2025, with projected growth driven by the increasing complexity and miniaturization of microprocessors and memory chips. The Solar segment is another significant contributor to market growth, fueled by the global transition towards renewable energy sources. High purity quartz is vital for producing photovoltaic cells that convert sunlight into electricity with high efficiency. Government incentives, declining solar panel costs, and increasing environmental consciousness are propelling the adoption of solar energy, thereby boosting the demand for HPQ in this segment.
- Dominant Segment: Semiconductor Applications
- Key Drivers: Demand for ultra-pure silicon wafers, crucibles for crystal growth, and components for advanced microchip manufacturing.
- Market Share (2025): Approximately xx%.
- Growth Potential: High, driven by technological advancements and increasing global chip demand.
- Second Leading Segment: Solar Energy Applications
- Key Drivers: Expansion of renewable energy initiatives, increasing demand for efficient photovoltaic cells.
- Market Share (2025): Approximately xx%.
- Growth Potential: Strong, supported by global climate goals and energy transition policies.
- Other Significant Segments: Lighting, Telecom and Optics, Microelectronics.
- Drivers: Advancements in LED technology, high-speed telecommunications infrastructure, and specialized optical instruments.
High Purity Quartz Market Product Landscape
The High Purity Quartz market product landscape is defined by its focus on materials exhibiting exceptional purity levels, typically exceeding 99.999%. Key innovations revolve around enhancing purity through advanced purification processes like multi-stage leaching and high-temperature treatments. These advancements are crucial for meeting the stringent requirements of applications such as semiconductor wafer production, where even minute impurities can degrade performance. The primary products include fused quartz ingots, rods, and powders, each tailored for specific uses. Unique selling propositions for HPQ products lie in their thermal stability, chemical inertness, and optical transparency. Technological advancements are constantly pushing the boundaries of purity, enabling the creation of materials for next-generation electronics and advanced optical systems.
Key Drivers, Barriers & Challenges in High Purity Quartz Market
The High Purity Quartz market is propelled by several key drivers. The relentless demand from the semiconductor industry for purer materials to enable smaller, more powerful chips is a primary force. The global push for renewable energy, particularly solar power, also significantly fuels demand for HPQ in photovoltaic cell manufacturing. Technological advancements in lighting, telecommunications, and optics, which require high-performance materials, further contribute to market expansion.
Conversely, the market faces several significant barriers and challenges. Securing consistent and high-quality raw quartz reserves is a major hurdle due to the specific geological formations required. The complex and energy-intensive purification processes demand substantial capital investment, creating a high barrier to entry for new players. Supply chain disruptions, influenced by geopolitical factors and the geographical concentration of key mining and processing facilities, pose a constant threat. Additionally, stringent environmental regulations related to mining and chemical processing can impact operational costs and production timelines. Competitive pressures from alternative materials in some less demanding applications, although limited, also represent a challenge.
Emerging Opportunities in High Purity Quartz Market
Emerging opportunities in the High Purity Quartz market are largely centered around the continuous advancement of technology and the expansion of its applications. The growing demand for advanced optics in fields like augmented reality (AR) and virtual reality (VR) presents a significant untapped market. Furthermore, the development of next-generation semiconductor technologies, such as those for AI and quantum computing, will require even higher purity levels of quartz, opening avenues for specialized product development. The increasing adoption of high-power LED lighting solutions globally also presents a growing opportunity. Innovations in additive manufacturing (3D printing) for specialized quartz components could unlock new manufacturing possibilities and efficiencies.
Growth Accelerators in the High Purity Quartz Market Industry
Several key accelerators are driving long-term growth in the High Purity Quartz industry. Technological breakthroughs in ultra-purification techniques are continuously enhancing the quality and reducing the cost of HPQ production, making it more accessible for a wider range of applications. Strategic partnerships between HPQ suppliers and semiconductor and solar manufacturers are fostering innovation and ensuring a stable supply chain. Market expansion into emerging economies, particularly those investing heavily in high-tech manufacturing infrastructure, is a crucial growth catalyst. The development of novel applications for HPQ in advanced scientific instruments and medical devices is also poised to accelerate market growth.
Key Players Shaping the High Purity Quartz Market Market
- Jiangsu Pacific Quartz Co Ltd
- American Elements
- Covia Holdings LLC
- Momentive Technologies
- Sibelco
- Imerys
- ULTRA HPQ
- Russian Quartz LLC
- Australian Silica Quartz Group Ltd
- The Quartz Corp
Notable Milestones in High Purity Quartz Market Sector
- April 2023: Sibelco announced an investment of approximately USD 200 million to double high purity quartz (HPQ) installed capacity at its Spruce Pine facility in North Carolina, United States. This significant investment underscores the growing demand for HPQ and Sibelco's commitment to expanding its production capabilities to meet future market needs, particularly for the semiconductor and solar industries.
In-Depth High Purity Quartz Market Market Outlook
The future outlook for the High Purity Quartz market remains exceptionally bright, underpinned by persistent technological advancements and escalating demand from critical global industries. Growth accelerators such as breakthrough purification technologies and strategic collaborations will continue to drive market expansion and innovation. The increasing global emphasis on renewable energy and the rapid evolution of the semiconductor sector are set to further solidify HPQ's indispensable role. Emerging applications in advanced optics, AI-driven technologies, and specialized scientific equipment represent significant untapped potential. Industry players are well-positioned to capitalize on these opportunities through continuous investment in research and development, strategic capacity expansions, and a focus on sustainable sourcing and production practices, ensuring the long-term viability and growth of the High Purity Quartz market.
High Purity Quartz Market Segmentation
-
1. Application
- 1.1. Semiconductor
- 1.2. Solar
- 1.3. Lighting
- 1.4. Telecom and Optics
- 1.5. Microelectronics
- 1.6. Others
High Purity Quartz Market Segmentation By Geography
-
1. Asia Pacific
- 1.1. China
- 1.2. India
- 1.3. Japan
- 1.4. South Korea
- 1.5. Rest of Asia Pacific
-
2. North America
- 2.1. United States
- 2.2. Canada
- 2.3. Mexico
-
3. Europe
- 3.1. Germany
- 3.2. United Kingdom
- 3.3. Italy
- 3.4. France
- 3.5. Rest of Europe
-
4. South America
- 4.1. Brazil
- 4.2. Argentina
- 4.3. Rest of South America
-
5. Middle East and Africa
- 5.1. Saudi Arabia
- 5.2. South Africa
- 5.3. Rest of Middle East and Africa
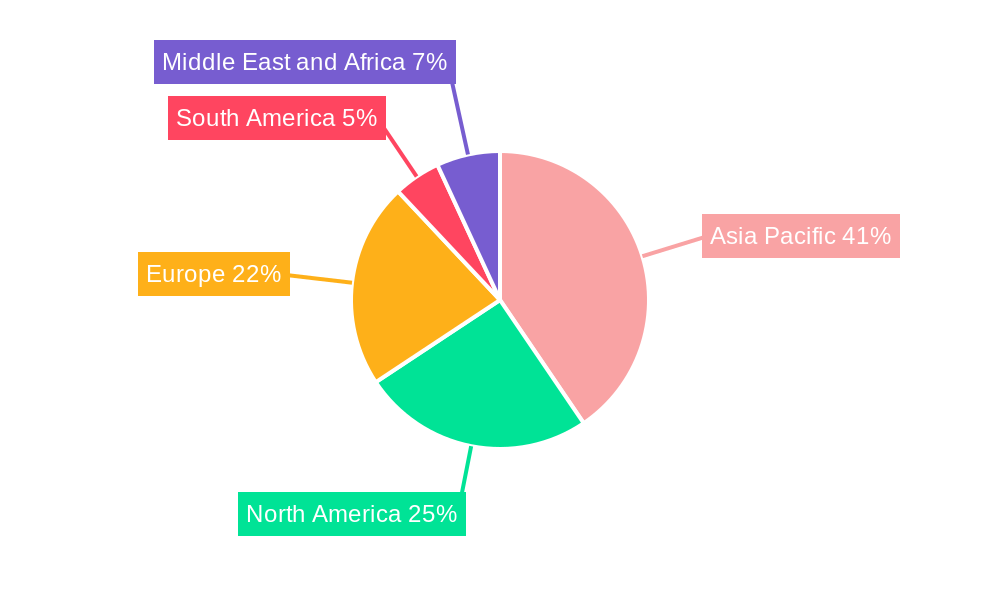
High Purity Quartz Market Regional Market Share
Geographic Coverage of High Purity Quartz Market
High Purity Quartz Market REPORT HIGHLIGHTS
| Aspects | Details |
|---|---|
| Study Period | 2020-2034 |
| Base Year | 2025 |
| Estimated Year | 2026 |
| Forecast Period | 2026-2034 |
| Historical Period | 2020-2025 |
| Growth Rate | CAGR of > 4.50% from 2020-2034 |
| Segmentation |
|
Table of Contents
- 1. Introduction
- 1.1. Research Scope
- 1.2. Market Segmentation
- 1.3. Research Objective
- 1.4. Definitions and Assumptions
- 2. Executive Summary
- 2.1. Market Snapshot
- 3. Market Dynamics
- 3.1. Market Drivers
- 3.2. Market Restrains
- 3.3. Market Trends
- 3.4. Market Opportunities
- 4. Market Factor Analysis
- 4.1. Porters Five Forces
- 4.1.1. Bargaining Power of Suppliers
- 4.1.2. Bargaining Power of Buyers
- 4.1.3. Threat of New Entrants
- 4.1.4. Threat of Substitutes
- 4.1.5. Competitive Rivalry
- 4.2. PESTEL analysis
- 4.3. BCG Analysis
- 4.3.1. Stars (High Growth, High Market Share)
- 4.3.2. Cash Cows (Low Growth, High Market Share)
- 4.3.3. Question Mark (High Growth, Low Market Share)
- 4.3.4. Dogs (Low Growth, Low Market Share)
- 4.4. Ansoff Matrix Analysis
- 4.5. Supply Chain Analysis
- 4.6. Regulatory Landscape
- 4.7. Current Market Potential and Opportunity Assessment (TAM–SAM–SOM Framework)
- 4.8. NRP Analyst Note
- 4.1. Porters Five Forces
- 5. Market Analysis, Insights and Forecast 2021-2033
- 5.1. Market Analysis, Insights and Forecast - by Application
- 5.1.1. Semiconductor
- 5.1.2. Solar
- 5.1.3. Lighting
- 5.1.4. Telecom and Optics
- 5.1.5. Microelectronics
- 5.1.6. Others
- 5.2. Market Analysis, Insights and Forecast - by Region
- 5.2.1. Asia Pacific
- 5.2.2. North America
- 5.2.3. Europe
- 5.2.4. South America
- 5.2.5. Middle East and Africa
- 5.1. Market Analysis, Insights and Forecast - by Application
- 6. Global High Purity Quartz Market Analysis, Insights and Forecast, 2021-2033
- 6.1. Market Analysis, Insights and Forecast - by Application
- 6.1.1. Semiconductor
- 6.1.2. Solar
- 6.1.3. Lighting
- 6.1.4. Telecom and Optics
- 6.1.5. Microelectronics
- 6.1.6. Others
- 6.1. Market Analysis, Insights and Forecast - by Application
- 7. Asia Pacific High Purity Quartz Market Analysis, Insights and Forecast, 2020-2032
- 7.1. Market Analysis, Insights and Forecast - by Application
- 7.1.1. Semiconductor
- 7.1.2. Solar
- 7.1.3. Lighting
- 7.1.4. Telecom and Optics
- 7.1.5. Microelectronics
- 7.1.6. Others
- 7.1. Market Analysis, Insights and Forecast - by Application
- 8. North America High Purity Quartz Market Analysis, Insights and Forecast, 2020-2032
- 8.1. Market Analysis, Insights and Forecast - by Application
- 8.1.1. Semiconductor
- 8.1.2. Solar
- 8.1.3. Lighting
- 8.1.4. Telecom and Optics
- 8.1.5. Microelectronics
- 8.1.6. Others
- 8.1. Market Analysis, Insights and Forecast - by Application
- 9. Europe High Purity Quartz Market Analysis, Insights and Forecast, 2020-2032
- 9.1. Market Analysis, Insights and Forecast - by Application
- 9.1.1. Semiconductor
- 9.1.2. Solar
- 9.1.3. Lighting
- 9.1.4. Telecom and Optics
- 9.1.5. Microelectronics
- 9.1.6. Others
- 9.1. Market Analysis, Insights and Forecast - by Application
- 10. South America High Purity Quartz Market Analysis, Insights and Forecast, 2020-2032
- 10.1. Market Analysis, Insights and Forecast - by Application
- 10.1.1. Semiconductor
- 10.1.2. Solar
- 10.1.3. Lighting
- 10.1.4. Telecom and Optics
- 10.1.5. Microelectronics
- 10.1.6. Others
- 10.1. Market Analysis, Insights and Forecast - by Application
- 11. Middle East and Africa High Purity Quartz Market Analysis, Insights and Forecast, 2020-2032
- 11.1. Market Analysis, Insights and Forecast - by Application
- 11.1.1. Semiconductor
- 11.1.2. Solar
- 11.1.3. Lighting
- 11.1.4. Telecom and Optics
- 11.1.5. Microelectronics
- 11.1.6. Others
- 11.1. Market Analysis, Insights and Forecast - by Application
- 12. Competitive Analysis
- 12.1. Company Profiles
- 12.1.1 Jiangsu Pacific Quartz Co Ltd
- 12.1.1.1. Company Overview
- 12.1.1.2. Products
- 12.1.1.3. Company Financials
- 12.1.1.4. SWOT Analysis
- 12.1.2 American Elements
- 12.1.2.1. Company Overview
- 12.1.2.2. Products
- 12.1.2.3. Company Financials
- 12.1.2.4. SWOT Analysis
- 12.1.3 Covia Holdings LLC
- 12.1.3.1. Company Overview
- 12.1.3.2. Products
- 12.1.3.3. Company Financials
- 12.1.3.4. SWOT Analysis
- 12.1.4 Momentive Technologies
- 12.1.4.1. Company Overview
- 12.1.4.2. Products
- 12.1.4.3. Company Financials
- 12.1.4.4. SWOT Analysis
- 12.1.5 Sibelco
- 12.1.5.1. Company Overview
- 12.1.5.2. Products
- 12.1.5.3. Company Financials
- 12.1.5.4. SWOT Analysis
- 12.1.6 Imerys
- 12.1.6.1. Company Overview
- 12.1.6.2. Products
- 12.1.6.3. Company Financials
- 12.1.6.4. SWOT Analysis
- 12.1.7 ULTRA HPQ
- 12.1.7.1. Company Overview
- 12.1.7.2. Products
- 12.1.7.3. Company Financials
- 12.1.7.4. SWOT Analysis
- 12.1.8 Russian Quartz LLC
- 12.1.8.1. Company Overview
- 12.1.8.2. Products
- 12.1.8.3. Company Financials
- 12.1.8.4. SWOT Analysis
- 12.1.9 Australian Silica Quartz Group Ltd
- 12.1.9.1. Company Overview
- 12.1.9.2. Products
- 12.1.9.3. Company Financials
- 12.1.9.4. SWOT Analysis
- 12.1.10 The Quartz Corp
- 12.1.10.1. Company Overview
- 12.1.10.2. Products
- 12.1.10.3. Company Financials
- 12.1.10.4. SWOT Analysis
- 12.1.1 Jiangsu Pacific Quartz Co Ltd
- 12.2. Market Entropy
- 12.2.1 Company's Key Areas Served
- 12.2.2 Recent Developments
- 12.3. Company Market Share Analysis 2025
- 12.3.1 Top 5 Companies Market Share Analysis
- 12.3.2 Top 3 Companies Market Share Analysis
- 12.4. List of Potential Customers
- 13. Research Methodology
List of Figures
- Figure 1: Global High Purity Quartz Market Revenue Breakdown (Million, %) by Region 2025 & 2033
- Figure 2: Global High Purity Quartz Market Volume Breakdown (K Tons, %) by Region 2025 & 2033
- Figure 3: Asia Pacific High Purity Quartz Market Revenue (Million), by Application 2025 & 2033
- Figure 4: Asia Pacific High Purity Quartz Market Volume (K Tons), by Application 2025 & 2033
- Figure 5: Asia Pacific High Purity Quartz Market Revenue Share (%), by Application 2025 & 2033
- Figure 6: Asia Pacific High Purity Quartz Market Volume Share (%), by Application 2025 & 2033
- Figure 7: Asia Pacific High Purity Quartz Market Revenue (Million), by Country 2025 & 2033
- Figure 8: Asia Pacific High Purity Quartz Market Volume (K Tons), by Country 2025 & 2033
- Figure 9: Asia Pacific High Purity Quartz Market Revenue Share (%), by Country 2025 & 2033
- Figure 10: Asia Pacific High Purity Quartz Market Volume Share (%), by Country 2025 & 2033
- Figure 11: North America High Purity Quartz Market Revenue (Million), by Application 2025 & 2033
- Figure 12: North America High Purity Quartz Market Volume (K Tons), by Application 2025 & 2033
- Figure 13: North America High Purity Quartz Market Revenue Share (%), by Application 2025 & 2033
- Figure 14: North America High Purity Quartz Market Volume Share (%), by Application 2025 & 2033
- Figure 15: North America High Purity Quartz Market Revenue (Million), by Country 2025 & 2033
- Figure 16: North America High Purity Quartz Market Volume (K Tons), by Country 2025 & 2033
- Figure 17: North America High Purity Quartz Market Revenue Share (%), by Country 2025 & 2033
- Figure 18: North America High Purity Quartz Market Volume Share (%), by Country 2025 & 2033
- Figure 19: Europe High Purity Quartz Market Revenue (Million), by Application 2025 & 2033
- Figure 20: Europe High Purity Quartz Market Volume (K Tons), by Application 2025 & 2033
- Figure 21: Europe High Purity Quartz Market Revenue Share (%), by Application 2025 & 2033
- Figure 22: Europe High Purity Quartz Market Volume Share (%), by Application 2025 & 2033
- Figure 23: Europe High Purity Quartz Market Revenue (Million), by Country 2025 & 2033
- Figure 24: Europe High Purity Quartz Market Volume (K Tons), by Country 2025 & 2033
- Figure 25: Europe High Purity Quartz Market Revenue Share (%), by Country 2025 & 2033
- Figure 26: Europe High Purity Quartz Market Volume Share (%), by Country 2025 & 2033
- Figure 27: South America High Purity Quartz Market Revenue (Million), by Application 2025 & 2033
- Figure 28: South America High Purity Quartz Market Volume (K Tons), by Application 2025 & 2033
- Figure 29: South America High Purity Quartz Market Revenue Share (%), by Application 2025 & 2033
- Figure 30: South America High Purity Quartz Market Volume Share (%), by Application 2025 & 2033
- Figure 31: South America High Purity Quartz Market Revenue (Million), by Country 2025 & 2033
- Figure 32: South America High Purity Quartz Market Volume (K Tons), by Country 2025 & 2033
- Figure 33: South America High Purity Quartz Market Revenue Share (%), by Country 2025 & 2033
- Figure 34: South America High Purity Quartz Market Volume Share (%), by Country 2025 & 2033
- Figure 35: Middle East and Africa High Purity Quartz Market Revenue (Million), by Application 2025 & 2033
- Figure 36: Middle East and Africa High Purity Quartz Market Volume (K Tons), by Application 2025 & 2033
- Figure 37: Middle East and Africa High Purity Quartz Market Revenue Share (%), by Application 2025 & 2033
- Figure 38: Middle East and Africa High Purity Quartz Market Volume Share (%), by Application 2025 & 2033
- Figure 39: Middle East and Africa High Purity Quartz Market Revenue (Million), by Country 2025 & 2033
- Figure 40: Middle East and Africa High Purity Quartz Market Volume (K Tons), by Country 2025 & 2033
- Figure 41: Middle East and Africa High Purity Quartz Market Revenue Share (%), by Country 2025 & 2033
- Figure 42: Middle East and Africa High Purity Quartz Market Volume Share (%), by Country 2025 & 2033
List of Tables
- Table 1: Global High Purity Quartz Market Revenue Million Forecast, by Application 2020 & 2033
- Table 2: Global High Purity Quartz Market Volume K Tons Forecast, by Application 2020 & 2033
- Table 3: Global High Purity Quartz Market Revenue Million Forecast, by Region 2020 & 2033
- Table 4: Global High Purity Quartz Market Volume K Tons Forecast, by Region 2020 & 2033
- Table 5: Global High Purity Quartz Market Revenue Million Forecast, by Application 2020 & 2033
- Table 6: Global High Purity Quartz Market Volume K Tons Forecast, by Application 2020 & 2033
- Table 7: Global High Purity Quartz Market Revenue Million Forecast, by Country 2020 & 2033
- Table 8: Global High Purity Quartz Market Volume K Tons Forecast, by Country 2020 & 2033
- Table 9: China High Purity Quartz Market Revenue (Million) Forecast, by Application 2020 & 2033
- Table 10: China High Purity Quartz Market Volume (K Tons) Forecast, by Application 2020 & 2033
- Table 11: India High Purity Quartz Market Revenue (Million) Forecast, by Application 2020 & 2033
- Table 12: India High Purity Quartz Market Volume (K Tons) Forecast, by Application 2020 & 2033
- Table 13: Japan High Purity Quartz Market Revenue (Million) Forecast, by Application 2020 & 2033
- Table 14: Japan High Purity Quartz Market Volume (K Tons) Forecast, by Application 2020 & 2033
- Table 15: South Korea High Purity Quartz Market Revenue (Million) Forecast, by Application 2020 & 2033
- Table 16: South Korea High Purity Quartz Market Volume (K Tons) Forecast, by Application 2020 & 2033
- Table 17: Rest of Asia Pacific High Purity Quartz Market Revenue (Million) Forecast, by Application 2020 & 2033
- Table 18: Rest of Asia Pacific High Purity Quartz Market Volume (K Tons) Forecast, by Application 2020 & 2033
- Table 19: Global High Purity Quartz Market Revenue Million Forecast, by Application 2020 & 2033
- Table 20: Global High Purity Quartz Market Volume K Tons Forecast, by Application 2020 & 2033
- Table 21: Global High Purity Quartz Market Revenue Million Forecast, by Country 2020 & 2033
- Table 22: Global High Purity Quartz Market Volume K Tons Forecast, by Country 2020 & 2033
- Table 23: United States High Purity Quartz Market Revenue (Million) Forecast, by Application 2020 & 2033
- Table 24: United States High Purity Quartz Market Volume (K Tons) Forecast, by Application 2020 & 2033
- Table 25: Canada High Purity Quartz Market Revenue (Million) Forecast, by Application 2020 & 2033
- Table 26: Canada High Purity Quartz Market Volume (K Tons) Forecast, by Application 2020 & 2033
- Table 27: Mexico High Purity Quartz Market Revenue (Million) Forecast, by Application 2020 & 2033
- Table 28: Mexico High Purity Quartz Market Volume (K Tons) Forecast, by Application 2020 & 2033
- Table 29: Global High Purity Quartz Market Revenue Million Forecast, by Application 2020 & 2033
- Table 30: Global High Purity Quartz Market Volume K Tons Forecast, by Application 2020 & 2033
- Table 31: Global High Purity Quartz Market Revenue Million Forecast, by Country 2020 & 2033
- Table 32: Global High Purity Quartz Market Volume K Tons Forecast, by Country 2020 & 2033
- Table 33: Germany High Purity Quartz Market Revenue (Million) Forecast, by Application 2020 & 2033
- Table 34: Germany High Purity Quartz Market Volume (K Tons) Forecast, by Application 2020 & 2033
- Table 35: United Kingdom High Purity Quartz Market Revenue (Million) Forecast, by Application 2020 & 2033
- Table 36: United Kingdom High Purity Quartz Market Volume (K Tons) Forecast, by Application 2020 & 2033
- Table 37: Italy High Purity Quartz Market Revenue (Million) Forecast, by Application 2020 & 2033
- Table 38: Italy High Purity Quartz Market Volume (K Tons) Forecast, by Application 2020 & 2033
- Table 39: France High Purity Quartz Market Revenue (Million) Forecast, by Application 2020 & 2033
- Table 40: France High Purity Quartz Market Volume (K Tons) Forecast, by Application 2020 & 2033
- Table 41: Rest of Europe High Purity Quartz Market Revenue (Million) Forecast, by Application 2020 & 2033
- Table 42: Rest of Europe High Purity Quartz Market Volume (K Tons) Forecast, by Application 2020 & 2033
- Table 43: Global High Purity Quartz Market Revenue Million Forecast, by Application 2020 & 2033
- Table 44: Global High Purity Quartz Market Volume K Tons Forecast, by Application 2020 & 2033
- Table 45: Global High Purity Quartz Market Revenue Million Forecast, by Country 2020 & 2033
- Table 46: Global High Purity Quartz Market Volume K Tons Forecast, by Country 2020 & 2033
- Table 47: Brazil High Purity Quartz Market Revenue (Million) Forecast, by Application 2020 & 2033
- Table 48: Brazil High Purity Quartz Market Volume (K Tons) Forecast, by Application 2020 & 2033
- Table 49: Argentina High Purity Quartz Market Revenue (Million) Forecast, by Application 2020 & 2033
- Table 50: Argentina High Purity Quartz Market Volume (K Tons) Forecast, by Application 2020 & 2033
- Table 51: Rest of South America High Purity Quartz Market Revenue (Million) Forecast, by Application 2020 & 2033
- Table 52: Rest of South America High Purity Quartz Market Volume (K Tons) Forecast, by Application 2020 & 2033
- Table 53: Global High Purity Quartz Market Revenue Million Forecast, by Application 2020 & 2033
- Table 54: Global High Purity Quartz Market Volume K Tons Forecast, by Application 2020 & 2033
- Table 55: Global High Purity Quartz Market Revenue Million Forecast, by Country 2020 & 2033
- Table 56: Global High Purity Quartz Market Volume K Tons Forecast, by Country 2020 & 2033
- Table 57: Saudi Arabia High Purity Quartz Market Revenue (Million) Forecast, by Application 2020 & 2033
- Table 58: Saudi Arabia High Purity Quartz Market Volume (K Tons) Forecast, by Application 2020 & 2033
- Table 59: South Africa High Purity Quartz Market Revenue (Million) Forecast, by Application 2020 & 2033
- Table 60: South Africa High Purity Quartz Market Volume (K Tons) Forecast, by Application 2020 & 2033
- Table 61: Rest of Middle East and Africa High Purity Quartz Market Revenue (Million) Forecast, by Application 2020 & 2033
- Table 62: Rest of Middle East and Africa High Purity Quartz Market Volume (K Tons) Forecast, by Application 2020 & 2033
Frequently Asked Questions
1. What is the projected Compound Annual Growth Rate (CAGR) of the High Purity Quartz Market?
The projected CAGR is approximately > 4.50%.
2. Which companies are prominent players in the High Purity Quartz Market?
Key companies in the market include Jiangsu Pacific Quartz Co Ltd, American Elements, Covia Holdings LLC, Momentive Technologies, Sibelco, Imerys, ULTRA HPQ, Russian Quartz LLC, Australian Silica Quartz Group Ltd, The Quartz Corp.
3. What are the main segments of the High Purity Quartz Market?
The market segments include Application.
4. Can you provide details about the market size?
The market size is estimated to be USD 672.93 Million as of 2022.
5. What are some drivers contributing to market growth?
Growing Demand for Semiconductor ICs; Increasing Adoption in Solar Industry; Other Drivers.
6. What are the notable trends driving market growth?
Growing Demand from Semiconductor Industry.
7. Are there any restraints impacting market growth?
The Fluctuating Prices of Raw Materials; Other Restraints.
8. Can you provide examples of recent developments in the market?
April 2023: Sibelco announced an investment of approx. USD 200 million to double high purity quartz (HPQ) installed capacity at its Spruce Pine facility in North Carolina, United States.
9. What pricing options are available for accessing the report?
Pricing options include single-user, multi-user, and enterprise licenses priced at USD 4750, USD 5250, and USD 8750 respectively.
10. Is the market size provided in terms of value or volume?
The market size is provided in terms of value, measured in Million and volume, measured in K Tons.
11. Are there any specific market keywords associated with the report?
Yes, the market keyword associated with the report is "High Purity Quartz Market," which aids in identifying and referencing the specific market segment covered.
12. How do I determine which pricing option suits my needs best?
The pricing options vary based on user requirements and access needs. Individual users may opt for single-user licenses, while businesses requiring broader access may choose multi-user or enterprise licenses for cost-effective access to the report.
13. Are there any additional resources or data provided in the High Purity Quartz Market report?
While the report offers comprehensive insights, it's advisable to review the specific contents or supplementary materials provided to ascertain if additional resources or data are available.
14. How can I stay updated on further developments or reports in the High Purity Quartz Market?
To stay informed about further developments, trends, and reports in the High Purity Quartz Market, consider subscribing to industry newsletters, following relevant companies and organizations, or regularly checking reputable industry news sources and publications.
Methodology
Step 1 - Identification of Relevant Samples Size from Population Database


Step 2 - Approaches for Defining Global Market Size (Value, Volume* & Price*)

Note*: In applicable scenarios
Step 3 - Data Sources
Primary Research
- Web Analytics
- Survey Reports
- Research Institute
- Latest Research Reports
- Opinion Leaders
Secondary Research
- Annual Reports
- White Paper
- Latest Press Release
- Industry Association
- Paid Database
- Investor Presentations

Step 4 - Data Triangulation
Involves using different sources of information in order to increase the validity of a study
These sources are likely to be stakeholders in a program - participants, other researchers, program staff, other community members, and so on.
Then we put all data in single framework & apply various statistical tools to find out the dynamic on the market.
During the analysis stage, feedback from the stakeholder groups would be compared to determine areas of agreement as well as areas of divergence