

Key Insights
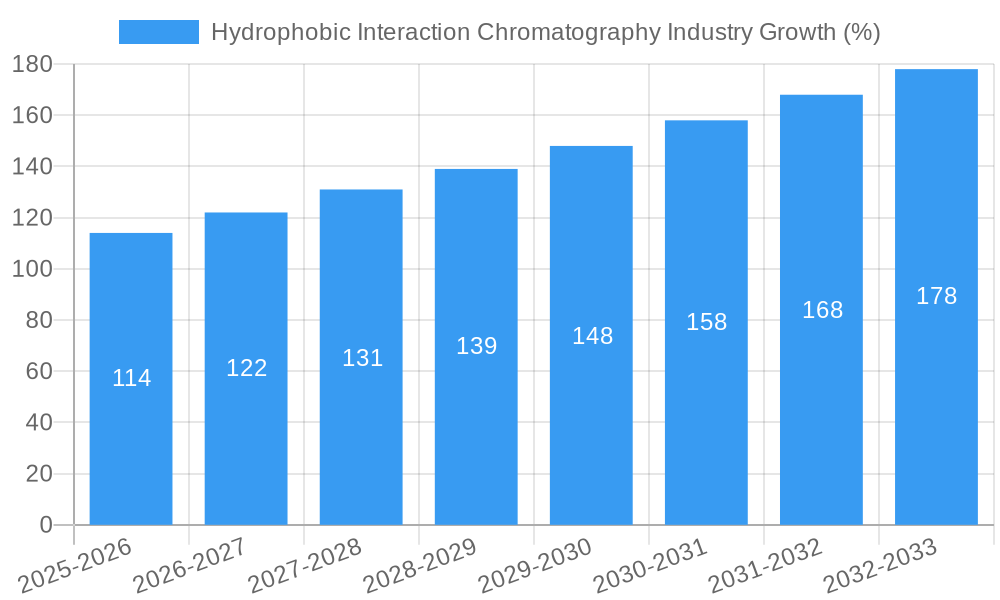
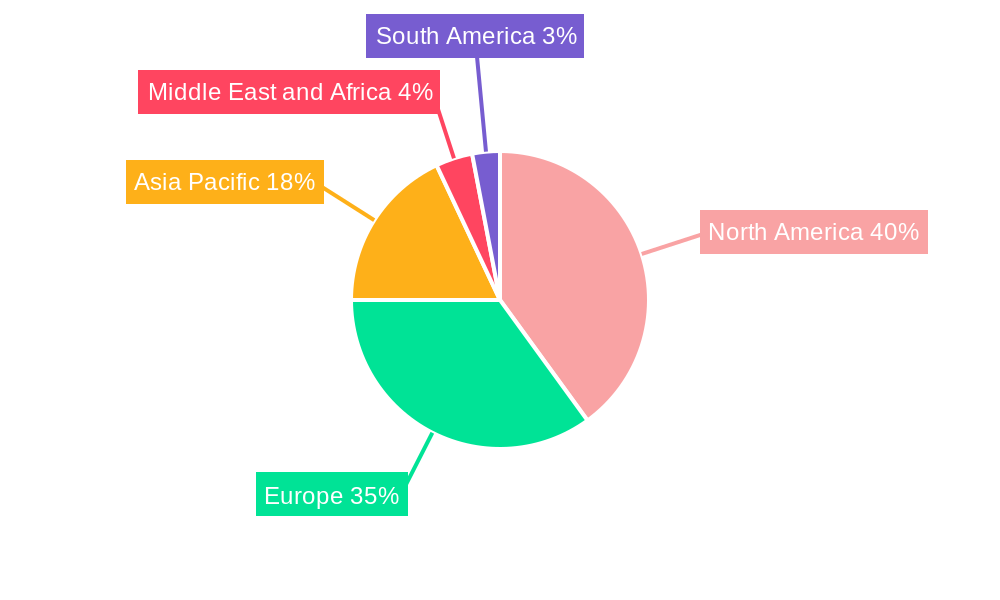
The Hydrophobic Interaction Chromatography (HIC) market is experiencing robust growth, driven by the increasing demand for biopharmaceuticals and advancements in therapeutic protein purification. The market's Compound Annual Growth Rate (CAGR) of 7.60% from 2019 to 2024 suggests a consistently expanding market. This growth is fueled by several key factors. The rising prevalence of chronic diseases globally necessitates increased production of biopharmaceuticals like monoclonal antibodies and vaccines, which heavily rely on HIC for purification. Furthermore, the increasing adoption of advanced HIC techniques and the development of novel resins are improving the efficiency and effectiveness of protein purification, driving market expansion. The market is segmented by product type (columns, resins, buffers), sample type (monoclonal antibodies, vaccines, others), and end-user (contract research organizations, pharma and biopharmaceutical companies). Monoclonal antibodies are a significant driver, given their increasing importance in various therapeutic areas. The North American and European regions currently hold substantial market share due to established biopharmaceutical industries and robust research infrastructure. However, the Asia-Pacific region is anticipated to exhibit rapid growth in the coming years, fueled by rising healthcare expenditure and increasing investments in biotechnology. While regulatory hurdles and the high cost associated with advanced HIC technologies present some challenges, the overall outlook for the HIC market remains positive, with significant growth potential over the forecast period (2025-2033).
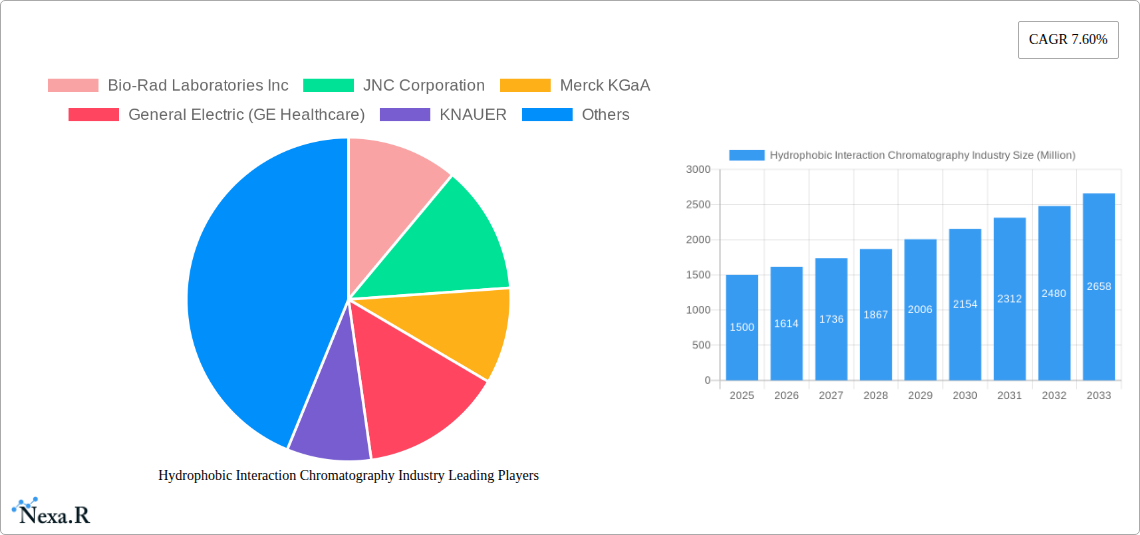
The competitive landscape is populated by both established players like Bio-Rad Laboratories, Merck KGaA, and Thermo Fisher Scientific, and smaller, specialized companies. These companies are constantly innovating to offer improved HIC solutions, including enhanced resins with higher selectivity and capacity, and automated systems to improve throughput and reduce operational costs. The strategic alliances, partnerships, and mergers and acquisitions within the industry are expected to further shape the market dynamics in the coming years. The continuous development of novel therapeutic proteins and the growing adoption of personalized medicine will create further demand for efficient and high-quality protein purification methods like HIC, thereby supporting market expansion throughout the forecast period. Market segmentation by region allows for focused strategies, capitalizing on regional differences in regulatory frameworks, infrastructure development, and healthcare spending.
Hydrophobic Interaction Chromatography (HIC) Industry Market Report: 2019-2033
This comprehensive report provides an in-depth analysis of the Hydrophobic Interaction Chromatography (HIC) industry, encompassing market dynamics, growth trends, regional dominance, product landscape, key players, and future outlook. The report covers the period from 2019 to 2033, with 2025 as the base year and a forecast period from 2025 to 2033. The HIC market, a crucial segment within the broader Biotechnology and Pharmaceutical industries, is experiencing significant growth driven by advancements in biopharmaceutical manufacturing and increasing demand for high-purity biomolecules. This report serves as an invaluable resource for industry professionals, investors, and researchers seeking a detailed understanding of this dynamic market. The total market size in 2025 is estimated at XX Million.
Hydrophobic Interaction Chromatography Industry Market Dynamics & Structure
The HIC market is characterized by a moderately consolidated structure with several key players holding significant market share. Technological innovation, particularly in resin development and column design, is a major driver of growth. Stringent regulatory frameworks governing biopharmaceutical production influence market dynamics, while the emergence of alternative purification techniques presents competitive pressure. The end-user demographic is primarily focused on pharmaceutical and biopharmaceutical companies and contract research organizations (CROs). Mergers and acquisitions (M&A) activity has been moderate, with larger players strategically acquiring smaller companies to expand their product portfolios and technological capabilities.
- Market Concentration: Moderately consolidated, with top 5 players holding approximately xx% market share in 2025.
- Technological Innovation: Focus on high-throughput, scalable, and cost-effective HIC techniques.
- Regulatory Landscape: Stringent regulatory compliance requirements (e.g., GMP) significantly impact market operations.
- Competitive Substitutes: Alternative chromatography techniques (e.g., ion exchange, affinity chromatography) pose competitive challenges.
- M&A Activity: Moderate activity, with xx major deals observed during the historical period (2019-2024).
- Innovation Barriers: High R&D costs, regulatory approvals, and intellectual property protection pose challenges to innovation.
Hydrophobic Interaction Chromatography Industry Growth Trends & Insights
The HIC market exhibits robust growth driven by the increasing demand for biologics and the rising prevalence of chronic diseases. The market size is projected to expand significantly, with a Compound Annual Growth Rate (CAGR) of xx% during the forecast period (2025-2033). This growth is fueled by technological advancements leading to improved efficiency and cost-effectiveness of HIC processes. The adoption rate of HIC technologies is increasing across various segments, particularly in monoclonal antibody and vaccine production. Consumer behavior shifts towards personalized medicine and advanced therapies are further stimulating market expansion. Market penetration is highest in North America and Europe, with emerging economies showing significant growth potential.
Dominant Regions, Countries, or Segments in Hydrophobic Interaction Chromatography Industry
North America holds the largest market share in the HIC industry, driven by the presence of major pharmaceutical companies and advanced research infrastructure. Europe follows closely, exhibiting strong growth due to robust research and development activities and increasing adoption of advanced purification technologies. Within product segments, columns hold the largest share, followed by resins and buffers. Monoclonal antibodies constitute the leading sample type, accounting for a significant portion of the market. Pharma and biopharmaceutical companies represent the dominant end-user segment, followed by CROs.
- Key Drivers in North America: Strong regulatory support, substantial investments in R&D, and the presence of major pharmaceutical companies.
- Key Drivers in Europe: High concentration of biopharmaceutical companies and research institutions, supportive government policies.
- Segment Dominance: Columns (xx Million in 2025), Monoclonal Antibodies (xx Million in 2025), Pharma and Biopharmaceutical Companies (xx Million in 2025).
Hydrophobic Interaction Chromatography Industry Product Landscape
The HIC product landscape is characterized by continuous innovation in column and resin materials, leading to enhanced selectivity, capacity, and operational efficiency. New products incorporate advanced materials with improved hydrophobicity and binding characteristics, resulting in superior purification performance. These advancements enable the processing of a wider range of biomolecules and contribute to improved yield and purity. Unique selling propositions focus on improved scalability, reduced processing time, and enhanced cost-effectiveness.
Key Drivers, Barriers & Challenges in Hydrophobic Interaction Chromatography Industry
Key Drivers:
- Increasing demand for biologics and biosimilars.
- Technological advancements leading to improved HIC techniques.
- Growing adoption of HIC in the production of monoclonal antibodies and vaccines.
Key Challenges & Restraints:
- High upfront investment in equipment and infrastructure.
- Stringent regulatory requirements and compliance costs.
- Competition from alternative purification technologies (e.g., affinity chromatography). This has resulted in a xx% reduction in market growth for some segments in 2024 compared to the previous year.
- Supply chain disruptions impacting the availability of raw materials.
Emerging Opportunities in Hydrophobic Interaction Chromatography Industry
Emerging opportunities include the development of novel HIC resins tailored for specific biomolecules, expansion into emerging markets, and application in emerging therapeutic areas such as cell and gene therapy. Growing demand for high-purity proteins in personalized medicine is creating significant growth potential. The development of integrated HIC platforms for automated and high-throughput purification presents attractive opportunities.
Growth Accelerators in the Hydrophobic Interaction Chromatography Industry Industry
Technological breakthroughs, such as the development of new resin materials with enhanced selectivity and capacity, are key growth accelerators. Strategic partnerships between HIC manufacturers and pharmaceutical companies are driving market expansion. Market expansion into emerging economies with growing biopharmaceutical industries further accelerates growth.
Key Players Shaping the Hydrophobic Interaction Chromatography Industry Market
- Bio-Rad Laboratories Inc
- JNC Corporation
- Merck KGaA
- General Electric (GE Healthcare)
- KNAUER
- Sepax Technologies Inc
- Geno Technology Inc USA
- Sartorius AG
- Tosoh Bioscience GmbH
- Thermo Fisher Scientific
Notable Milestones in Hydrophobic Interaction Chromatography Industry Sector
- August 2022: Sunresin presented new SEPLIFE products and solutions for chromatography resins at the 2nd China International Vaccine Innovation Summit.
- October 2022: VDO Biotech showcased affinity chromatography media for viral and plasmid purification at the Annual European Society of Gene & Cell Therapy.
In-Depth Hydrophobic Interaction Chromatography Industry Market Outlook
The HIC market is poised for sustained growth driven by technological innovation and increasing demand for biopharmaceuticals. Strategic partnerships and expansion into emerging markets represent significant opportunities for market players. The focus on developing highly efficient, cost-effective, and scalable HIC processes will further drive market expansion throughout the forecast period.
Hydrophobic Interaction Chromatography Industry Segmentation
-
1. Products
- 1.1. Columns
- 1.2. Resins
- 1.3. Buffers
-
2. Sample Type
- 2.1. Monoclonal Antibodies
- 2.2. Vaccines
- 2.3. Others
-
3. End-User
- 3.1. Contract Research Organizations
- 3.2. Pharma and Biopharmaceutical Companies
- 3.3. Others
Hydrophobic Interaction Chromatography Industry Segmentation By Geography
-
1. North America
- 1.1. United States
- 1.2. Canada
- 1.3. Mexico
-
2. Europe
- 2.1. Germany
- 2.2. United Kingdom
- 2.3. France
- 2.4. Italy
- 2.5. Spain
- 2.6. Rest of Europe
-
3. Asia Pacific
- 3.1. China
- 3.2. Japan
- 3.3. India
- 3.4. Australia
- 3.5. South Korea
- 3.6. Rest of Asia Pacific
-
4. Middle East and Africa
- 4.1. GCC
- 4.2. South Africa
- 4.3. Rest of Middle East and Africa
-
5. South America
- 5.1. Brazil
- 5.2. Argentina
- 5.3. Rest of South America
Hydrophobic Interaction Chromatography Industry REPORT HIGHLIGHTS
| Aspects | Details |
|---|---|
| Study Period | 2019-2033 |
| Base Year | 2024 |
| Estimated Year | 2025 |
| Forecast Period | 2025-2033 |
| Historical Period | 2019-2024 |
| Growth Rate | CAGR of 7.60% from 2019-2033 |
| Segmentation |
|
Table of Contents
- 1. Introduction
- 1.1. Research Scope
- 1.2. Market Segmentation
- 1.3. Research Methodology
- 1.4. Definitions and Assumptions
- 2. Executive Summary
- 2.1. Introduction
- 3. Market Dynamics
- 3.1. Introduction
- 3.2. Market Drivers
- 3.2.1. Growing Demand for Monoclonal Antibodies; Increasing Research and Development Investment in Oncology and Analytic Techniques
- 3.3. Market Restrains
- 3.3.1. Lack of Skilled Professionals; Availability of Other Chromatography Techniques
- 3.4. Market Trends
- 3.4.1. Monoclonal Antibodies Segment is Expected to Witness Growth Over The Forecast Period
- 4. Market Factor Analysis
- 4.1. Porters Five Forces
- 4.2. Supply/Value Chain
- 4.3. PESTEL analysis
- 4.4. Market Entropy
- 4.5. Patent/Trademark Analysis
- 5. Global Hydrophobic Interaction Chromatography Industry Analysis, Insights and Forecast, 2019-2031
- 5.1. Market Analysis, Insights and Forecast - by Products
- 5.1.1. Columns
- 5.1.2. Resins
- 5.1.3. Buffers
- 5.2. Market Analysis, Insights and Forecast - by Sample Type
- 5.2.1. Monoclonal Antibodies
- 5.2.2. Vaccines
- 5.2.3. Others
- 5.3. Market Analysis, Insights and Forecast - by End-User
- 5.3.1. Contract Research Organizations
- 5.3.2. Pharma and Biopharmaceutical Companies
- 5.3.3. Others
- 5.4. Market Analysis, Insights and Forecast - by Region
- 5.4.1. North America
- 5.4.2. Europe
- 5.4.3. Asia Pacific
- 5.4.4. Middle East and Africa
- 5.4.5. South America
- 5.1. Market Analysis, Insights and Forecast - by Products
- 6. North America Hydrophobic Interaction Chromatography Industry Analysis, Insights and Forecast, 2019-2031
- 6.1. Market Analysis, Insights and Forecast - by Products
- 6.1.1. Columns
- 6.1.2. Resins
- 6.1.3. Buffers
- 6.2. Market Analysis, Insights and Forecast - by Sample Type
- 6.2.1. Monoclonal Antibodies
- 6.2.2. Vaccines
- 6.2.3. Others
- 6.3. Market Analysis, Insights and Forecast - by End-User
- 6.3.1. Contract Research Organizations
- 6.3.2. Pharma and Biopharmaceutical Companies
- 6.3.3. Others
- 6.1. Market Analysis, Insights and Forecast - by Products
- 7. Europe Hydrophobic Interaction Chromatography Industry Analysis, Insights and Forecast, 2019-2031
- 7.1. Market Analysis, Insights and Forecast - by Products
- 7.1.1. Columns
- 7.1.2. Resins
- 7.1.3. Buffers
- 7.2. Market Analysis, Insights and Forecast - by Sample Type
- 7.2.1. Monoclonal Antibodies
- 7.2.2. Vaccines
- 7.2.3. Others
- 7.3. Market Analysis, Insights and Forecast - by End-User
- 7.3.1. Contract Research Organizations
- 7.3.2. Pharma and Biopharmaceutical Companies
- 7.3.3. Others
- 7.1. Market Analysis, Insights and Forecast - by Products
- 8. Asia Pacific Hydrophobic Interaction Chromatography Industry Analysis, Insights and Forecast, 2019-2031
- 8.1. Market Analysis, Insights and Forecast - by Products
- 8.1.1. Columns
- 8.1.2. Resins
- 8.1.3. Buffers
- 8.2. Market Analysis, Insights and Forecast - by Sample Type
- 8.2.1. Monoclonal Antibodies
- 8.2.2. Vaccines
- 8.2.3. Others
- 8.3. Market Analysis, Insights and Forecast - by End-User
- 8.3.1. Contract Research Organizations
- 8.3.2. Pharma and Biopharmaceutical Companies
- 8.3.3. Others
- 8.1. Market Analysis, Insights and Forecast - by Products
- 9. Middle East and Africa Hydrophobic Interaction Chromatography Industry Analysis, Insights and Forecast, 2019-2031
- 9.1. Market Analysis, Insights and Forecast - by Products
- 9.1.1. Columns
- 9.1.2. Resins
- 9.1.3. Buffers
- 9.2. Market Analysis, Insights and Forecast - by Sample Type
- 9.2.1. Monoclonal Antibodies
- 9.2.2. Vaccines
- 9.2.3. Others
- 9.3. Market Analysis, Insights and Forecast - by End-User
- 9.3.1. Contract Research Organizations
- 9.3.2. Pharma and Biopharmaceutical Companies
- 9.3.3. Others
- 9.1. Market Analysis, Insights and Forecast - by Products
- 10. South America Hydrophobic Interaction Chromatography Industry Analysis, Insights and Forecast, 2019-2031
- 10.1. Market Analysis, Insights and Forecast - by Products
- 10.1.1. Columns
- 10.1.2. Resins
- 10.1.3. Buffers
- 10.2. Market Analysis, Insights and Forecast - by Sample Type
- 10.2.1. Monoclonal Antibodies
- 10.2.2. Vaccines
- 10.2.3. Others
- 10.3. Market Analysis, Insights and Forecast - by End-User
- 10.3.1. Contract Research Organizations
- 10.3.2. Pharma and Biopharmaceutical Companies
- 10.3.3. Others
- 10.1. Market Analysis, Insights and Forecast - by Products
- 11. North America Hydrophobic Interaction Chromatography Industry Analysis, Insights and Forecast, 2019-2031
- 11.1. Market Analysis, Insights and Forecast - By Country/Sub-region
- 11.1.1 United States
- 11.1.2 Canada
- 11.1.3 Mexico
- 12. Europe Hydrophobic Interaction Chromatography Industry Analysis, Insights and Forecast, 2019-2031
- 12.1. Market Analysis, Insights and Forecast - By Country/Sub-region
- 12.1.1 Germany
- 12.1.2 United Kingdom
- 12.1.3 France
- 12.1.4 Italy
- 12.1.5 Spain
- 12.1.6 Rest of Europe
- 13. Asia Pacific Hydrophobic Interaction Chromatography Industry Analysis, Insights and Forecast, 2019-2031
- 13.1. Market Analysis, Insights and Forecast - By Country/Sub-region
- 13.1.1 China
- 13.1.2 Japan
- 13.1.3 India
- 13.1.4 Australia
- 13.1.5 South Korea
- 13.1.6 Rest of Asia Pacific
- 14. Middle East and Africa Hydrophobic Interaction Chromatography Industry Analysis, Insights and Forecast, 2019-2031
- 14.1. Market Analysis, Insights and Forecast - By Country/Sub-region
- 14.1.1 GCC
- 14.1.2 South Africa
- 14.1.3 Rest of Middle East and Africa
- 15. South America Hydrophobic Interaction Chromatography Industry Analysis, Insights and Forecast, 2019-2031
- 15.1. Market Analysis, Insights and Forecast - By Country/Sub-region
- 15.1.1 Brazil
- 15.1.2 Argentina
- 15.1.3 Rest of South America
- 16. Competitive Analysis
- 16.1. Global Market Share Analysis 2024
- 16.2. Company Profiles
- 16.2.1 Bio-Rad Laboratories Inc
- 16.2.1.1. Overview
- 16.2.1.2. Products
- 16.2.1.3. SWOT Analysis
- 16.2.1.4. Recent Developments
- 16.2.1.5. Financials (Based on Availability)
- 16.2.2 JNC Corporation
- 16.2.2.1. Overview
- 16.2.2.2. Products
- 16.2.2.3. SWOT Analysis
- 16.2.2.4. Recent Developments
- 16.2.2.5. Financials (Based on Availability)
- 16.2.3 Merck KGaA
- 16.2.3.1. Overview
- 16.2.3.2. Products
- 16.2.3.3. SWOT Analysis
- 16.2.3.4. Recent Developments
- 16.2.3.5. Financials (Based on Availability)
- 16.2.4 General Electric (GE Healthcare)
- 16.2.4.1. Overview
- 16.2.4.2. Products
- 16.2.4.3. SWOT Analysis
- 16.2.4.4. Recent Developments
- 16.2.4.5. Financials (Based on Availability)
- 16.2.5 KNAUER
- 16.2.5.1. Overview
- 16.2.5.2. Products
- 16.2.5.3. SWOT Analysis
- 16.2.5.4. Recent Developments
- 16.2.5.5. Financials (Based on Availability)
- 16.2.6 Sepax Technologies Inc
- 16.2.6.1. Overview
- 16.2.6.2. Products
- 16.2.6.3. SWOT Analysis
- 16.2.6.4. Recent Developments
- 16.2.6.5. Financials (Based on Availability)
- 16.2.7 Geno Technology Inc USA *List Not Exhaustive
- 16.2.7.1. Overview
- 16.2.7.2. Products
- 16.2.7.3. SWOT Analysis
- 16.2.7.4. Recent Developments
- 16.2.7.5. Financials (Based on Availability)
- 16.2.8 Sartorius AG
- 16.2.8.1. Overview
- 16.2.8.2. Products
- 16.2.8.3. SWOT Analysis
- 16.2.8.4. Recent Developments
- 16.2.8.5. Financials (Based on Availability)
- 16.2.9 Tosoh Bioscience GmbH
- 16.2.9.1. Overview
- 16.2.9.2. Products
- 16.2.9.3. SWOT Analysis
- 16.2.9.4. Recent Developments
- 16.2.9.5. Financials (Based on Availability)
- 16.2.10 Thermo Fisher Scientific
- 16.2.10.1. Overview
- 16.2.10.2. Products
- 16.2.10.3. SWOT Analysis
- 16.2.10.4. Recent Developments
- 16.2.10.5. Financials (Based on Availability)
- 16.2.1 Bio-Rad Laboratories Inc
List of Figures
- Figure 1: Global Hydrophobic Interaction Chromatography Industry Revenue Breakdown (Million, %) by Region 2024 & 2032
- Figure 2: North America Hydrophobic Interaction Chromatography Industry Revenue (Million), by Country 2024 & 2032
- Figure 3: North America Hydrophobic Interaction Chromatography Industry Revenue Share (%), by Country 2024 & 2032
- Figure 4: Europe Hydrophobic Interaction Chromatography Industry Revenue (Million), by Country 2024 & 2032
- Figure 5: Europe Hydrophobic Interaction Chromatography Industry Revenue Share (%), by Country 2024 & 2032
- Figure 6: Asia Pacific Hydrophobic Interaction Chromatography Industry Revenue (Million), by Country 2024 & 2032
- Figure 7: Asia Pacific Hydrophobic Interaction Chromatography Industry Revenue Share (%), by Country 2024 & 2032
- Figure 8: Middle East and Africa Hydrophobic Interaction Chromatography Industry Revenue (Million), by Country 2024 & 2032
- Figure 9: Middle East and Africa Hydrophobic Interaction Chromatography Industry Revenue Share (%), by Country 2024 & 2032
- Figure 10: South America Hydrophobic Interaction Chromatography Industry Revenue (Million), by Country 2024 & 2032
- Figure 11: South America Hydrophobic Interaction Chromatography Industry Revenue Share (%), by Country 2024 & 2032
- Figure 12: North America Hydrophobic Interaction Chromatography Industry Revenue (Million), by Products 2024 & 2032
- Figure 13: North America Hydrophobic Interaction Chromatography Industry Revenue Share (%), by Products 2024 & 2032
- Figure 14: North America Hydrophobic Interaction Chromatography Industry Revenue (Million), by Sample Type 2024 & 2032
- Figure 15: North America Hydrophobic Interaction Chromatography Industry Revenue Share (%), by Sample Type 2024 & 2032
- Figure 16: North America Hydrophobic Interaction Chromatography Industry Revenue (Million), by End-User 2024 & 2032
- Figure 17: North America Hydrophobic Interaction Chromatography Industry Revenue Share (%), by End-User 2024 & 2032
- Figure 18: North America Hydrophobic Interaction Chromatography Industry Revenue (Million), by Country 2024 & 2032
- Figure 19: North America Hydrophobic Interaction Chromatography Industry Revenue Share (%), by Country 2024 & 2032
- Figure 20: Europe Hydrophobic Interaction Chromatography Industry Revenue (Million), by Products 2024 & 2032
- Figure 21: Europe Hydrophobic Interaction Chromatography Industry Revenue Share (%), by Products 2024 & 2032
- Figure 22: Europe Hydrophobic Interaction Chromatography Industry Revenue (Million), by Sample Type 2024 & 2032
- Figure 23: Europe Hydrophobic Interaction Chromatography Industry Revenue Share (%), by Sample Type 2024 & 2032
- Figure 24: Europe Hydrophobic Interaction Chromatography Industry Revenue (Million), by End-User 2024 & 2032
- Figure 25: Europe Hydrophobic Interaction Chromatography Industry Revenue Share (%), by End-User 2024 & 2032
- Figure 26: Europe Hydrophobic Interaction Chromatography Industry Revenue (Million), by Country 2024 & 2032
- Figure 27: Europe Hydrophobic Interaction Chromatography Industry Revenue Share (%), by Country 2024 & 2032
- Figure 28: Asia Pacific Hydrophobic Interaction Chromatography Industry Revenue (Million), by Products 2024 & 2032
- Figure 29: Asia Pacific Hydrophobic Interaction Chromatography Industry Revenue Share (%), by Products 2024 & 2032
- Figure 30: Asia Pacific Hydrophobic Interaction Chromatography Industry Revenue (Million), by Sample Type 2024 & 2032
- Figure 31: Asia Pacific Hydrophobic Interaction Chromatography Industry Revenue Share (%), by Sample Type 2024 & 2032
- Figure 32: Asia Pacific Hydrophobic Interaction Chromatography Industry Revenue (Million), by End-User 2024 & 2032
- Figure 33: Asia Pacific Hydrophobic Interaction Chromatography Industry Revenue Share (%), by End-User 2024 & 2032
- Figure 34: Asia Pacific Hydrophobic Interaction Chromatography Industry Revenue (Million), by Country 2024 & 2032
- Figure 35: Asia Pacific Hydrophobic Interaction Chromatography Industry Revenue Share (%), by Country 2024 & 2032
- Figure 36: Middle East and Africa Hydrophobic Interaction Chromatography Industry Revenue (Million), by Products 2024 & 2032
- Figure 37: Middle East and Africa Hydrophobic Interaction Chromatography Industry Revenue Share (%), by Products 2024 & 2032
- Figure 38: Middle East and Africa Hydrophobic Interaction Chromatography Industry Revenue (Million), by Sample Type 2024 & 2032
- Figure 39: Middle East and Africa Hydrophobic Interaction Chromatography Industry Revenue Share (%), by Sample Type 2024 & 2032
- Figure 40: Middle East and Africa Hydrophobic Interaction Chromatography Industry Revenue (Million), by End-User 2024 & 2032
- Figure 41: Middle East and Africa Hydrophobic Interaction Chromatography Industry Revenue Share (%), by End-User 2024 & 2032
- Figure 42: Middle East and Africa Hydrophobic Interaction Chromatography Industry Revenue (Million), by Country 2024 & 2032
- Figure 43: Middle East and Africa Hydrophobic Interaction Chromatography Industry Revenue Share (%), by Country 2024 & 2032
- Figure 44: South America Hydrophobic Interaction Chromatography Industry Revenue (Million), by Products 2024 & 2032
- Figure 45: South America Hydrophobic Interaction Chromatography Industry Revenue Share (%), by Products 2024 & 2032
- Figure 46: South America Hydrophobic Interaction Chromatography Industry Revenue (Million), by Sample Type 2024 & 2032
- Figure 47: South America Hydrophobic Interaction Chromatography Industry Revenue Share (%), by Sample Type 2024 & 2032
- Figure 48: South America Hydrophobic Interaction Chromatography Industry Revenue (Million), by End-User 2024 & 2032
- Figure 49: South America Hydrophobic Interaction Chromatography Industry Revenue Share (%), by End-User 2024 & 2032
- Figure 50: South America Hydrophobic Interaction Chromatography Industry Revenue (Million), by Country 2024 & 2032
- Figure 51: South America Hydrophobic Interaction Chromatography Industry Revenue Share (%), by Country 2024 & 2032
List of Tables
- Table 1: Global Hydrophobic Interaction Chromatography Industry Revenue Million Forecast, by Region 2019 & 2032
- Table 2: Global Hydrophobic Interaction Chromatography Industry Revenue Million Forecast, by Products 2019 & 2032
- Table 3: Global Hydrophobic Interaction Chromatography Industry Revenue Million Forecast, by Sample Type 2019 & 2032
- Table 4: Global Hydrophobic Interaction Chromatography Industry Revenue Million Forecast, by End-User 2019 & 2032
- Table 5: Global Hydrophobic Interaction Chromatography Industry Revenue Million Forecast, by Region 2019 & 2032
- Table 6: Global Hydrophobic Interaction Chromatography Industry Revenue Million Forecast, by Country 2019 & 2032
- Table 7: United States Hydrophobic Interaction Chromatography Industry Revenue (Million) Forecast, by Application 2019 & 2032
- Table 8: Canada Hydrophobic Interaction Chromatography Industry Revenue (Million) Forecast, by Application 2019 & 2032
- Table 9: Mexico Hydrophobic Interaction Chromatography Industry Revenue (Million) Forecast, by Application 2019 & 2032
- Table 10: Global Hydrophobic Interaction Chromatography Industry Revenue Million Forecast, by Country 2019 & 2032
- Table 11: Germany Hydrophobic Interaction Chromatography Industry Revenue (Million) Forecast, by Application 2019 & 2032
- Table 12: United Kingdom Hydrophobic Interaction Chromatography Industry Revenue (Million) Forecast, by Application 2019 & 2032
- Table 13: France Hydrophobic Interaction Chromatography Industry Revenue (Million) Forecast, by Application 2019 & 2032
- Table 14: Italy Hydrophobic Interaction Chromatography Industry Revenue (Million) Forecast, by Application 2019 & 2032
- Table 15: Spain Hydrophobic Interaction Chromatography Industry Revenue (Million) Forecast, by Application 2019 & 2032
- Table 16: Rest of Europe Hydrophobic Interaction Chromatography Industry Revenue (Million) Forecast, by Application 2019 & 2032
- Table 17: Global Hydrophobic Interaction Chromatography Industry Revenue Million Forecast, by Country 2019 & 2032
- Table 18: China Hydrophobic Interaction Chromatography Industry Revenue (Million) Forecast, by Application 2019 & 2032
- Table 19: Japan Hydrophobic Interaction Chromatography Industry Revenue (Million) Forecast, by Application 2019 & 2032
- Table 20: India Hydrophobic Interaction Chromatography Industry Revenue (Million) Forecast, by Application 2019 & 2032
- Table 21: Australia Hydrophobic Interaction Chromatography Industry Revenue (Million) Forecast, by Application 2019 & 2032
- Table 22: South Korea Hydrophobic Interaction Chromatography Industry Revenue (Million) Forecast, by Application 2019 & 2032
- Table 23: Rest of Asia Pacific Hydrophobic Interaction Chromatography Industry Revenue (Million) Forecast, by Application 2019 & 2032
- Table 24: Global Hydrophobic Interaction Chromatography Industry Revenue Million Forecast, by Country 2019 & 2032
- Table 25: GCC Hydrophobic Interaction Chromatography Industry Revenue (Million) Forecast, by Application 2019 & 2032
- Table 26: South Africa Hydrophobic Interaction Chromatography Industry Revenue (Million) Forecast, by Application 2019 & 2032
- Table 27: Rest of Middle East and Africa Hydrophobic Interaction Chromatography Industry Revenue (Million) Forecast, by Application 2019 & 2032
- Table 28: Global Hydrophobic Interaction Chromatography Industry Revenue Million Forecast, by Country 2019 & 2032
- Table 29: Brazil Hydrophobic Interaction Chromatography Industry Revenue (Million) Forecast, by Application 2019 & 2032
- Table 30: Argentina Hydrophobic Interaction Chromatography Industry Revenue (Million) Forecast, by Application 2019 & 2032
- Table 31: Rest of South America Hydrophobic Interaction Chromatography Industry Revenue (Million) Forecast, by Application 2019 & 2032
- Table 32: Global Hydrophobic Interaction Chromatography Industry Revenue Million Forecast, by Products 2019 & 2032
- Table 33: Global Hydrophobic Interaction Chromatography Industry Revenue Million Forecast, by Sample Type 2019 & 2032
- Table 34: Global Hydrophobic Interaction Chromatography Industry Revenue Million Forecast, by End-User 2019 & 2032
- Table 35: Global Hydrophobic Interaction Chromatography Industry Revenue Million Forecast, by Country 2019 & 2032
- Table 36: United States Hydrophobic Interaction Chromatography Industry Revenue (Million) Forecast, by Application 2019 & 2032
- Table 37: Canada Hydrophobic Interaction Chromatography Industry Revenue (Million) Forecast, by Application 2019 & 2032
- Table 38: Mexico Hydrophobic Interaction Chromatography Industry Revenue (Million) Forecast, by Application 2019 & 2032
- Table 39: Global Hydrophobic Interaction Chromatography Industry Revenue Million Forecast, by Products 2019 & 2032
- Table 40: Global Hydrophobic Interaction Chromatography Industry Revenue Million Forecast, by Sample Type 2019 & 2032
- Table 41: Global Hydrophobic Interaction Chromatography Industry Revenue Million Forecast, by End-User 2019 & 2032
- Table 42: Global Hydrophobic Interaction Chromatography Industry Revenue Million Forecast, by Country 2019 & 2032
- Table 43: Germany Hydrophobic Interaction Chromatography Industry Revenue (Million) Forecast, by Application 2019 & 2032
- Table 44: United Kingdom Hydrophobic Interaction Chromatography Industry Revenue (Million) Forecast, by Application 2019 & 2032
- Table 45: France Hydrophobic Interaction Chromatography Industry Revenue (Million) Forecast, by Application 2019 & 2032
- Table 46: Italy Hydrophobic Interaction Chromatography Industry Revenue (Million) Forecast, by Application 2019 & 2032
- Table 47: Spain Hydrophobic Interaction Chromatography Industry Revenue (Million) Forecast, by Application 2019 & 2032
- Table 48: Rest of Europe Hydrophobic Interaction Chromatography Industry Revenue (Million) Forecast, by Application 2019 & 2032
- Table 49: Global Hydrophobic Interaction Chromatography Industry Revenue Million Forecast, by Products 2019 & 2032
- Table 50: Global Hydrophobic Interaction Chromatography Industry Revenue Million Forecast, by Sample Type 2019 & 2032
- Table 51: Global Hydrophobic Interaction Chromatography Industry Revenue Million Forecast, by End-User 2019 & 2032
- Table 52: Global Hydrophobic Interaction Chromatography Industry Revenue Million Forecast, by Country 2019 & 2032
- Table 53: China Hydrophobic Interaction Chromatography Industry Revenue (Million) Forecast, by Application 2019 & 2032
- Table 54: Japan Hydrophobic Interaction Chromatography Industry Revenue (Million) Forecast, by Application 2019 & 2032
- Table 55: India Hydrophobic Interaction Chromatography Industry Revenue (Million) Forecast, by Application 2019 & 2032
- Table 56: Australia Hydrophobic Interaction Chromatography Industry Revenue (Million) Forecast, by Application 2019 & 2032
- Table 57: South Korea Hydrophobic Interaction Chromatography Industry Revenue (Million) Forecast, by Application 2019 & 2032
- Table 58: Rest of Asia Pacific Hydrophobic Interaction Chromatography Industry Revenue (Million) Forecast, by Application 2019 & 2032
- Table 59: Global Hydrophobic Interaction Chromatography Industry Revenue Million Forecast, by Products 2019 & 2032
- Table 60: Global Hydrophobic Interaction Chromatography Industry Revenue Million Forecast, by Sample Type 2019 & 2032
- Table 61: Global Hydrophobic Interaction Chromatography Industry Revenue Million Forecast, by End-User 2019 & 2032
- Table 62: Global Hydrophobic Interaction Chromatography Industry Revenue Million Forecast, by Country 2019 & 2032
- Table 63: GCC Hydrophobic Interaction Chromatography Industry Revenue (Million) Forecast, by Application 2019 & 2032
- Table 64: South Africa Hydrophobic Interaction Chromatography Industry Revenue (Million) Forecast, by Application 2019 & 2032
- Table 65: Rest of Middle East and Africa Hydrophobic Interaction Chromatography Industry Revenue (Million) Forecast, by Application 2019 & 2032
- Table 66: Global Hydrophobic Interaction Chromatography Industry Revenue Million Forecast, by Products 2019 & 2032
- Table 67: Global Hydrophobic Interaction Chromatography Industry Revenue Million Forecast, by Sample Type 2019 & 2032
- Table 68: Global Hydrophobic Interaction Chromatography Industry Revenue Million Forecast, by End-User 2019 & 2032
- Table 69: Global Hydrophobic Interaction Chromatography Industry Revenue Million Forecast, by Country 2019 & 2032
- Table 70: Brazil Hydrophobic Interaction Chromatography Industry Revenue (Million) Forecast, by Application 2019 & 2032
- Table 71: Argentina Hydrophobic Interaction Chromatography Industry Revenue (Million) Forecast, by Application 2019 & 2032
- Table 72: Rest of South America Hydrophobic Interaction Chromatography Industry Revenue (Million) Forecast, by Application 2019 & 2032
Frequently Asked Questions
1. What is the projected Compound Annual Growth Rate (CAGR) of the Hydrophobic Interaction Chromatography Industry?
The projected CAGR is approximately 7.60%.
2. Which companies are prominent players in the Hydrophobic Interaction Chromatography Industry?
Key companies in the market include Bio-Rad Laboratories Inc, JNC Corporation, Merck KGaA, General Electric (GE Healthcare), KNAUER, Sepax Technologies Inc, Geno Technology Inc USA *List Not Exhaustive, Sartorius AG, Tosoh Bioscience GmbH, Thermo Fisher Scientific.
3. What are the main segments of the Hydrophobic Interaction Chromatography Industry?
The market segments include Products, Sample Type, End-User.
4. Can you provide details about the market size?
The market size is estimated to be USD XX Million as of 2022.
5. What are some drivers contributing to market growth?
Growing Demand for Monoclonal Antibodies; Increasing Research and Development Investment in Oncology and Analytic Techniques.
6. What are the notable trends driving market growth?
Monoclonal Antibodies Segment is Expected to Witness Growth Over The Forecast Period.
7. Are there any restraints impacting market growth?
Lack of Skilled Professionals; Availability of Other Chromatography Techniques.
8. Can you provide examples of recent developments in the market?
In August 2022, Sunresin presented its most recent SEPLIFE products and solutions in the areas of microcarriers for cell culture and chromatography resins for downstream purification at the 2nd China International Vaccine Innovation Summit.
9. What pricing options are available for accessing the report?
Pricing options include single-user, multi-user, and enterprise licenses priced at USD 4750, USD 5250, and USD 8750 respectively.
10. Is the market size provided in terms of value or volume?
The market size is provided in terms of value, measured in Million.
11. Are there any specific market keywords associated with the report?
Yes, the market keyword associated with the report is "Hydrophobic Interaction Chromatography Industry," which aids in identifying and referencing the specific market segment covered.
12. How do I determine which pricing option suits my needs best?
The pricing options vary based on user requirements and access needs. Individual users may opt for single-user licenses, while businesses requiring broader access may choose multi-user or enterprise licenses for cost-effective access to the report.
13. Are there any additional resources or data provided in the Hydrophobic Interaction Chromatography Industry report?
While the report offers comprehensive insights, it's advisable to review the specific contents or supplementary materials provided to ascertain if additional resources or data are available.
14. How can I stay updated on further developments or reports in the Hydrophobic Interaction Chromatography Industry?
To stay informed about further developments, trends, and reports in the Hydrophobic Interaction Chromatography Industry, consider subscribing to industry newsletters, following relevant companies and organizations, or regularly checking reputable industry news sources and publications.
Methodology
Step 1 - Identification of Relevant Samples Size from Population Database


Step 2 - Approaches for Defining Global Market Size (Value, Volume* & Price*)

Note*: In applicable scenarios
Step 3 - Data Sources
Primary Research
- Web Analytics
- Survey Reports
- Research Institute
- Latest Research Reports
- Opinion Leaders
Secondary Research
- Annual Reports
- White Paper
- Latest Press Release
- Industry Association
- Paid Database
- Investor Presentations

Step 4 - Data Triangulation
Involves using different sources of information in order to increase the validity of a study
These sources are likely to be stakeholders in a program - participants, other researchers, program staff, other community members, and so on.
Then we put all data in single framework & apply various statistical tools to find out the dynamic on the market.
During the analysis stage, feedback from the stakeholder groups would be compared to determine areas of agreement as well as areas of divergence
