

Key Insights
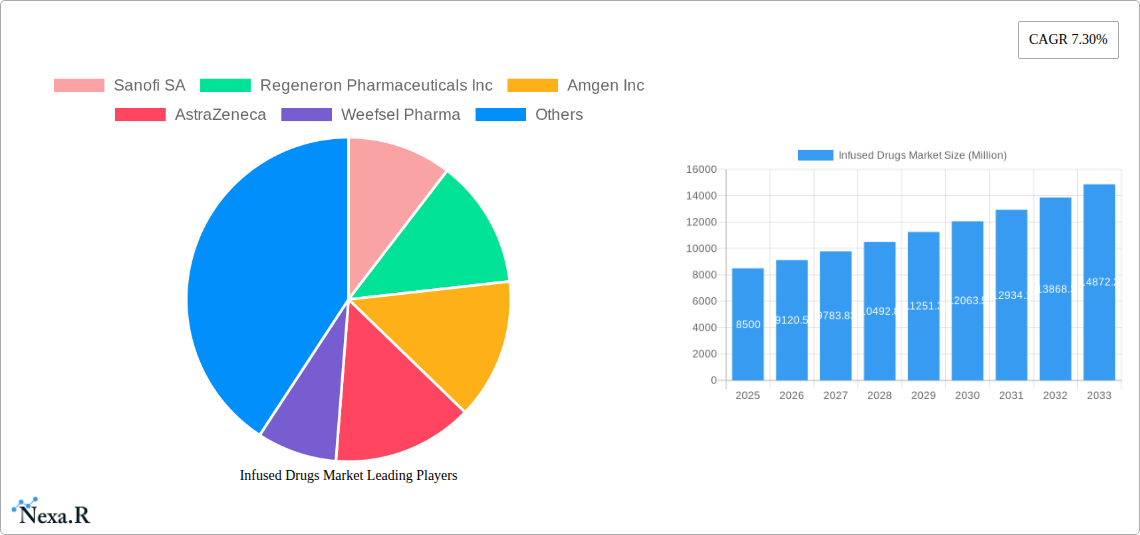
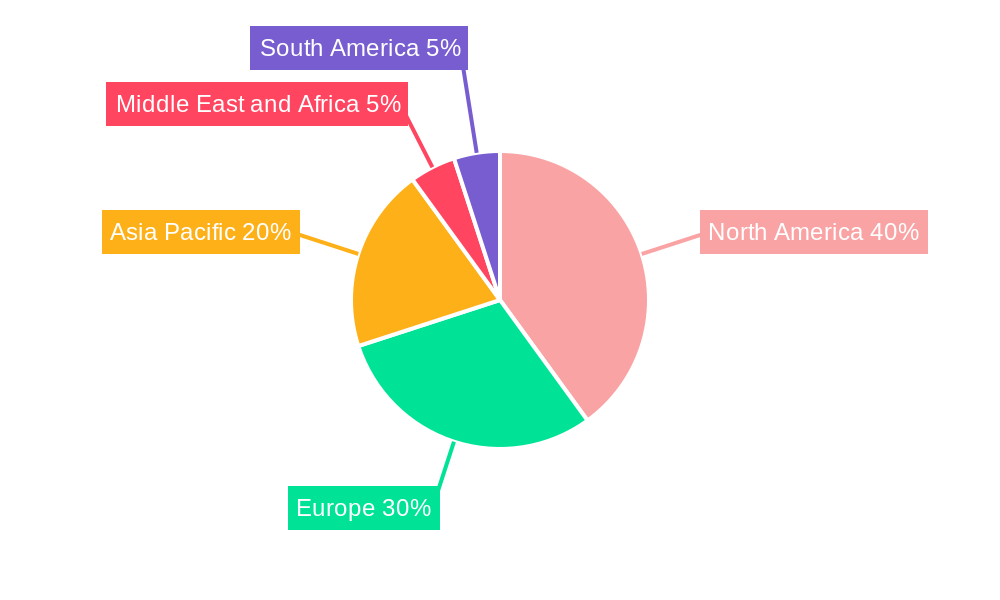
The infused drugs market, valued at $8.5 billion in 2025, is projected to experience robust growth, driven by a compound annual growth rate (CAGR) of 7.30% from 2025 to 2033. This expansion is fueled by several key factors. The increasing prevalence of chronic diseases such as cancer, autoimmune disorders, and cardiovascular diseases necessitates the use of infused drugs for effective treatment. Advancements in drug delivery technologies, leading to improved efficacy and reduced side effects, are further propelling market growth. The development of targeted therapies and personalized medicine approaches is also contributing significantly. The market is segmented by drug type (small molecules and biologics) and therapeutic area (oncology, gastrointestinal diseases, rheumatoid arthritis, immune deficiencies, cardiology, neurology, diabetes, and others). Biologics are expected to dominate the market due to their superior efficacy in treating complex diseases. Oncology is a leading therapeutic area, driven by the rising incidence of various cancers and the development of innovative cancer therapies. Geographic growth is expected to be diverse, with North America and Europe maintaining significant market shares due to established healthcare infrastructure and high adoption rates. However, the Asia-Pacific region is projected to witness the fastest growth owing to rising healthcare expenditure and increasing awareness of advanced therapies.
Competitive landscape analysis reveals a mix of large pharmaceutical companies like Sanofi, Regeneron, Amgen, AstraZeneca, and Pfizer, alongside smaller specialized players like Weefsel Pharma and Parenteral Drugs (India) Limited. These companies are engaged in intense research and development activities focused on innovative drug delivery systems and novel therapeutic targets. Market restraints include high drug costs, stringent regulatory approvals, and potential side effects associated with infused drugs. However, continuous innovation in drug development, increasing government funding for research, and growing healthcare insurance coverage are expected to mitigate these challenges and further drive market expansion in the forecast period. The market is likely to witness strategic partnerships, mergers, and acquisitions as companies seek to expand their product portfolios and market presence.
Infused Drugs Market: A Comprehensive Report (2019-2033)
This in-depth report provides a comprehensive analysis of the Infused Drugs Market, encompassing market dynamics, growth trends, regional segmentation, product landscape, key players, and future outlook. The study period covers 2019-2033, with 2025 as the base and estimated year. The report offers valuable insights for industry professionals, investors, and stakeholders seeking to understand and capitalize on opportunities within this dynamic market. The report considers both parent markets (Pharmaceuticals) and child markets (e.g., Oncology Infused Drugs). Market values are presented in million units.
Infused Drugs Market Dynamics & Structure
The Infused Drugs Market is characterized by a moderately concentrated landscape, with key players like Sanofi SA, Regeneron Pharmaceuticals Inc, Amgen Inc, and Pfizer Inc holding significant market share. Technological innovations, particularly in drug delivery systems and targeted therapies, are major drivers. Stringent regulatory frameworks influence product approvals and market access, while the availability of alternative treatment methods poses competitive pressure. The market is witnessing increased M&A activity, driven by the need for portfolio expansion and access to innovative technologies.
- Market Concentration: Moderate, with top 5 players holding approximately xx% market share in 2025.
- Technological Innovation: Focus on targeted delivery, personalized medicine, and improved efficacy.
- Regulatory Framework: Stringent approval processes impact market entry and timelines.
- Competitive Substitutes: Oral medications, other injection methods present competitive challenges.
- M&A Activity: XX deals recorded in the last 5 years, with an average deal value of $XX million.
- Innovation Barriers: High R&D costs, lengthy clinical trials, and regulatory hurdles.
Infused Drugs Market Growth Trends & Insights
The Infused Drugs Market experienced significant growth between 2019 and 2024, driven by factors such as the increasing prevalence of chronic diseases, advancements in drug delivery technologies, and rising healthcare expenditure. The market is projected to continue its expansion during the forecast period (2025-2033), with a CAGR of xx%. Increased adoption of biologics, particularly in oncology and immunology, is a key growth driver. Technological disruptions, such as the development of novel drug delivery systems and personalized medicine approaches, are further fueling market growth. Shifting consumer preferences towards convenient and effective treatment options contribute to market expansion. The market penetration rate is expected to reach xx% by 2033. The report uses proprietary data and industry benchmarks (XXX) to provide this detailed analysis.

Dominant Regions, Countries, or Segments in Infused Drugs Market
North America currently dominates the Infused Drugs Market, driven by high healthcare expenditure, robust R&D infrastructure, and early adoption of innovative therapies. Within therapeutic areas, Oncology holds the largest market share, followed by Cardiology and Immunology. Biologics represent the fastest-growing drug type segment.
- Leading Region: North America (Market share: xx% in 2025)
- Fastest-Growing Segment: Biologics (CAGR: xx% during 2025-2033)
- Largest Therapeutic Area: Oncology (Market share: xx% in 2025)
- Key Drivers: High healthcare spending, favorable regulatory environment (North America), growing prevalence of chronic diseases (Global).
- Growth Potential: Significant growth potential in emerging markets due to rising healthcare awareness and increasing disposable incomes.
Infused Drugs Market Product Landscape
The Infused Drugs Market showcases a diverse product landscape, encompassing small molecules and biologics tailored for various therapeutic applications. Innovations focus on enhancing drug delivery systems, improving efficacy and minimizing side effects. Products are differentiated based on their unique mechanisms of action, target specificity, and overall clinical outcomes. The market witnesses continuous evolution with improvements in formulation and delivery methods, increasing patient convenience and therapeutic benefits.
Key Drivers, Barriers & Challenges in Infused Drugs Market
Key Drivers:
- Rising prevalence of chronic diseases.
- Advancements in drug delivery technologies.
- Increasing healthcare expenditure.
- Growing demand for effective and convenient treatment options.
Challenges & Restraints:
- High research and development costs.
- Stringent regulatory approvals.
- Potential for adverse drug reactions.
- Competition from alternative therapies.
- Supply chain disruptions impacting drug availability (estimated xx% impact on market growth in 2024).
Emerging Opportunities in Infused Drugs Market
- Growing demand for biosimilars and biobetters.
- Expansion into untapped markets in emerging economies.
- Development of personalized medicine approaches.
- Exploration of novel drug delivery technologies like targeted drug delivery systems.
- Focus on improved patient compliance and adherence.
Growth Accelerators in the Infused Drugs Market Industry
Technological breakthroughs, including advancements in targeted therapy and drug delivery systems, are significantly accelerating market growth. Strategic collaborations and partnerships between pharmaceutical companies and biotechnology firms further drive innovation. Market expansion strategies, focusing on emerging economies with increasing healthcare spending, offer significant growth opportunities.
Key Players Shaping the Infused Drugs Market Market
- Sanofi SA
- Regeneron Pharmaceuticals Inc
- Amgen Inc
- AstraZeneca
- Weefsel Pharma
- Parenteral Drugs (India) Limited
- Teva Pharmaceutical Industries Ltd
- Eisai Co Ltd
- Bristol-Myers Squibb Company
- Pfizer Inc
Notable Milestones in Infused Drugs Market Sector
- September 2023: Eisai Co. Ltd and Biogen Inc. received approval for LEQEMBI intravenous infusion in Japan for Alzheimer's Disease.
- August 2023: Roche’s Tecentriq SC, utilizing Halozyme’s Enhaze technology, received MHRA approval in the UK.
In-Depth Infused Drugs Market Market Outlook
The Infused Drugs Market is poised for continued expansion, driven by a confluence of factors including technological advancements, rising healthcare expenditure, and the growing prevalence of chronic diseases. Strategic partnerships, focused R&D efforts, and expansion into new markets will be crucial for companies seeking to capitalize on the market's significant growth potential. The market presents lucrative opportunities for innovative companies focused on personalized medicine and advanced drug delivery systems.
Infused Drugs Market Segmentation
-
1. Drug Type
- 1.1. Small Molecules
- 1.2. Biologics
-
2. Therapeutic Area
- 2.1. Oncology
- 2.2. Gastrointestinal Diseases
- 2.3. Rheumatoid Arthritis
- 2.4. Immune Deficiencies
- 2.5. Cardiology
- 2.6. Neurology
- 2.7. Diabetes
- 2.8. Other Therapeutic Areas
Infused Drugs Market Segmentation By Geography
-
1. North America
- 1.1. United States
- 1.2. Canada
- 1.3. Mexico
-
2. Europe
- 2.1. Germany
- 2.2. United Kingdom
- 2.3. France
- 2.4. Italy
- 2.5. Spain
- 2.6. Rest of Europe
-
3. Asia Pacific
- 3.1. China
- 3.2. Japan
- 3.3. India
- 3.4. Australia
- 3.5. South Korea
- 3.6. Rest of Asia Pacific
-
4. Middle East and Africa
- 4.1. GCC
- 4.2. South Africa
- 4.3. Rest of Middle East and Africa
-
5. South America
- 5.1. Brazil
- 5.2. Argentina
- 5.3. Rest of South America
Infused Drugs Market REPORT HIGHLIGHTS
| Aspects | Details |
|---|---|
| Study Period | 2019-2033 |
| Base Year | 2024 |
| Estimated Year | 2025 |
| Forecast Period | 2025-2033 |
| Historical Period | 2019-2024 |
| Growth Rate | CAGR of 7.30% from 2019-2033 |
| Segmentation |
|
Table of Contents
- 1. Introduction
- 1.1. Research Scope
- 1.2. Market Segmentation
- 1.3. Research Methodology
- 1.4. Definitions and Assumptions
- 2. Executive Summary
- 2.1. Introduction
- 3. Market Dynamics
- 3.1. Introduction
- 3.2. Market Drivers
- 3.2.1. Increase in the Prevalence of Chronic Diseases; Increasing Geriatric Population
- 3.3. Market Restrains
- 3.3.1. Side Effects Associated with the Medications
- 3.4. Market Trends
- 3.4.1. Oncology is Expected to Have Significant Market Share During the Forecast Period
- 4. Market Factor Analysis
- 4.1. Porters Five Forces
- 4.2. Supply/Value Chain
- 4.3. PESTEL analysis
- 4.4. Market Entropy
- 4.5. Patent/Trademark Analysis
- 5. Global Infused Drugs Market Analysis, Insights and Forecast, 2019-2031
- 5.1. Market Analysis, Insights and Forecast - by Drug Type
- 5.1.1. Small Molecules
- 5.1.2. Biologics
- 5.2. Market Analysis, Insights and Forecast - by Therapeutic Area
- 5.2.1. Oncology
- 5.2.2. Gastrointestinal Diseases
- 5.2.3. Rheumatoid Arthritis
- 5.2.4. Immune Deficiencies
- 5.2.5. Cardiology
- 5.2.6. Neurology
- 5.2.7. Diabetes
- 5.2.8. Other Therapeutic Areas
- 5.3. Market Analysis, Insights and Forecast - by Region
- 5.3.1. North America
- 5.3.2. Europe
- 5.3.3. Asia Pacific
- 5.3.4. Middle East and Africa
- 5.3.5. South America
- 5.1. Market Analysis, Insights and Forecast - by Drug Type
- 6. North America Infused Drugs Market Analysis, Insights and Forecast, 2019-2031
- 6.1. Market Analysis, Insights and Forecast - by Drug Type
- 6.1.1. Small Molecules
- 6.1.2. Biologics
- 6.2. Market Analysis, Insights and Forecast - by Therapeutic Area
- 6.2.1. Oncology
- 6.2.2. Gastrointestinal Diseases
- 6.2.3. Rheumatoid Arthritis
- 6.2.4. Immune Deficiencies
- 6.2.5. Cardiology
- 6.2.6. Neurology
- 6.2.7. Diabetes
- 6.2.8. Other Therapeutic Areas
- 6.1. Market Analysis, Insights and Forecast - by Drug Type
- 7. Europe Infused Drugs Market Analysis, Insights and Forecast, 2019-2031
- 7.1. Market Analysis, Insights and Forecast - by Drug Type
- 7.1.1. Small Molecules
- 7.1.2. Biologics
- 7.2. Market Analysis, Insights and Forecast - by Therapeutic Area
- 7.2.1. Oncology
- 7.2.2. Gastrointestinal Diseases
- 7.2.3. Rheumatoid Arthritis
- 7.2.4. Immune Deficiencies
- 7.2.5. Cardiology
- 7.2.6. Neurology
- 7.2.7. Diabetes
- 7.2.8. Other Therapeutic Areas
- 7.1. Market Analysis, Insights and Forecast - by Drug Type
- 8. Asia Pacific Infused Drugs Market Analysis, Insights and Forecast, 2019-2031
- 8.1. Market Analysis, Insights and Forecast - by Drug Type
- 8.1.1. Small Molecules
- 8.1.2. Biologics
- 8.2. Market Analysis, Insights and Forecast - by Therapeutic Area
- 8.2.1. Oncology
- 8.2.2. Gastrointestinal Diseases
- 8.2.3. Rheumatoid Arthritis
- 8.2.4. Immune Deficiencies
- 8.2.5. Cardiology
- 8.2.6. Neurology
- 8.2.7. Diabetes
- 8.2.8. Other Therapeutic Areas
- 8.1. Market Analysis, Insights and Forecast - by Drug Type
- 9. Middle East and Africa Infused Drugs Market Analysis, Insights and Forecast, 2019-2031
- 9.1. Market Analysis, Insights and Forecast - by Drug Type
- 9.1.1. Small Molecules
- 9.1.2. Biologics
- 9.2. Market Analysis, Insights and Forecast - by Therapeutic Area
- 9.2.1. Oncology
- 9.2.2. Gastrointestinal Diseases
- 9.2.3. Rheumatoid Arthritis
- 9.2.4. Immune Deficiencies
- 9.2.5. Cardiology
- 9.2.6. Neurology
- 9.2.7. Diabetes
- 9.2.8. Other Therapeutic Areas
- 9.1. Market Analysis, Insights and Forecast - by Drug Type
- 10. South America Infused Drugs Market Analysis, Insights and Forecast, 2019-2031
- 10.1. Market Analysis, Insights and Forecast - by Drug Type
- 10.1.1. Small Molecules
- 10.1.2. Biologics
- 10.2. Market Analysis, Insights and Forecast - by Therapeutic Area
- 10.2.1. Oncology
- 10.2.2. Gastrointestinal Diseases
- 10.2.3. Rheumatoid Arthritis
- 10.2.4. Immune Deficiencies
- 10.2.5. Cardiology
- 10.2.6. Neurology
- 10.2.7. Diabetes
- 10.2.8. Other Therapeutic Areas
- 10.1. Market Analysis, Insights and Forecast - by Drug Type
- 11. North America Infused Drugs Market Analysis, Insights and Forecast, 2019-2031
- 11.1. Market Analysis, Insights and Forecast - By Country/Sub-region
- 11.1.1. undefined
- 12. Europe Infused Drugs Market Analysis, Insights and Forecast, 2019-2031
- 12.1. Market Analysis, Insights and Forecast - By Country/Sub-region
- 12.1.1. undefined
- 13. Asia Pacific Infused Drugs Market Analysis, Insights and Forecast, 2019-2031
- 13.1. Market Analysis, Insights and Forecast - By Country/Sub-region
- 13.1.1. undefined
- 14. Middle East and Africa Infused Drugs Market Analysis, Insights and Forecast, 2019-2031
- 14.1. Market Analysis, Insights and Forecast - By Country/Sub-region
- 14.1.1. undefined
- 15. South America Infused Drugs Market Analysis, Insights and Forecast, 2019-2031
- 15.1. Market Analysis, Insights and Forecast - By Country/Sub-region
- 15.1.1. undefined
- 16. Competitive Analysis
- 16.1. Global Market Share Analysis 2024
- 16.2. Company Profiles
- 16.2.1 Sanofi SA
- 16.2.1.1. Overview
- 16.2.1.2. Products
- 16.2.1.3. SWOT Analysis
- 16.2.1.4. Recent Developments
- 16.2.1.5. Financials (Based on Availability)
- 16.2.2 Regeneron Pharmaceuticals Inc
- 16.2.2.1. Overview
- 16.2.2.2. Products
- 16.2.2.3. SWOT Analysis
- 16.2.2.4. Recent Developments
- 16.2.2.5. Financials (Based on Availability)
- 16.2.3 Amgen Inc
- 16.2.3.1. Overview
- 16.2.3.2. Products
- 16.2.3.3. SWOT Analysis
- 16.2.3.4. Recent Developments
- 16.2.3.5. Financials (Based on Availability)
- 16.2.4 AstraZeneca
- 16.2.4.1. Overview
- 16.2.4.2. Products
- 16.2.4.3. SWOT Analysis
- 16.2.4.4. Recent Developments
- 16.2.4.5. Financials (Based on Availability)
- 16.2.5 Weefsel Pharma
- 16.2.5.1. Overview
- 16.2.5.2. Products
- 16.2.5.3. SWOT Analysis
- 16.2.5.4. Recent Developments
- 16.2.5.5. Financials (Based on Availability)
- 16.2.6 Parenteral Drugs (India) Limited
- 16.2.6.1. Overview
- 16.2.6.2. Products
- 16.2.6.3. SWOT Analysis
- 16.2.6.4. Recent Developments
- 16.2.6.5. Financials (Based on Availability)
- 16.2.7 Teva Pharmaceutical Industries Ltd
- 16.2.7.1. Overview
- 16.2.7.2. Products
- 16.2.7.3. SWOT Analysis
- 16.2.7.4. Recent Developments
- 16.2.7.5. Financials (Based on Availability)
- 16.2.8 Eisai Co Ltd
- 16.2.8.1. Overview
- 16.2.8.2. Products
- 16.2.8.3. SWOT Analysis
- 16.2.8.4. Recent Developments
- 16.2.8.5. Financials (Based on Availability)
- 16.2.9 Bristol-Myers Squibb Company
- 16.2.9.1. Overview
- 16.2.9.2. Products
- 16.2.9.3. SWOT Analysis
- 16.2.9.4. Recent Developments
- 16.2.9.5. Financials (Based on Availability)
- 16.2.10 Pfizer Inc
- 16.2.10.1. Overview
- 16.2.10.2. Products
- 16.2.10.3. SWOT Analysis
- 16.2.10.4. Recent Developments
- 16.2.10.5. Financials (Based on Availability)
- 16.2.1 Sanofi SA
List of Figures
- Figure 1: Global Infused Drugs Market Revenue Breakdown (Million, %) by Region 2024 & 2032
- Figure 2: Global Infused Drugs Market Volume Breakdown (K Unit, %) by Region 2024 & 2032
- Figure 3: North America Infused Drugs Market Revenue (Million), by Country 2024 & 2032
- Figure 4: North America Infused Drugs Market Volume (K Unit), by Country 2024 & 2032
- Figure 5: North America Infused Drugs Market Revenue Share (%), by Country 2024 & 2032
- Figure 6: North America Infused Drugs Market Volume Share (%), by Country 2024 & 2032
- Figure 7: Europe Infused Drugs Market Revenue (Million), by Country 2024 & 2032
- Figure 8: Europe Infused Drugs Market Volume (K Unit), by Country 2024 & 2032
- Figure 9: Europe Infused Drugs Market Revenue Share (%), by Country 2024 & 2032
- Figure 10: Europe Infused Drugs Market Volume Share (%), by Country 2024 & 2032
- Figure 11: Asia Pacific Infused Drugs Market Revenue (Million), by Country 2024 & 2032
- Figure 12: Asia Pacific Infused Drugs Market Volume (K Unit), by Country 2024 & 2032
- Figure 13: Asia Pacific Infused Drugs Market Revenue Share (%), by Country 2024 & 2032
- Figure 14: Asia Pacific Infused Drugs Market Volume Share (%), by Country 2024 & 2032
- Figure 15: Middle East and Africa Infused Drugs Market Revenue (Million), by Country 2024 & 2032
- Figure 16: Middle East and Africa Infused Drugs Market Volume (K Unit), by Country 2024 & 2032
- Figure 17: Middle East and Africa Infused Drugs Market Revenue Share (%), by Country 2024 & 2032
- Figure 18: Middle East and Africa Infused Drugs Market Volume Share (%), by Country 2024 & 2032
- Figure 19: South America Infused Drugs Market Revenue (Million), by Country 2024 & 2032
- Figure 20: South America Infused Drugs Market Volume (K Unit), by Country 2024 & 2032
- Figure 21: South America Infused Drugs Market Revenue Share (%), by Country 2024 & 2032
- Figure 22: South America Infused Drugs Market Volume Share (%), by Country 2024 & 2032
- Figure 23: North America Infused Drugs Market Revenue (Million), by Drug Type 2024 & 2032
- Figure 24: North America Infused Drugs Market Volume (K Unit), by Drug Type 2024 & 2032
- Figure 25: North America Infused Drugs Market Revenue Share (%), by Drug Type 2024 & 2032
- Figure 26: North America Infused Drugs Market Volume Share (%), by Drug Type 2024 & 2032
- Figure 27: North America Infused Drugs Market Revenue (Million), by Therapeutic Area 2024 & 2032
- Figure 28: North America Infused Drugs Market Volume (K Unit), by Therapeutic Area 2024 & 2032
- Figure 29: North America Infused Drugs Market Revenue Share (%), by Therapeutic Area 2024 & 2032
- Figure 30: North America Infused Drugs Market Volume Share (%), by Therapeutic Area 2024 & 2032
- Figure 31: North America Infused Drugs Market Revenue (Million), by Country 2024 & 2032
- Figure 32: North America Infused Drugs Market Volume (K Unit), by Country 2024 & 2032
- Figure 33: North America Infused Drugs Market Revenue Share (%), by Country 2024 & 2032
- Figure 34: North America Infused Drugs Market Volume Share (%), by Country 2024 & 2032
- Figure 35: Europe Infused Drugs Market Revenue (Million), by Drug Type 2024 & 2032
- Figure 36: Europe Infused Drugs Market Volume (K Unit), by Drug Type 2024 & 2032
- Figure 37: Europe Infused Drugs Market Revenue Share (%), by Drug Type 2024 & 2032
- Figure 38: Europe Infused Drugs Market Volume Share (%), by Drug Type 2024 & 2032
- Figure 39: Europe Infused Drugs Market Revenue (Million), by Therapeutic Area 2024 & 2032
- Figure 40: Europe Infused Drugs Market Volume (K Unit), by Therapeutic Area 2024 & 2032
- Figure 41: Europe Infused Drugs Market Revenue Share (%), by Therapeutic Area 2024 & 2032
- Figure 42: Europe Infused Drugs Market Volume Share (%), by Therapeutic Area 2024 & 2032
- Figure 43: Europe Infused Drugs Market Revenue (Million), by Country 2024 & 2032
- Figure 44: Europe Infused Drugs Market Volume (K Unit), by Country 2024 & 2032
- Figure 45: Europe Infused Drugs Market Revenue Share (%), by Country 2024 & 2032
- Figure 46: Europe Infused Drugs Market Volume Share (%), by Country 2024 & 2032
- Figure 47: Asia Pacific Infused Drugs Market Revenue (Million), by Drug Type 2024 & 2032
- Figure 48: Asia Pacific Infused Drugs Market Volume (K Unit), by Drug Type 2024 & 2032
- Figure 49: Asia Pacific Infused Drugs Market Revenue Share (%), by Drug Type 2024 & 2032
- Figure 50: Asia Pacific Infused Drugs Market Volume Share (%), by Drug Type 2024 & 2032
- Figure 51: Asia Pacific Infused Drugs Market Revenue (Million), by Therapeutic Area 2024 & 2032
- Figure 52: Asia Pacific Infused Drugs Market Volume (K Unit), by Therapeutic Area 2024 & 2032
- Figure 53: Asia Pacific Infused Drugs Market Revenue Share (%), by Therapeutic Area 2024 & 2032
- Figure 54: Asia Pacific Infused Drugs Market Volume Share (%), by Therapeutic Area 2024 & 2032
- Figure 55: Asia Pacific Infused Drugs Market Revenue (Million), by Country 2024 & 2032
- Figure 56: Asia Pacific Infused Drugs Market Volume (K Unit), by Country 2024 & 2032
- Figure 57: Asia Pacific Infused Drugs Market Revenue Share (%), by Country 2024 & 2032
- Figure 58: Asia Pacific Infused Drugs Market Volume Share (%), by Country 2024 & 2032
- Figure 59: Middle East and Africa Infused Drugs Market Revenue (Million), by Drug Type 2024 & 2032
- Figure 60: Middle East and Africa Infused Drugs Market Volume (K Unit), by Drug Type 2024 & 2032
- Figure 61: Middle East and Africa Infused Drugs Market Revenue Share (%), by Drug Type 2024 & 2032
- Figure 62: Middle East and Africa Infused Drugs Market Volume Share (%), by Drug Type 2024 & 2032
- Figure 63: Middle East and Africa Infused Drugs Market Revenue (Million), by Therapeutic Area 2024 & 2032
- Figure 64: Middle East and Africa Infused Drugs Market Volume (K Unit), by Therapeutic Area 2024 & 2032
- Figure 65: Middle East and Africa Infused Drugs Market Revenue Share (%), by Therapeutic Area 2024 & 2032
- Figure 66: Middle East and Africa Infused Drugs Market Volume Share (%), by Therapeutic Area 2024 & 2032
- Figure 67: Middle East and Africa Infused Drugs Market Revenue (Million), by Country 2024 & 2032
- Figure 68: Middle East and Africa Infused Drugs Market Volume (K Unit), by Country 2024 & 2032
- Figure 69: Middle East and Africa Infused Drugs Market Revenue Share (%), by Country 2024 & 2032
- Figure 70: Middle East and Africa Infused Drugs Market Volume Share (%), by Country 2024 & 2032
- Figure 71: South America Infused Drugs Market Revenue (Million), by Drug Type 2024 & 2032
- Figure 72: South America Infused Drugs Market Volume (K Unit), by Drug Type 2024 & 2032
- Figure 73: South America Infused Drugs Market Revenue Share (%), by Drug Type 2024 & 2032
- Figure 74: South America Infused Drugs Market Volume Share (%), by Drug Type 2024 & 2032
- Figure 75: South America Infused Drugs Market Revenue (Million), by Therapeutic Area 2024 & 2032
- Figure 76: South America Infused Drugs Market Volume (K Unit), by Therapeutic Area 2024 & 2032
- Figure 77: South America Infused Drugs Market Revenue Share (%), by Therapeutic Area 2024 & 2032
- Figure 78: South America Infused Drugs Market Volume Share (%), by Therapeutic Area 2024 & 2032
- Figure 79: South America Infused Drugs Market Revenue (Million), by Country 2024 & 2032
- Figure 80: South America Infused Drugs Market Volume (K Unit), by Country 2024 & 2032
- Figure 81: South America Infused Drugs Market Revenue Share (%), by Country 2024 & 2032
- Figure 82: South America Infused Drugs Market Volume Share (%), by Country 2024 & 2032
List of Tables
- Table 1: Global Infused Drugs Market Revenue Million Forecast, by Region 2019 & 2032
- Table 2: Global Infused Drugs Market Volume K Unit Forecast, by Region 2019 & 2032
- Table 3: Global Infused Drugs Market Revenue Million Forecast, by Drug Type 2019 & 2032
- Table 4: Global Infused Drugs Market Volume K Unit Forecast, by Drug Type 2019 & 2032
- Table 5: Global Infused Drugs Market Revenue Million Forecast, by Therapeutic Area 2019 & 2032
- Table 6: Global Infused Drugs Market Volume K Unit Forecast, by Therapeutic Area 2019 & 2032
- Table 7: Global Infused Drugs Market Revenue Million Forecast, by Region 2019 & 2032
- Table 8: Global Infused Drugs Market Volume K Unit Forecast, by Region 2019 & 2032
- Table 9: Global Infused Drugs Market Revenue Million Forecast, by Country 2019 & 2032
- Table 10: Global Infused Drugs Market Volume K Unit Forecast, by Country 2019 & 2032
- Table 11: Global Infused Drugs Market Revenue Million Forecast, by Country 2019 & 2032
- Table 12: Global Infused Drugs Market Volume K Unit Forecast, by Country 2019 & 2032
- Table 13: Global Infused Drugs Market Revenue Million Forecast, by Country 2019 & 2032
- Table 14: Global Infused Drugs Market Volume K Unit Forecast, by Country 2019 & 2032
- Table 15: Global Infused Drugs Market Revenue Million Forecast, by Country 2019 & 2032
- Table 16: Global Infused Drugs Market Volume K Unit Forecast, by Country 2019 & 2032
- Table 17: Global Infused Drugs Market Revenue Million Forecast, by Country 2019 & 2032
- Table 18: Global Infused Drugs Market Volume K Unit Forecast, by Country 2019 & 2032
- Table 19: Global Infused Drugs Market Revenue Million Forecast, by Drug Type 2019 & 2032
- Table 20: Global Infused Drugs Market Volume K Unit Forecast, by Drug Type 2019 & 2032
- Table 21: Global Infused Drugs Market Revenue Million Forecast, by Therapeutic Area 2019 & 2032
- Table 22: Global Infused Drugs Market Volume K Unit Forecast, by Therapeutic Area 2019 & 2032
- Table 23: Global Infused Drugs Market Revenue Million Forecast, by Country 2019 & 2032
- Table 24: Global Infused Drugs Market Volume K Unit Forecast, by Country 2019 & 2032
- Table 25: United States Infused Drugs Market Revenue (Million) Forecast, by Application 2019 & 2032
- Table 26: United States Infused Drugs Market Volume (K Unit) Forecast, by Application 2019 & 2032
- Table 27: Canada Infused Drugs Market Revenue (Million) Forecast, by Application 2019 & 2032
- Table 28: Canada Infused Drugs Market Volume (K Unit) Forecast, by Application 2019 & 2032
- Table 29: Mexico Infused Drugs Market Revenue (Million) Forecast, by Application 2019 & 2032
- Table 30: Mexico Infused Drugs Market Volume (K Unit) Forecast, by Application 2019 & 2032
- Table 31: Global Infused Drugs Market Revenue Million Forecast, by Drug Type 2019 & 2032
- Table 32: Global Infused Drugs Market Volume K Unit Forecast, by Drug Type 2019 & 2032
- Table 33: Global Infused Drugs Market Revenue Million Forecast, by Therapeutic Area 2019 & 2032
- Table 34: Global Infused Drugs Market Volume K Unit Forecast, by Therapeutic Area 2019 & 2032
- Table 35: Global Infused Drugs Market Revenue Million Forecast, by Country 2019 & 2032
- Table 36: Global Infused Drugs Market Volume K Unit Forecast, by Country 2019 & 2032
- Table 37: Germany Infused Drugs Market Revenue (Million) Forecast, by Application 2019 & 2032
- Table 38: Germany Infused Drugs Market Volume (K Unit) Forecast, by Application 2019 & 2032
- Table 39: United Kingdom Infused Drugs Market Revenue (Million) Forecast, by Application 2019 & 2032
- Table 40: United Kingdom Infused Drugs Market Volume (K Unit) Forecast, by Application 2019 & 2032
- Table 41: France Infused Drugs Market Revenue (Million) Forecast, by Application 2019 & 2032
- Table 42: France Infused Drugs Market Volume (K Unit) Forecast, by Application 2019 & 2032
- Table 43: Italy Infused Drugs Market Revenue (Million) Forecast, by Application 2019 & 2032
- Table 44: Italy Infused Drugs Market Volume (K Unit) Forecast, by Application 2019 & 2032
- Table 45: Spain Infused Drugs Market Revenue (Million) Forecast, by Application 2019 & 2032
- Table 46: Spain Infused Drugs Market Volume (K Unit) Forecast, by Application 2019 & 2032
- Table 47: Rest of Europe Infused Drugs Market Revenue (Million) Forecast, by Application 2019 & 2032
- Table 48: Rest of Europe Infused Drugs Market Volume (K Unit) Forecast, by Application 2019 & 2032
- Table 49: Global Infused Drugs Market Revenue Million Forecast, by Drug Type 2019 & 2032
- Table 50: Global Infused Drugs Market Volume K Unit Forecast, by Drug Type 2019 & 2032
- Table 51: Global Infused Drugs Market Revenue Million Forecast, by Therapeutic Area 2019 & 2032
- Table 52: Global Infused Drugs Market Volume K Unit Forecast, by Therapeutic Area 2019 & 2032
- Table 53: Global Infused Drugs Market Revenue Million Forecast, by Country 2019 & 2032
- Table 54: Global Infused Drugs Market Volume K Unit Forecast, by Country 2019 & 2032
- Table 55: China Infused Drugs Market Revenue (Million) Forecast, by Application 2019 & 2032
- Table 56: China Infused Drugs Market Volume (K Unit) Forecast, by Application 2019 & 2032
- Table 57: Japan Infused Drugs Market Revenue (Million) Forecast, by Application 2019 & 2032
- Table 58: Japan Infused Drugs Market Volume (K Unit) Forecast, by Application 2019 & 2032
- Table 59: India Infused Drugs Market Revenue (Million) Forecast, by Application 2019 & 2032
- Table 60: India Infused Drugs Market Volume (K Unit) Forecast, by Application 2019 & 2032
- Table 61: Australia Infused Drugs Market Revenue (Million) Forecast, by Application 2019 & 2032
- Table 62: Australia Infused Drugs Market Volume (K Unit) Forecast, by Application 2019 & 2032
- Table 63: South Korea Infused Drugs Market Revenue (Million) Forecast, by Application 2019 & 2032
- Table 64: South Korea Infused Drugs Market Volume (K Unit) Forecast, by Application 2019 & 2032
- Table 65: Rest of Asia Pacific Infused Drugs Market Revenue (Million) Forecast, by Application 2019 & 2032
- Table 66: Rest of Asia Pacific Infused Drugs Market Volume (K Unit) Forecast, by Application 2019 & 2032
- Table 67: Global Infused Drugs Market Revenue Million Forecast, by Drug Type 2019 & 2032
- Table 68: Global Infused Drugs Market Volume K Unit Forecast, by Drug Type 2019 & 2032
- Table 69: Global Infused Drugs Market Revenue Million Forecast, by Therapeutic Area 2019 & 2032
- Table 70: Global Infused Drugs Market Volume K Unit Forecast, by Therapeutic Area 2019 & 2032
- Table 71: Global Infused Drugs Market Revenue Million Forecast, by Country 2019 & 2032
- Table 72: Global Infused Drugs Market Volume K Unit Forecast, by Country 2019 & 2032
- Table 73: GCC Infused Drugs Market Revenue (Million) Forecast, by Application 2019 & 2032
- Table 74: GCC Infused Drugs Market Volume (K Unit) Forecast, by Application 2019 & 2032
- Table 75: South Africa Infused Drugs Market Revenue (Million) Forecast, by Application 2019 & 2032
- Table 76: South Africa Infused Drugs Market Volume (K Unit) Forecast, by Application 2019 & 2032
- Table 77: Rest of Middle East and Africa Infused Drugs Market Revenue (Million) Forecast, by Application 2019 & 2032
- Table 78: Rest of Middle East and Africa Infused Drugs Market Volume (K Unit) Forecast, by Application 2019 & 2032
- Table 79: Global Infused Drugs Market Revenue Million Forecast, by Drug Type 2019 & 2032
- Table 80: Global Infused Drugs Market Volume K Unit Forecast, by Drug Type 2019 & 2032
- Table 81: Global Infused Drugs Market Revenue Million Forecast, by Therapeutic Area 2019 & 2032
- Table 82: Global Infused Drugs Market Volume K Unit Forecast, by Therapeutic Area 2019 & 2032
- Table 83: Global Infused Drugs Market Revenue Million Forecast, by Country 2019 & 2032
- Table 84: Global Infused Drugs Market Volume K Unit Forecast, by Country 2019 & 2032
- Table 85: Brazil Infused Drugs Market Revenue (Million) Forecast, by Application 2019 & 2032
- Table 86: Brazil Infused Drugs Market Volume (K Unit) Forecast, by Application 2019 & 2032
- Table 87: Argentina Infused Drugs Market Revenue (Million) Forecast, by Application 2019 & 2032
- Table 88: Argentina Infused Drugs Market Volume (K Unit) Forecast, by Application 2019 & 2032
- Table 89: Rest of South America Infused Drugs Market Revenue (Million) Forecast, by Application 2019 & 2032
- Table 90: Rest of South America Infused Drugs Market Volume (K Unit) Forecast, by Application 2019 & 2032
Frequently Asked Questions
1. What is the projected Compound Annual Growth Rate (CAGR) of the Infused Drugs Market?
The projected CAGR is approximately 7.30%.
2. Which companies are prominent players in the Infused Drugs Market?
Key companies in the market include Sanofi SA, Regeneron Pharmaceuticals Inc, Amgen Inc, AstraZeneca, Weefsel Pharma, Parenteral Drugs (India) Limited, Teva Pharmaceutical Industries Ltd, Eisai Co Ltd, Bristol-Myers Squibb Company, Pfizer Inc.
3. What are the main segments of the Infused Drugs Market?
The market segments include Drug Type, Therapeutic Area.
4. Can you provide details about the market size?
The market size is estimated to be USD 8.5 Million as of 2022.
5. What are some drivers contributing to market growth?
Increase in the Prevalence of Chronic Diseases; Increasing Geriatric Population.
6. What are the notable trends driving market growth?
Oncology is Expected to Have Significant Market Share During the Forecast Period.
7. Are there any restraints impacting market growth?
Side Effects Associated with the Medications.
8. Can you provide examples of recent developments in the market?
September 2023: Eisai Co. Ltd and Biogen Inc. reported the approval of LEQEMBI intravenous infusion, a humanized anti-soluble aggregated amyloid beta monoclonal antibody in Japan. This approval signifies its recognition as a treatment to decelerate the progression of mild cognitive impairment and dementia resulting from Alzheimer’s Disease.
9. What pricing options are available for accessing the report?
Pricing options include single-user, multi-user, and enterprise licenses priced at USD 4750, USD 5250, and USD 8750 respectively.
10. Is the market size provided in terms of value or volume?
The market size is provided in terms of value, measured in Million and volume, measured in K Unit.
11. Are there any specific market keywords associated with the report?
Yes, the market keyword associated with the report is "Infused Drugs Market," which aids in identifying and referencing the specific market segment covered.
12. How do I determine which pricing option suits my needs best?
The pricing options vary based on user requirements and access needs. Individual users may opt for single-user licenses, while businesses requiring broader access may choose multi-user or enterprise licenses for cost-effective access to the report.
13. Are there any additional resources or data provided in the Infused Drugs Market report?
While the report offers comprehensive insights, it's advisable to review the specific contents or supplementary materials provided to ascertain if additional resources or data are available.
14. How can I stay updated on further developments or reports in the Infused Drugs Market?
To stay informed about further developments, trends, and reports in the Infused Drugs Market, consider subscribing to industry newsletters, following relevant companies and organizations, or regularly checking reputable industry news sources and publications.
Methodology
Step 1 - Identification of Relevant Samples Size from Population Database


Step 2 - Approaches for Defining Global Market Size (Value, Volume* & Price*)

Note*: In applicable scenarios
Step 3 - Data Sources
Primary Research
- Web Analytics
- Survey Reports
- Research Institute
- Latest Research Reports
- Opinion Leaders
Secondary Research
- Annual Reports
- White Paper
- Latest Press Release
- Industry Association
- Paid Database
- Investor Presentations

Step 4 - Data Triangulation
Involves using different sources of information in order to increase the validity of a study
These sources are likely to be stakeholders in a program - participants, other researchers, program staff, other community members, and so on.
Then we put all data in single framework & apply various statistical tools to find out the dynamic on the market.
During the analysis stage, feedback from the stakeholder groups would be compared to determine areas of agreement as well as areas of divergence
