

Key Insights
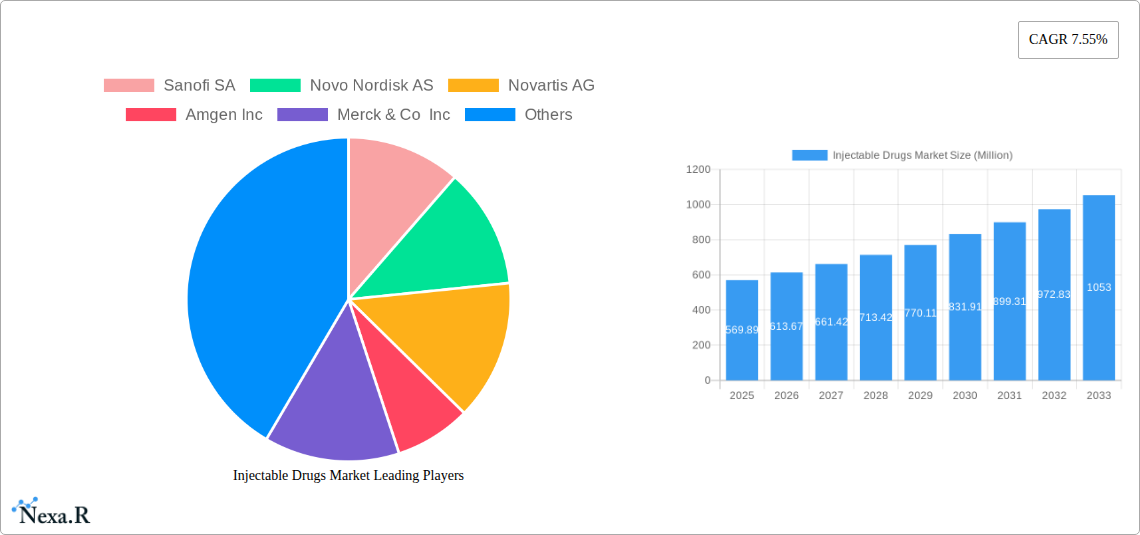
The injectable drugs market, valued at $569.89 million in 2025, is projected to experience robust growth, driven by several key factors. The increasing prevalence of chronic diseases like cancer, diabetes, and autoimmune disorders fuels demand for effective injectable therapies. Advancements in drug delivery technologies, such as biosimilars and targeted drug delivery systems, are further enhancing market expansion. The growing geriatric population, particularly susceptible to chronic illnesses requiring injectable medications, contributes significantly to market growth. Furthermore, ongoing research and development efforts focused on innovative injectable formulations, coupled with rising healthcare expenditure globally, are expected to propel market expansion throughout the forecast period. The market is segmented by molecule type (small molecule and large molecule), drug class (blood factors, cytokines, peptide hormones, immunoglobulins, monoclonal antibodies (mAbs), insulin, and others), and application (oncology, neurology, cardiovascular diseases, autoimmune diseases, infectious diseases, pain management, and others). Competition within the market is intense, with major players like Sanofi SA, Novo Nordisk AS, Novartis AG, and Amgen Inc. investing heavily in R&D and strategic partnerships to maintain market share.
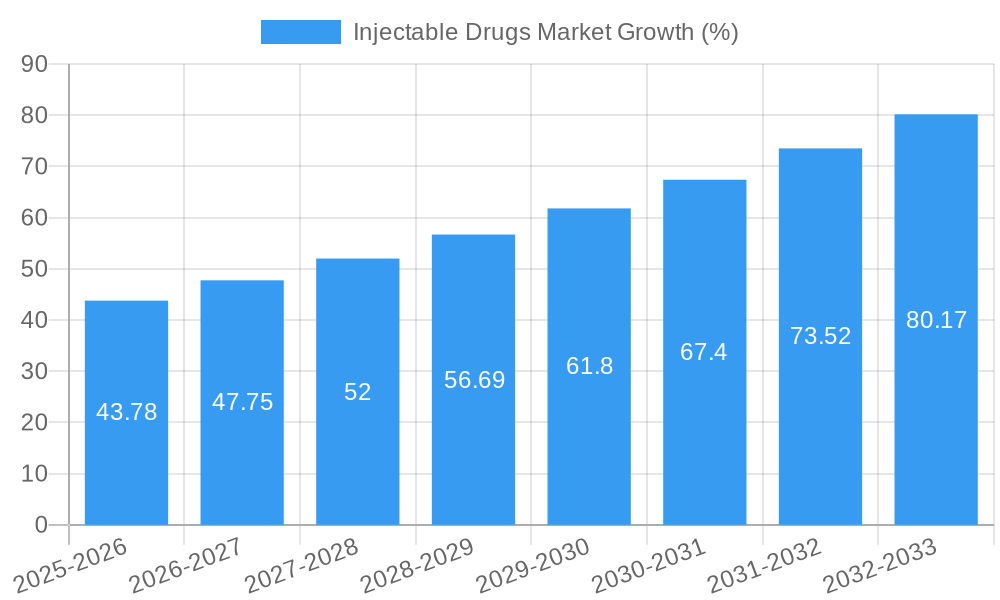
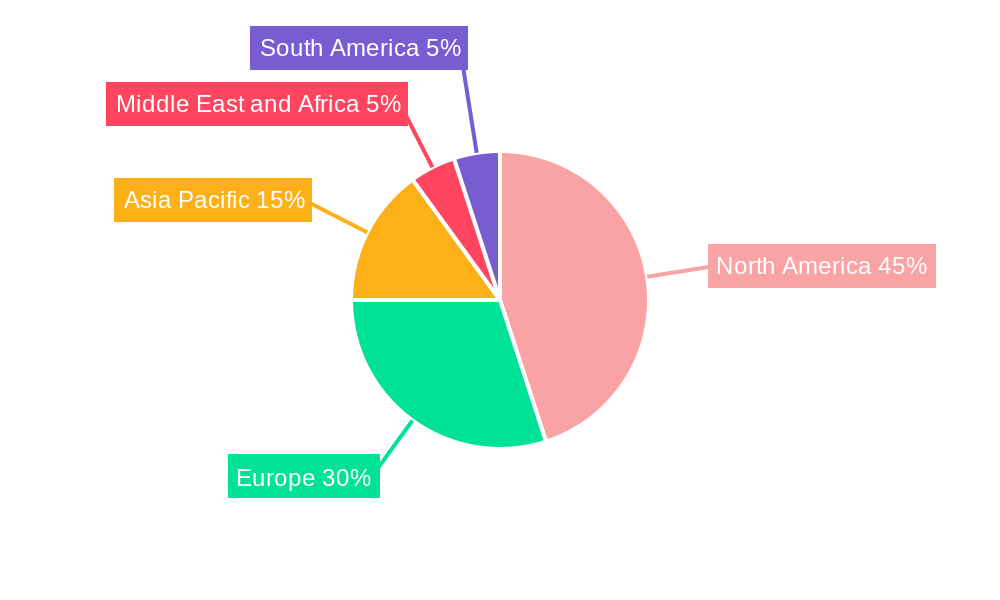
Geographical distribution reflects market maturity and healthcare infrastructure. North America currently dominates the market due to its advanced healthcare systems and high per capita healthcare expenditure. However, the Asia-Pacific region is expected to show the fastest growth rate in the coming years, driven by rising disposable incomes, increasing awareness of healthcare needs, and government initiatives promoting healthcare infrastructure development. Europe and other regions are expected to experience steady growth, albeit at a slower pace compared to Asia-Pacific. The 7.55% CAGR suggests a significant expansion over the forecast period (2025-2033), with the market likely exceeding $1 billion by 2033. However, challenges remain, including the high cost of injectable drugs, potential side effects, and the need for specialized administration techniques which could limit market penetration in certain regions.
Injectable Drugs Market: A Comprehensive Report (2019-2033)
This in-depth report provides a comprehensive analysis of the global Injectable Drugs Market, encompassing market dynamics, growth trends, regional insights, and competitive landscapes. The report covers the period from 2019 to 2033, with a focus on the forecast period of 2025-2033 and a base year of 2025. The market is segmented by molecule type (small molecule, large molecule), drug class (blood factors, cytokines, peptide hormones, immunoglobulins, monoclonal antibodies (mAbs), insulin, other drug classes), and application (oncology, neurology, cardiovascular diseases, autoimmune diseases, infectious diseases, pain, other applications). The report is crucial for pharmaceutical companies, investors, and market researchers seeking a detailed understanding of this rapidly evolving sector. The total market value in 2025 is estimated at XXX million units.
Injectable Drugs Market Dynamics & Structure
The injectable drugs market is characterized by high market concentration, with a few major players dominating the landscape. Technological innovation, particularly in drug delivery systems and biosimilars, is a significant driver. Stringent regulatory frameworks and the need for extensive clinical trials pose barriers to entry. Competition from oral and other drug delivery methods exists, while mergers and acquisitions (M&A) activity is frequent, consolidating market share and driving innovation.
- Market Concentration: High, with top 10 players holding approximately xx% market share in 2024.
- Technological Innovation: Focus on targeted drug delivery, biosimilars, and personalized medicine.
- Regulatory Frameworks: Stringent regulatory approvals impacting timelines and costs.
- Competitive Substitutes: Oral medications, topical treatments, and other drug delivery systems.
- M&A Activity: Significant activity observed in recent years, with xx major deals closed between 2019 and 2024. The total value of these deals is estimated to be approximately xx million units.
- Innovation Barriers: High R&D costs, lengthy clinical trials, and stringent regulatory approvals.
Injectable Drugs Market Growth Trends & Insights
The injectable drugs market exhibits robust growth, driven by increasing prevalence of chronic diseases, rising geriatric population, and advancements in biotechnology. The market size is projected to reach XXX million units by 2033, exhibiting a CAGR of xx% during the forecast period. This growth is fueled by factors like the increasing demand for biologics, growing adoption of targeted therapies in oncology and autoimmune diseases, and the continuous development of innovative drug delivery systems. Technological disruptions, such as the development of biosimilars and personalized medicine approaches, are reshaping the market landscape. Consumer behavior is shifting toward preference for convenient and effective treatment options, driving demand for improved injectable drug delivery systems.
Dominant Regions, Countries, or Segments in Injectable Drugs Market
North America currently dominates the injectable drugs market, driven by high healthcare expenditure, advanced healthcare infrastructure, and a large patient population with chronic diseases. Europe follows as a significant market, showing steady growth. Within the segments, Monoclonal Antibodies (mAbs) and Insulin hold significant market share due to their widespread use in various therapeutic areas. The Oncology application segment demonstrates the highest growth potential owing to increasing cancer prevalence and the development of novel targeted therapies.
- Key Drivers:
- North America: High healthcare expenditure, advanced infrastructure, robust R&D activities.
- Europe: Growing adoption of advanced therapies, favorable regulatory environment.
- Asia-Pacific: Rising disposable income, increasing healthcare awareness, growing geriatric population.
- Dominant Segments:
- By Molecule Type: Large molecule drugs hold a larger market share compared to small molecule injectable drugs.
- By Drug Class: Monoclonal Antibodies (mAbs) and Insulin dominate due to their wide therapeutic applications.
- By Application: Oncology demonstrates the highest growth, driven by an increase in cancer incidence rates.
Injectable Drugs Market Product Landscape
The injectable drugs market showcases a diverse range of products, encompassing various molecule types, drug classes, and delivery systems. Innovations focus on improved efficacy, reduced side effects, and convenient administration. Technological advancements like pre-filled syringes, auto-injectors, and wearable drug delivery systems enhance patient compliance and reduce healthcare costs. Unique selling propositions include targeted drug delivery, extended release formulations, and biosimilars offering cost-effective alternatives to brand-name biologics.
Key Drivers, Barriers & Challenges in Injectable Drugs Market
Key Drivers:
- Growing prevalence of chronic diseases like diabetes, cancer, and autoimmune disorders.
- Technological advancements in drug delivery systems and biosimilars.
- Rising geriatric population requiring more frequent injections.
- Increased healthcare expenditure and insurance coverage.
Challenges & Restraints:
- High R&D costs and lengthy clinical trial processes for new injectable drugs.
- Stringent regulatory requirements and approvals impacting market entry.
- Potential for adverse drug reactions and injection site reactions.
- Competition from other drug delivery methods like oral medications. This competition is projected to impact market growth by approximately xx% by 2033.
Emerging Opportunities in Injectable Drugs Market
Untapped markets in developing economies present significant growth potential. The rising adoption of biosimilars and personalized medicine offers new opportunities for cost-effective treatments and improved patient outcomes. Innovative drug delivery systems like long-acting injectables and targeted delivery platforms are gaining traction. The expanding applications of injectable drugs in emerging therapeutic areas like gene therapy and immunotherapy also contribute to the market expansion.
Growth Accelerators in the Injectable Drugs Market Industry
Strategic partnerships between pharmaceutical companies and biotechnology firms are crucial for accelerating innovation. Technological breakthroughs in drug delivery and formulation technologies are pivotal. Market expansion strategies targeting underserved populations in emerging markets present significant growth potential. Focusing on improving patient adherence and convenience through advancements in auto-injectors and pre-filled syringes will also drive market growth.
Key Players Shaping the Injectable Drugs Market Market
- Sanofi SA
- Novo Nordisk AS
- Novartis AG
- Amgen Inc
- Merck & Co Inc
- F Hoffmann-La Roche Ltd
- AbbVie
- Johnson & Johnson
- Baxter International Inc
- Gilead Sciences Inc
- GlaxoSmithKline PLC
- Pfizer Inc
Notable Milestones in Injectable Drugs Market Sector
- November 2022: FDA approval of tremelimumab in combination with durvalumab and platinum-based chemotherapy for metastatic NSCLC. This approval significantly broadened treatment options and impacted the oncology segment positively.
- May 2022: FDA approval of Eli Lilly's Mounjaro (tirzepatide) injection for type 2 diabetes. This launch introduced a novel once-weekly treatment option, impacting the diabetes care market.
In-Depth Injectable Drugs Market Market Outlook
The injectable drugs market is poised for continued robust growth, driven by ongoing technological advancements, expanding therapeutic applications, and a growing need for effective treatments for chronic diseases. Strategic opportunities exist in developing innovative drug delivery systems, exploring biosimilars, and expanding into untapped markets. The future will see increased focus on personalized medicine and targeted therapies, further driving market expansion and innovation.
Injectable Drugs Market Segmentation
-
1. Molecule Type
- 1.1. Small Molecule
- 1.2. Large Molecule
-
2. Application
- 2.1. Oncology
- 2.2. Neurology
- 2.3. Cardiovascular Diseases
- 2.4. Autoimmune Diseases
- 2.5. Infectious Diseases
- 2.6. Pain
- 2.7. Other Applications
Injectable Drugs Market Segmentation By Geography
-
1. North America
- 1.1. United States
- 1.2. Canada
- 1.3. Mexico
-
2. Europe
- 2.1. Germany
- 2.2. United Kingdom
- 2.3. France
- 2.4. Italy
- 2.5. Spain
- 2.6. Rest of Europe
-
3. Asia Pacific
- 3.1. China
- 3.2. Japan
- 3.3. India
- 3.4. Australia
- 3.5. South Korea
- 3.6. Rest of Asia Pacific
-
4. Middle East and Africa
- 4.1. GCC
- 4.2. South Africa
- 4.3. Rest of Middle East and Africa
-
5. South America
- 5.1. Brazil
- 5.2. Argentina
- 5.3. Rest of South America
Injectable Drugs Market REPORT HIGHLIGHTS
| Aspects | Details |
|---|---|
| Study Period | 2019-2033 |
| Base Year | 2024 |
| Estimated Year | 2025 |
| Forecast Period | 2025-2033 |
| Historical Period | 2019-2024 |
| Growth Rate | CAGR of 7.55% from 2019-2033 |
| Segmentation |
|
Table of Contents
- 1. Introduction
- 1.1. Research Scope
- 1.2. Market Segmentation
- 1.3. Research Methodology
- 1.4. Definitions and Assumptions
- 2. Executive Summary
- 2.1. Introduction
- 3. Market Dynamics
- 3.1. Introduction
- 3.2. Market Drivers
- 3.2.1. Rising R&D Focus on the Development of Biotechnology-engineered Anti-cancer Drugs; Rapid Growth in the Usage of Pre-filled Syringes for Biologics; Increased Outsourcing Activities Across Value Chain Expected to Boost Supply of Injectable Products
- 3.3. Market Restrains
- 3.3.1. High Expenses Associated with Inventory Management; Availability of Alternate Drug Delivery Methods
- 3.4. Market Trends
- 3.4.1. Oncology Is Expected to Have Significant Market Share During the Forecast Period
- 4. Market Factor Analysis
- 4.1. Porters Five Forces
- 4.2. Supply/Value Chain
- 4.3. PESTEL analysis
- 4.4. Market Entropy
- 4.5. Patent/Trademark Analysis
- 5. Global Injectable Drugs Market Analysis, Insights and Forecast, 2019-2031
- 5.1. Market Analysis, Insights and Forecast - by Molecule Type
- 5.1.1. Small Molecule
- 5.1.2. Large Molecule
- 5.2. Market Analysis, Insights and Forecast - by Application
- 5.2.1. Oncology
- 5.2.2. Neurology
- 5.2.3. Cardiovascular Diseases
- 5.2.4. Autoimmune Diseases
- 5.2.5. Infectious Diseases
- 5.2.6. Pain
- 5.2.7. Other Applications
- 5.3. Market Analysis, Insights and Forecast - by Region
- 5.3.1. North America
- 5.3.2. Europe
- 5.3.3. Asia Pacific
- 5.3.4. Middle East and Africa
- 5.3.5. South America
- 5.1. Market Analysis, Insights and Forecast - by Molecule Type
- 6. North America Injectable Drugs Market Analysis, Insights and Forecast, 2019-2031
- 6.1. Market Analysis, Insights and Forecast - by Molecule Type
- 6.1.1. Small Molecule
- 6.1.2. Large Molecule
- 6.2. Market Analysis, Insights and Forecast - by Application
- 6.2.1. Oncology
- 6.2.2. Neurology
- 6.2.3. Cardiovascular Diseases
- 6.2.4. Autoimmune Diseases
- 6.2.5. Infectious Diseases
- 6.2.6. Pain
- 6.2.7. Other Applications
- 6.1. Market Analysis, Insights and Forecast - by Molecule Type
- 7. Europe Injectable Drugs Market Analysis, Insights and Forecast, 2019-2031
- 7.1. Market Analysis, Insights and Forecast - by Molecule Type
- 7.1.1. Small Molecule
- 7.1.2. Large Molecule
- 7.2. Market Analysis, Insights and Forecast - by Application
- 7.2.1. Oncology
- 7.2.2. Neurology
- 7.2.3. Cardiovascular Diseases
- 7.2.4. Autoimmune Diseases
- 7.2.5. Infectious Diseases
- 7.2.6. Pain
- 7.2.7. Other Applications
- 7.1. Market Analysis, Insights and Forecast - by Molecule Type
- 8. Asia Pacific Injectable Drugs Market Analysis, Insights and Forecast, 2019-2031
- 8.1. Market Analysis, Insights and Forecast - by Molecule Type
- 8.1.1. Small Molecule
- 8.1.2. Large Molecule
- 8.2. Market Analysis, Insights and Forecast - by Application
- 8.2.1. Oncology
- 8.2.2. Neurology
- 8.2.3. Cardiovascular Diseases
- 8.2.4. Autoimmune Diseases
- 8.2.5. Infectious Diseases
- 8.2.6. Pain
- 8.2.7. Other Applications
- 8.1. Market Analysis, Insights and Forecast - by Molecule Type
- 9. Middle East and Africa Injectable Drugs Market Analysis, Insights and Forecast, 2019-2031
- 9.1. Market Analysis, Insights and Forecast - by Molecule Type
- 9.1.1. Small Molecule
- 9.1.2. Large Molecule
- 9.2. Market Analysis, Insights and Forecast - by Application
- 9.2.1. Oncology
- 9.2.2. Neurology
- 9.2.3. Cardiovascular Diseases
- 9.2.4. Autoimmune Diseases
- 9.2.5. Infectious Diseases
- 9.2.6. Pain
- 9.2.7. Other Applications
- 9.1. Market Analysis, Insights and Forecast - by Molecule Type
- 10. South America Injectable Drugs Market Analysis, Insights and Forecast, 2019-2031
- 10.1. Market Analysis, Insights and Forecast - by Molecule Type
- 10.1.1. Small Molecule
- 10.1.2. Large Molecule
- 10.2. Market Analysis, Insights and Forecast - by Application
- 10.2.1. Oncology
- 10.2.2. Neurology
- 10.2.3. Cardiovascular Diseases
- 10.2.4. Autoimmune Diseases
- 10.2.5. Infectious Diseases
- 10.2.6. Pain
- 10.2.7. Other Applications
- 10.1. Market Analysis, Insights and Forecast - by Molecule Type
- 11. North America Injectable Drugs Market Analysis, Insights and Forecast, 2019-2031
- 11.1. Market Analysis, Insights and Forecast - By Country/Sub-region
- 11.1.1 United States
- 11.1.2 Canada
- 11.1.3 Mexico
- 12. Europe Injectable Drugs Market Analysis, Insights and Forecast, 2019-2031
- 12.1. Market Analysis, Insights and Forecast - By Country/Sub-region
- 12.1.1 Germany
- 12.1.2 United Kingdom
- 12.1.3 France
- 12.1.4 Italy
- 12.1.5 Spain
- 12.1.6 Rest of Europe
- 13. Asia Pacific Injectable Drugs Market Analysis, Insights and Forecast, 2019-2031
- 13.1. Market Analysis, Insights and Forecast - By Country/Sub-region
- 13.1.1 China
- 13.1.2 Japan
- 13.1.3 India
- 13.1.4 Australia
- 13.1.5 South Korea
- 13.1.6 Rest of Asia Pacific
- 14. Middle East and Africa Injectable Drugs Market Analysis, Insights and Forecast, 2019-2031
- 14.1. Market Analysis, Insights and Forecast - By Country/Sub-region
- 14.1.1 GCC
- 14.1.2 South Africa
- 14.1.3 Rest of Middle East and Africa
- 15. South America Injectable Drugs Market Analysis, Insights and Forecast, 2019-2031
- 15.1. Market Analysis, Insights and Forecast - By Country/Sub-region
- 15.1.1 Brazil
- 15.1.2 Argentina
- 15.1.3 Rest of South America
- 16. Competitive Analysis
- 16.1. Global Market Share Analysis 2024
- 16.2. Company Profiles
- 16.2.1 Sanofi SA
- 16.2.1.1. Overview
- 16.2.1.2. Products
- 16.2.1.3. SWOT Analysis
- 16.2.1.4. Recent Developments
- 16.2.1.5. Financials (Based on Availability)
- 16.2.2 Novo Nordisk AS
- 16.2.2.1. Overview
- 16.2.2.2. Products
- 16.2.2.3. SWOT Analysis
- 16.2.2.4. Recent Developments
- 16.2.2.5. Financials (Based on Availability)
- 16.2.3 Novartis AG
- 16.2.3.1. Overview
- 16.2.3.2. Products
- 16.2.3.3. SWOT Analysis
- 16.2.3.4. Recent Developments
- 16.2.3.5. Financials (Based on Availability)
- 16.2.4 Amgen Inc
- 16.2.4.1. Overview
- 16.2.4.2. Products
- 16.2.4.3. SWOT Analysis
- 16.2.4.4. Recent Developments
- 16.2.4.5. Financials (Based on Availability)
- 16.2.5 Merck & Co Inc
- 16.2.5.1. Overview
- 16.2.5.2. Products
- 16.2.5.3. SWOT Analysis
- 16.2.5.4. Recent Developments
- 16.2.5.5. Financials (Based on Availability)
- 16.2.6 F Hoffmann-La Roche Ltd
- 16.2.6.1. Overview
- 16.2.6.2. Products
- 16.2.6.3. SWOT Analysis
- 16.2.6.4. Recent Developments
- 16.2.6.5. Financials (Based on Availability)
- 16.2.7 AbbVie
- 16.2.7.1. Overview
- 16.2.7.2. Products
- 16.2.7.3. SWOT Analysis
- 16.2.7.4. Recent Developments
- 16.2.7.5. Financials (Based on Availability)
- 16.2.8 Johnson & Johnson
- 16.2.8.1. Overview
- 16.2.8.2. Products
- 16.2.8.3. SWOT Analysis
- 16.2.8.4. Recent Developments
- 16.2.8.5. Financials (Based on Availability)
- 16.2.9 Baxter International Inc
- 16.2.9.1. Overview
- 16.2.9.2. Products
- 16.2.9.3. SWOT Analysis
- 16.2.9.4. Recent Developments
- 16.2.9.5. Financials (Based on Availability)
- 16.2.10 Gilead Sciences Inc
- 16.2.10.1. Overview
- 16.2.10.2. Products
- 16.2.10.3. SWOT Analysis
- 16.2.10.4. Recent Developments
- 16.2.10.5. Financials (Based on Availability)
- 16.2.11 GlaxoSmithKline PLC
- 16.2.11.1. Overview
- 16.2.11.2. Products
- 16.2.11.3. SWOT Analysis
- 16.2.11.4. Recent Developments
- 16.2.11.5. Financials (Based on Availability)
- 16.2.12 Pfizer Inc
- 16.2.12.1. Overview
- 16.2.12.2. Products
- 16.2.12.3. SWOT Analysis
- 16.2.12.4. Recent Developments
- 16.2.12.5. Financials (Based on Availability)
- 16.2.1 Sanofi SA
List of Figures
- Figure 1: Global Injectable Drugs Market Revenue Breakdown (Million, %) by Region 2024 & 2032
- Figure 2: Global Injectable Drugs Market Volume Breakdown (K Unit, %) by Region 2024 & 2032
- Figure 3: North America Injectable Drugs Market Revenue (Million), by Country 2024 & 2032
- Figure 4: North America Injectable Drugs Market Volume (K Unit), by Country 2024 & 2032
- Figure 5: North America Injectable Drugs Market Revenue Share (%), by Country 2024 & 2032
- Figure 6: North America Injectable Drugs Market Volume Share (%), by Country 2024 & 2032
- Figure 7: Europe Injectable Drugs Market Revenue (Million), by Country 2024 & 2032
- Figure 8: Europe Injectable Drugs Market Volume (K Unit), by Country 2024 & 2032
- Figure 9: Europe Injectable Drugs Market Revenue Share (%), by Country 2024 & 2032
- Figure 10: Europe Injectable Drugs Market Volume Share (%), by Country 2024 & 2032
- Figure 11: Asia Pacific Injectable Drugs Market Revenue (Million), by Country 2024 & 2032
- Figure 12: Asia Pacific Injectable Drugs Market Volume (K Unit), by Country 2024 & 2032
- Figure 13: Asia Pacific Injectable Drugs Market Revenue Share (%), by Country 2024 & 2032
- Figure 14: Asia Pacific Injectable Drugs Market Volume Share (%), by Country 2024 & 2032
- Figure 15: Middle East and Africa Injectable Drugs Market Revenue (Million), by Country 2024 & 2032
- Figure 16: Middle East and Africa Injectable Drugs Market Volume (K Unit), by Country 2024 & 2032
- Figure 17: Middle East and Africa Injectable Drugs Market Revenue Share (%), by Country 2024 & 2032
- Figure 18: Middle East and Africa Injectable Drugs Market Volume Share (%), by Country 2024 & 2032
- Figure 19: South America Injectable Drugs Market Revenue (Million), by Country 2024 & 2032
- Figure 20: South America Injectable Drugs Market Volume (K Unit), by Country 2024 & 2032
- Figure 21: South America Injectable Drugs Market Revenue Share (%), by Country 2024 & 2032
- Figure 22: South America Injectable Drugs Market Volume Share (%), by Country 2024 & 2032
- Figure 23: North America Injectable Drugs Market Revenue (Million), by Molecule Type 2024 & 2032
- Figure 24: North America Injectable Drugs Market Volume (K Unit), by Molecule Type 2024 & 2032
- Figure 25: North America Injectable Drugs Market Revenue Share (%), by Molecule Type 2024 & 2032
- Figure 26: North America Injectable Drugs Market Volume Share (%), by Molecule Type 2024 & 2032
- Figure 27: North America Injectable Drugs Market Revenue (Million), by Application 2024 & 2032
- Figure 28: North America Injectable Drugs Market Volume (K Unit), by Application 2024 & 2032
- Figure 29: North America Injectable Drugs Market Revenue Share (%), by Application 2024 & 2032
- Figure 30: North America Injectable Drugs Market Volume Share (%), by Application 2024 & 2032
- Figure 31: North America Injectable Drugs Market Revenue (Million), by Country 2024 & 2032
- Figure 32: North America Injectable Drugs Market Volume (K Unit), by Country 2024 & 2032
- Figure 33: North America Injectable Drugs Market Revenue Share (%), by Country 2024 & 2032
- Figure 34: North America Injectable Drugs Market Volume Share (%), by Country 2024 & 2032
- Figure 35: Europe Injectable Drugs Market Revenue (Million), by Molecule Type 2024 & 2032
- Figure 36: Europe Injectable Drugs Market Volume (K Unit), by Molecule Type 2024 & 2032
- Figure 37: Europe Injectable Drugs Market Revenue Share (%), by Molecule Type 2024 & 2032
- Figure 38: Europe Injectable Drugs Market Volume Share (%), by Molecule Type 2024 & 2032
- Figure 39: Europe Injectable Drugs Market Revenue (Million), by Application 2024 & 2032
- Figure 40: Europe Injectable Drugs Market Volume (K Unit), by Application 2024 & 2032
- Figure 41: Europe Injectable Drugs Market Revenue Share (%), by Application 2024 & 2032
- Figure 42: Europe Injectable Drugs Market Volume Share (%), by Application 2024 & 2032
- Figure 43: Europe Injectable Drugs Market Revenue (Million), by Country 2024 & 2032
- Figure 44: Europe Injectable Drugs Market Volume (K Unit), by Country 2024 & 2032
- Figure 45: Europe Injectable Drugs Market Revenue Share (%), by Country 2024 & 2032
- Figure 46: Europe Injectable Drugs Market Volume Share (%), by Country 2024 & 2032
- Figure 47: Asia Pacific Injectable Drugs Market Revenue (Million), by Molecule Type 2024 & 2032
- Figure 48: Asia Pacific Injectable Drugs Market Volume (K Unit), by Molecule Type 2024 & 2032
- Figure 49: Asia Pacific Injectable Drugs Market Revenue Share (%), by Molecule Type 2024 & 2032
- Figure 50: Asia Pacific Injectable Drugs Market Volume Share (%), by Molecule Type 2024 & 2032
- Figure 51: Asia Pacific Injectable Drugs Market Revenue (Million), by Application 2024 & 2032
- Figure 52: Asia Pacific Injectable Drugs Market Volume (K Unit), by Application 2024 & 2032
- Figure 53: Asia Pacific Injectable Drugs Market Revenue Share (%), by Application 2024 & 2032
- Figure 54: Asia Pacific Injectable Drugs Market Volume Share (%), by Application 2024 & 2032
- Figure 55: Asia Pacific Injectable Drugs Market Revenue (Million), by Country 2024 & 2032
- Figure 56: Asia Pacific Injectable Drugs Market Volume (K Unit), by Country 2024 & 2032
- Figure 57: Asia Pacific Injectable Drugs Market Revenue Share (%), by Country 2024 & 2032
- Figure 58: Asia Pacific Injectable Drugs Market Volume Share (%), by Country 2024 & 2032
- Figure 59: Middle East and Africa Injectable Drugs Market Revenue (Million), by Molecule Type 2024 & 2032
- Figure 60: Middle East and Africa Injectable Drugs Market Volume (K Unit), by Molecule Type 2024 & 2032
- Figure 61: Middle East and Africa Injectable Drugs Market Revenue Share (%), by Molecule Type 2024 & 2032
- Figure 62: Middle East and Africa Injectable Drugs Market Volume Share (%), by Molecule Type 2024 & 2032
- Figure 63: Middle East and Africa Injectable Drugs Market Revenue (Million), by Application 2024 & 2032
- Figure 64: Middle East and Africa Injectable Drugs Market Volume (K Unit), by Application 2024 & 2032
- Figure 65: Middle East and Africa Injectable Drugs Market Revenue Share (%), by Application 2024 & 2032
- Figure 66: Middle East and Africa Injectable Drugs Market Volume Share (%), by Application 2024 & 2032
- Figure 67: Middle East and Africa Injectable Drugs Market Revenue (Million), by Country 2024 & 2032
- Figure 68: Middle East and Africa Injectable Drugs Market Volume (K Unit), by Country 2024 & 2032
- Figure 69: Middle East and Africa Injectable Drugs Market Revenue Share (%), by Country 2024 & 2032
- Figure 70: Middle East and Africa Injectable Drugs Market Volume Share (%), by Country 2024 & 2032
- Figure 71: South America Injectable Drugs Market Revenue (Million), by Molecule Type 2024 & 2032
- Figure 72: South America Injectable Drugs Market Volume (K Unit), by Molecule Type 2024 & 2032
- Figure 73: South America Injectable Drugs Market Revenue Share (%), by Molecule Type 2024 & 2032
- Figure 74: South America Injectable Drugs Market Volume Share (%), by Molecule Type 2024 & 2032
- Figure 75: South America Injectable Drugs Market Revenue (Million), by Application 2024 & 2032
- Figure 76: South America Injectable Drugs Market Volume (K Unit), by Application 2024 & 2032
- Figure 77: South America Injectable Drugs Market Revenue Share (%), by Application 2024 & 2032
- Figure 78: South America Injectable Drugs Market Volume Share (%), by Application 2024 & 2032
- Figure 79: South America Injectable Drugs Market Revenue (Million), by Country 2024 & 2032
- Figure 80: South America Injectable Drugs Market Volume (K Unit), by Country 2024 & 2032
- Figure 81: South America Injectable Drugs Market Revenue Share (%), by Country 2024 & 2032
- Figure 82: South America Injectable Drugs Market Volume Share (%), by Country 2024 & 2032
List of Tables
- Table 1: Global Injectable Drugs Market Revenue Million Forecast, by Region 2019 & 2032
- Table 2: Global Injectable Drugs Market Volume K Unit Forecast, by Region 2019 & 2032
- Table 3: Global Injectable Drugs Market Revenue Million Forecast, by Molecule Type 2019 & 2032
- Table 4: Global Injectable Drugs Market Volume K Unit Forecast, by Molecule Type 2019 & 2032
- Table 5: Global Injectable Drugs Market Revenue Million Forecast, by Application 2019 & 2032
- Table 6: Global Injectable Drugs Market Volume K Unit Forecast, by Application 2019 & 2032
- Table 7: Global Injectable Drugs Market Revenue Million Forecast, by Region 2019 & 2032
- Table 8: Global Injectable Drugs Market Volume K Unit Forecast, by Region 2019 & 2032
- Table 9: Global Injectable Drugs Market Revenue Million Forecast, by Country 2019 & 2032
- Table 10: Global Injectable Drugs Market Volume K Unit Forecast, by Country 2019 & 2032
- Table 11: United States Injectable Drugs Market Revenue (Million) Forecast, by Application 2019 & 2032
- Table 12: United States Injectable Drugs Market Volume (K Unit) Forecast, by Application 2019 & 2032
- Table 13: Canada Injectable Drugs Market Revenue (Million) Forecast, by Application 2019 & 2032
- Table 14: Canada Injectable Drugs Market Volume (K Unit) Forecast, by Application 2019 & 2032
- Table 15: Mexico Injectable Drugs Market Revenue (Million) Forecast, by Application 2019 & 2032
- Table 16: Mexico Injectable Drugs Market Volume (K Unit) Forecast, by Application 2019 & 2032
- Table 17: Global Injectable Drugs Market Revenue Million Forecast, by Country 2019 & 2032
- Table 18: Global Injectable Drugs Market Volume K Unit Forecast, by Country 2019 & 2032
- Table 19: Germany Injectable Drugs Market Revenue (Million) Forecast, by Application 2019 & 2032
- Table 20: Germany Injectable Drugs Market Volume (K Unit) Forecast, by Application 2019 & 2032
- Table 21: United Kingdom Injectable Drugs Market Revenue (Million) Forecast, by Application 2019 & 2032
- Table 22: United Kingdom Injectable Drugs Market Volume (K Unit) Forecast, by Application 2019 & 2032
- Table 23: France Injectable Drugs Market Revenue (Million) Forecast, by Application 2019 & 2032
- Table 24: France Injectable Drugs Market Volume (K Unit) Forecast, by Application 2019 & 2032
- Table 25: Italy Injectable Drugs Market Revenue (Million) Forecast, by Application 2019 & 2032
- Table 26: Italy Injectable Drugs Market Volume (K Unit) Forecast, by Application 2019 & 2032
- Table 27: Spain Injectable Drugs Market Revenue (Million) Forecast, by Application 2019 & 2032
- Table 28: Spain Injectable Drugs Market Volume (K Unit) Forecast, by Application 2019 & 2032
- Table 29: Rest of Europe Injectable Drugs Market Revenue (Million) Forecast, by Application 2019 & 2032
- Table 30: Rest of Europe Injectable Drugs Market Volume (K Unit) Forecast, by Application 2019 & 2032
- Table 31: Global Injectable Drugs Market Revenue Million Forecast, by Country 2019 & 2032
- Table 32: Global Injectable Drugs Market Volume K Unit Forecast, by Country 2019 & 2032
- Table 33: China Injectable Drugs Market Revenue (Million) Forecast, by Application 2019 & 2032
- Table 34: China Injectable Drugs Market Volume (K Unit) Forecast, by Application 2019 & 2032
- Table 35: Japan Injectable Drugs Market Revenue (Million) Forecast, by Application 2019 & 2032
- Table 36: Japan Injectable Drugs Market Volume (K Unit) Forecast, by Application 2019 & 2032
- Table 37: India Injectable Drugs Market Revenue (Million) Forecast, by Application 2019 & 2032
- Table 38: India Injectable Drugs Market Volume (K Unit) Forecast, by Application 2019 & 2032
- Table 39: Australia Injectable Drugs Market Revenue (Million) Forecast, by Application 2019 & 2032
- Table 40: Australia Injectable Drugs Market Volume (K Unit) Forecast, by Application 2019 & 2032
- Table 41: South Korea Injectable Drugs Market Revenue (Million) Forecast, by Application 2019 & 2032
- Table 42: South Korea Injectable Drugs Market Volume (K Unit) Forecast, by Application 2019 & 2032
- Table 43: Rest of Asia Pacific Injectable Drugs Market Revenue (Million) Forecast, by Application 2019 & 2032
- Table 44: Rest of Asia Pacific Injectable Drugs Market Volume (K Unit) Forecast, by Application 2019 & 2032
- Table 45: Global Injectable Drugs Market Revenue Million Forecast, by Country 2019 & 2032
- Table 46: Global Injectable Drugs Market Volume K Unit Forecast, by Country 2019 & 2032
- Table 47: GCC Injectable Drugs Market Revenue (Million) Forecast, by Application 2019 & 2032
- Table 48: GCC Injectable Drugs Market Volume (K Unit) Forecast, by Application 2019 & 2032
- Table 49: South Africa Injectable Drugs Market Revenue (Million) Forecast, by Application 2019 & 2032
- Table 50: South Africa Injectable Drugs Market Volume (K Unit) Forecast, by Application 2019 & 2032
- Table 51: Rest of Middle East and Africa Injectable Drugs Market Revenue (Million) Forecast, by Application 2019 & 2032
- Table 52: Rest of Middle East and Africa Injectable Drugs Market Volume (K Unit) Forecast, by Application 2019 & 2032
- Table 53: Global Injectable Drugs Market Revenue Million Forecast, by Country 2019 & 2032
- Table 54: Global Injectable Drugs Market Volume K Unit Forecast, by Country 2019 & 2032
- Table 55: Brazil Injectable Drugs Market Revenue (Million) Forecast, by Application 2019 & 2032
- Table 56: Brazil Injectable Drugs Market Volume (K Unit) Forecast, by Application 2019 & 2032
- Table 57: Argentina Injectable Drugs Market Revenue (Million) Forecast, by Application 2019 & 2032
- Table 58: Argentina Injectable Drugs Market Volume (K Unit) Forecast, by Application 2019 & 2032
- Table 59: Rest of South America Injectable Drugs Market Revenue (Million) Forecast, by Application 2019 & 2032
- Table 60: Rest of South America Injectable Drugs Market Volume (K Unit) Forecast, by Application 2019 & 2032
- Table 61: Global Injectable Drugs Market Revenue Million Forecast, by Molecule Type 2019 & 2032
- Table 62: Global Injectable Drugs Market Volume K Unit Forecast, by Molecule Type 2019 & 2032
- Table 63: Global Injectable Drugs Market Revenue Million Forecast, by Application 2019 & 2032
- Table 64: Global Injectable Drugs Market Volume K Unit Forecast, by Application 2019 & 2032
- Table 65: Global Injectable Drugs Market Revenue Million Forecast, by Country 2019 & 2032
- Table 66: Global Injectable Drugs Market Volume K Unit Forecast, by Country 2019 & 2032
- Table 67: United States Injectable Drugs Market Revenue (Million) Forecast, by Application 2019 & 2032
- Table 68: United States Injectable Drugs Market Volume (K Unit) Forecast, by Application 2019 & 2032
- Table 69: Canada Injectable Drugs Market Revenue (Million) Forecast, by Application 2019 & 2032
- Table 70: Canada Injectable Drugs Market Volume (K Unit) Forecast, by Application 2019 & 2032
- Table 71: Mexico Injectable Drugs Market Revenue (Million) Forecast, by Application 2019 & 2032
- Table 72: Mexico Injectable Drugs Market Volume (K Unit) Forecast, by Application 2019 & 2032
- Table 73: Global Injectable Drugs Market Revenue Million Forecast, by Molecule Type 2019 & 2032
- Table 74: Global Injectable Drugs Market Volume K Unit Forecast, by Molecule Type 2019 & 2032
- Table 75: Global Injectable Drugs Market Revenue Million Forecast, by Application 2019 & 2032
- Table 76: Global Injectable Drugs Market Volume K Unit Forecast, by Application 2019 & 2032
- Table 77: Global Injectable Drugs Market Revenue Million Forecast, by Country 2019 & 2032
- Table 78: Global Injectable Drugs Market Volume K Unit Forecast, by Country 2019 & 2032
- Table 79: Germany Injectable Drugs Market Revenue (Million) Forecast, by Application 2019 & 2032
- Table 80: Germany Injectable Drugs Market Volume (K Unit) Forecast, by Application 2019 & 2032
- Table 81: United Kingdom Injectable Drugs Market Revenue (Million) Forecast, by Application 2019 & 2032
- Table 82: United Kingdom Injectable Drugs Market Volume (K Unit) Forecast, by Application 2019 & 2032
- Table 83: France Injectable Drugs Market Revenue (Million) Forecast, by Application 2019 & 2032
- Table 84: France Injectable Drugs Market Volume (K Unit) Forecast, by Application 2019 & 2032
- Table 85: Italy Injectable Drugs Market Revenue (Million) Forecast, by Application 2019 & 2032
- Table 86: Italy Injectable Drugs Market Volume (K Unit) Forecast, by Application 2019 & 2032
- Table 87: Spain Injectable Drugs Market Revenue (Million) Forecast, by Application 2019 & 2032
- Table 88: Spain Injectable Drugs Market Volume (K Unit) Forecast, by Application 2019 & 2032
- Table 89: Rest of Europe Injectable Drugs Market Revenue (Million) Forecast, by Application 2019 & 2032
- Table 90: Rest of Europe Injectable Drugs Market Volume (K Unit) Forecast, by Application 2019 & 2032
- Table 91: Global Injectable Drugs Market Revenue Million Forecast, by Molecule Type 2019 & 2032
- Table 92: Global Injectable Drugs Market Volume K Unit Forecast, by Molecule Type 2019 & 2032
- Table 93: Global Injectable Drugs Market Revenue Million Forecast, by Application 2019 & 2032
- Table 94: Global Injectable Drugs Market Volume K Unit Forecast, by Application 2019 & 2032
- Table 95: Global Injectable Drugs Market Revenue Million Forecast, by Country 2019 & 2032
- Table 96: Global Injectable Drugs Market Volume K Unit Forecast, by Country 2019 & 2032
- Table 97: China Injectable Drugs Market Revenue (Million) Forecast, by Application 2019 & 2032
- Table 98: China Injectable Drugs Market Volume (K Unit) Forecast, by Application 2019 & 2032
- Table 99: Japan Injectable Drugs Market Revenue (Million) Forecast, by Application 2019 & 2032
- Table 100: Japan Injectable Drugs Market Volume (K Unit) Forecast, by Application 2019 & 2032
- Table 101: India Injectable Drugs Market Revenue (Million) Forecast, by Application 2019 & 2032
- Table 102: India Injectable Drugs Market Volume (K Unit) Forecast, by Application 2019 & 2032
- Table 103: Australia Injectable Drugs Market Revenue (Million) Forecast, by Application 2019 & 2032
- Table 104: Australia Injectable Drugs Market Volume (K Unit) Forecast, by Application 2019 & 2032
- Table 105: South Korea Injectable Drugs Market Revenue (Million) Forecast, by Application 2019 & 2032
- Table 106: South Korea Injectable Drugs Market Volume (K Unit) Forecast, by Application 2019 & 2032
- Table 107: Rest of Asia Pacific Injectable Drugs Market Revenue (Million) Forecast, by Application 2019 & 2032
- Table 108: Rest of Asia Pacific Injectable Drugs Market Volume (K Unit) Forecast, by Application 2019 & 2032
- Table 109: Global Injectable Drugs Market Revenue Million Forecast, by Molecule Type 2019 & 2032
- Table 110: Global Injectable Drugs Market Volume K Unit Forecast, by Molecule Type 2019 & 2032
- Table 111: Global Injectable Drugs Market Revenue Million Forecast, by Application 2019 & 2032
- Table 112: Global Injectable Drugs Market Volume K Unit Forecast, by Application 2019 & 2032
- Table 113: Global Injectable Drugs Market Revenue Million Forecast, by Country 2019 & 2032
- Table 114: Global Injectable Drugs Market Volume K Unit Forecast, by Country 2019 & 2032
- Table 115: GCC Injectable Drugs Market Revenue (Million) Forecast, by Application 2019 & 2032
- Table 116: GCC Injectable Drugs Market Volume (K Unit) Forecast, by Application 2019 & 2032
- Table 117: South Africa Injectable Drugs Market Revenue (Million) Forecast, by Application 2019 & 2032
- Table 118: South Africa Injectable Drugs Market Volume (K Unit) Forecast, by Application 2019 & 2032
- Table 119: Rest of Middle East and Africa Injectable Drugs Market Revenue (Million) Forecast, by Application 2019 & 2032
- Table 120: Rest of Middle East and Africa Injectable Drugs Market Volume (K Unit) Forecast, by Application 2019 & 2032
- Table 121: Global Injectable Drugs Market Revenue Million Forecast, by Molecule Type 2019 & 2032
- Table 122: Global Injectable Drugs Market Volume K Unit Forecast, by Molecule Type 2019 & 2032
- Table 123: Global Injectable Drugs Market Revenue Million Forecast, by Application 2019 & 2032
- Table 124: Global Injectable Drugs Market Volume K Unit Forecast, by Application 2019 & 2032
- Table 125: Global Injectable Drugs Market Revenue Million Forecast, by Country 2019 & 2032
- Table 126: Global Injectable Drugs Market Volume K Unit Forecast, by Country 2019 & 2032
- Table 127: Brazil Injectable Drugs Market Revenue (Million) Forecast, by Application 2019 & 2032
- Table 128: Brazil Injectable Drugs Market Volume (K Unit) Forecast, by Application 2019 & 2032
- Table 129: Argentina Injectable Drugs Market Revenue (Million) Forecast, by Application 2019 & 2032
- Table 130: Argentina Injectable Drugs Market Volume (K Unit) Forecast, by Application 2019 & 2032
- Table 131: Rest of South America Injectable Drugs Market Revenue (Million) Forecast, by Application 2019 & 2032
- Table 132: Rest of South America Injectable Drugs Market Volume (K Unit) Forecast, by Application 2019 & 2032
Frequently Asked Questions
1. What is the projected Compound Annual Growth Rate (CAGR) of the Injectable Drugs Market?
The projected CAGR is approximately 7.55%.
2. Which companies are prominent players in the Injectable Drugs Market?
Key companies in the market include Sanofi SA, Novo Nordisk AS, Novartis AG, Amgen Inc, Merck & Co Inc, F Hoffmann-La Roche Ltd, AbbVie, Johnson & Johnson, Baxter International Inc, Gilead Sciences Inc, GlaxoSmithKline PLC, Pfizer Inc.
3. What are the main segments of the Injectable Drugs Market?
The market segments include Molecule Type, Application.
4. Can you provide details about the market size?
The market size is estimated to be USD 569.89 Million as of 2022.
5. What are some drivers contributing to market growth?
Rising R&D Focus on the Development of Biotechnology-engineered Anti-cancer Drugs; Rapid Growth in the Usage of Pre-filled Syringes for Biologics; Increased Outsourcing Activities Across Value Chain Expected to Boost Supply of Injectable Products.
6. What are the notable trends driving market growth?
Oncology Is Expected to Have Significant Market Share During the Forecast Period.
7. Are there any restraints impacting market growth?
High Expenses Associated with Inventory Management; Availability of Alternate Drug Delivery Methods.
8. Can you provide examples of recent developments in the market?
In November 2022, the Food and Drug Administration approved tremelimumab in combination with durvalumab and platinum-based chemotherapy for adult patients with metastatic non-small cell lung cancer (NSCLC).
9. What pricing options are available for accessing the report?
Pricing options include single-user, multi-user, and enterprise licenses priced at USD 4750, USD 5250, and USD 8750 respectively.
10. Is the market size provided in terms of value or volume?
The market size is provided in terms of value, measured in Million and volume, measured in K Unit.
11. Are there any specific market keywords associated with the report?
Yes, the market keyword associated with the report is "Injectable Drugs Market," which aids in identifying and referencing the specific market segment covered.
12. How do I determine which pricing option suits my needs best?
The pricing options vary based on user requirements and access needs. Individual users may opt for single-user licenses, while businesses requiring broader access may choose multi-user or enterprise licenses for cost-effective access to the report.
13. Are there any additional resources or data provided in the Injectable Drugs Market report?
While the report offers comprehensive insights, it's advisable to review the specific contents or supplementary materials provided to ascertain if additional resources or data are available.
14. How can I stay updated on further developments or reports in the Injectable Drugs Market?
To stay informed about further developments, trends, and reports in the Injectable Drugs Market, consider subscribing to industry newsletters, following relevant companies and organizations, or regularly checking reputable industry news sources and publications.
Methodology
Step 1 - Identification of Relevant Samples Size from Population Database


Step 2 - Approaches for Defining Global Market Size (Value, Volume* & Price*)

Note*: In applicable scenarios
Step 3 - Data Sources
Primary Research
- Web Analytics
- Survey Reports
- Research Institute
- Latest Research Reports
- Opinion Leaders
Secondary Research
- Annual Reports
- White Paper
- Latest Press Release
- Industry Association
- Paid Database
- Investor Presentations

Step 4 - Data Triangulation
Involves using different sources of information in order to increase the validity of a study
These sources are likely to be stakeholders in a program - participants, other researchers, program staff, other community members, and so on.
Then we put all data in single framework & apply various statistical tools to find out the dynamic on the market.
During the analysis stage, feedback from the stakeholder groups would be compared to determine areas of agreement as well as areas of divergence
