

Key Insights
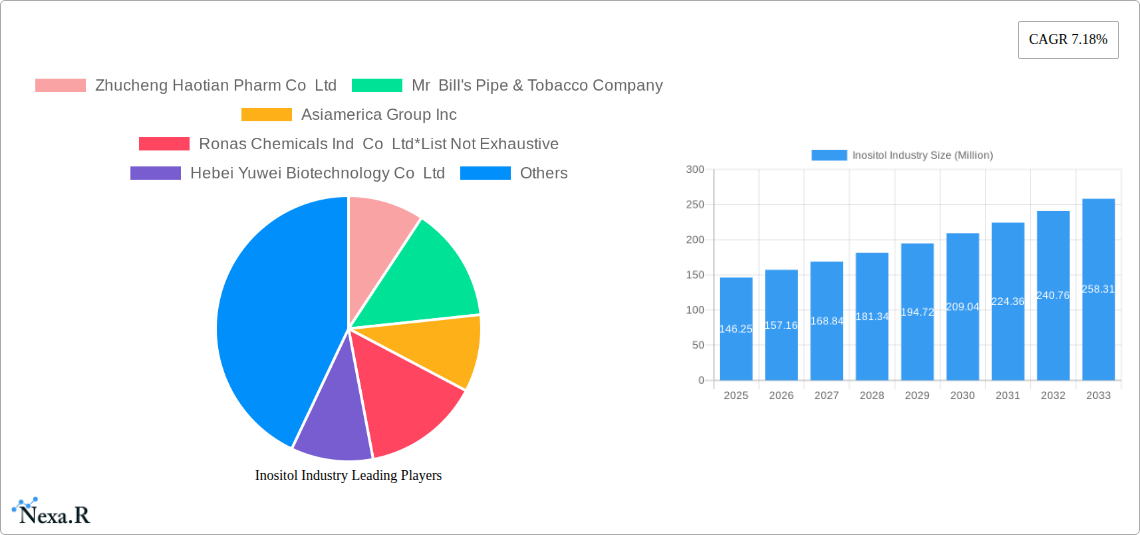
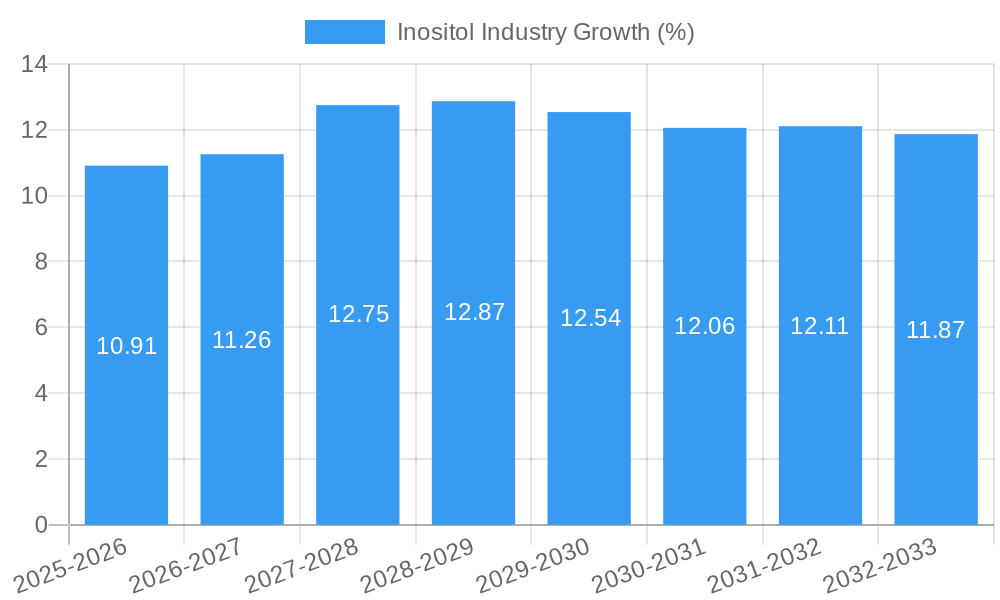
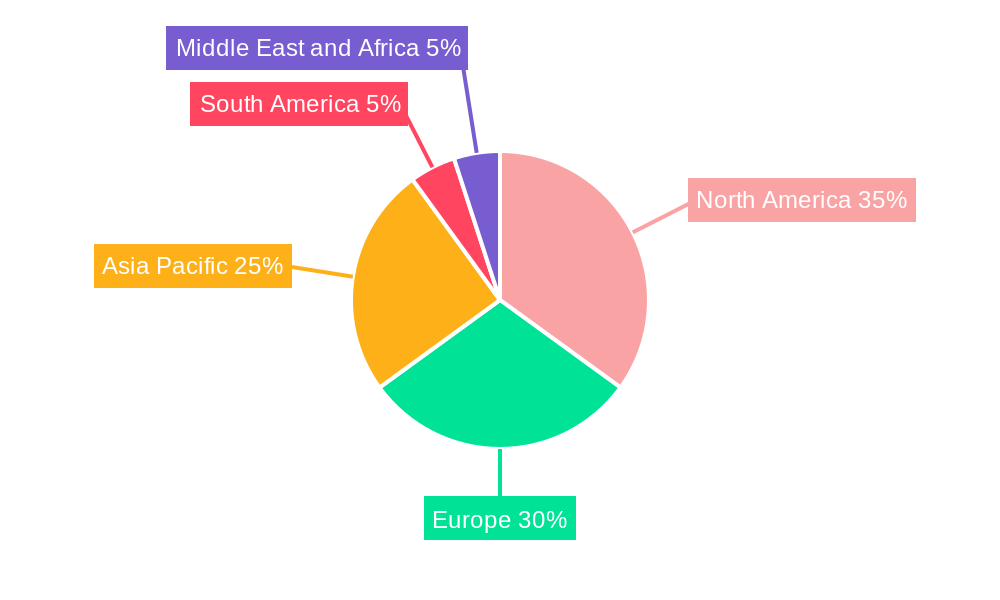
The global inositol market, valued at $146.25 million in 2025, is projected to experience robust growth, driven by increasing demand across diverse applications. The compound annual growth rate (CAGR) of 7.18% from 2025 to 2033 indicates a significant expansion potential. Key drivers include the rising popularity of plant-based diets and dietary supplements containing inositol, which is known for its potential cognitive benefits and role in managing metabolic disorders. The burgeoning pharmaceutical and feed industries also contribute significantly to market growth, utilizing inositol in various formulations and animal feed supplements. The market is segmented by application (dietary supplements, beverages, feed industry, pharmaceuticals, and others) and source (plant-based and synthetic). Plant-based inositol is gaining traction due to growing consumer preference for natural ingredients. However, the market might face restraints from fluctuating raw material prices and the emergence of alternative nutritional supplements. North America and Europe currently hold significant market shares, driven by high consumer awareness and established health and wellness markets. However, rapidly growing economies in Asia-Pacific are expected to fuel substantial growth in the coming years. Competition within the inositol market is moderately intense, with several key players including Zhucheng Haotian Pharm Co Ltd, Koninklijke DSM NV, and others vying for market share through product innovation and expansion into new geographical areas.
The forecast period (2025-2033) anticipates continued market expansion. Factors such as increasing scientific research highlighting the health benefits of inositol and rising disposable incomes in developing nations will contribute to higher demand. The market’s segmentation strategy will likely evolve to cater to the specific needs of different applications, resulting in specialized product offerings and targeted marketing campaigns. Companies are likely to invest in research and development to enhance product efficacy and explore new applications for inositol. This focus on innovation will be crucial in maintaining a competitive edge and capturing a larger share of the growing global market. Furthermore, strategic partnerships and mergers and acquisitions will likely play a significant role in shaping the industry landscape.
Inositol Industry Market Report: 2019-2033
This comprehensive report provides a detailed analysis of the Inositol industry, encompassing market dynamics, growth trends, regional dominance, product landscape, key players, and future outlook. With a focus on both parent and child markets, this report is an essential resource for industry professionals, investors, and anyone seeking a deep understanding of this dynamic sector. The study period covers 2019-2033, with a base year of 2025 and a forecast period of 2025-2033. The report utilizes data from the historical period of 2019-2024 and projects values in million units.
Inositol Industry Market Dynamics & Structure
The Inositol market, segmented by application (Dietary Supplement, Beverage, Feed Industry, Pharmaceutical Industry, Other Applications) and source (Plant-based Inositol, Synthetic Inositol), exhibits a moderately consolidated structure. Market concentration is influenced by a mix of established players and emerging businesses, with xx% market share held by the top five companies in 2024. Technological innovation, primarily focused on improving extraction methods and product purity, is a key driver, along with increasing demand from the dietary supplement and pharmaceutical sectors. Stringent regulatory frameworks governing food and pharmaceutical additives influence market dynamics. Competitive product substitutes, such as other nutritional supplements, pose a challenge. End-user demographics are shifting towards health-conscious consumers fueling demand. M&A activity in the sector has been moderate in recent years, with xx deals recorded between 2019 and 2024.
- Market Concentration: Moderately consolidated, top 5 companies holding xx% market share in 2024.
- Technological Innovation: Focus on improved extraction and purity.
- Regulatory Framework: Stringent regulations for food and pharmaceutical applications.
- Competitive Substitutes: Other nutritional supplements.
- End-User Demographics: Growing health-conscious consumer base.
- M&A Activity: xx deals between 2019 and 2024.
- Innovation Barriers: High R&D costs, complex regulatory approvals.
Inositol Industry Growth Trends & Insights
The Inositol market experienced significant growth during the historical period (2019-2024), with a CAGR of xx%. This growth is attributed to rising consumer awareness of the health benefits of inositol, particularly in relation to mood regulation and PCOS management. The market size reached xx million units in 2024 and is projected to reach xx million units by 2033, demonstrating a continued upward trend. Technological advancements, such as improved extraction techniques and the development of novel formulations, are further accelerating market growth. Consumer behavior shifts towards natural and functional foods and supplements are also driving adoption. Market penetration in key segments, such as dietary supplements, is expected to increase significantly over the forecast period, resulting in a projected CAGR of xx% between 2025 and 2033. Disruptions from emerging technologies like personalized nutrition are anticipated to further reshape market dynamics.
Dominant Regions, Countries, or Segments in Inositol Industry
The North American market currently holds the largest market share in the Inositol industry, driven by high consumer demand for dietary supplements and a strong pharmaceutical sector. However, the Asia-Pacific region is expected to exhibit the fastest growth rate during the forecast period, fueled by increasing disposable incomes and rising health awareness in countries like China and India. Within the application segments, the Dietary Supplement segment dominates, accounting for xx% of the market in 2024, driven by its use in managing various health conditions. The Pharmaceutical industry segment is also experiencing robust growth, driven by increased research and development in the field of inositol-based medications.
- Key Drivers (North America): Strong consumer demand for dietary supplements, well-established pharmaceutical industry.
- Key Drivers (Asia-Pacific): Rising disposable incomes, increasing health awareness.
- Dominant Segment: Dietary Supplements (xx% market share in 2024).
- Fastest-Growing Segment: Pharmaceutical Industry.
- Market Share: North America (xx%), Asia-Pacific (xx%), Europe (xx%), Rest of World (xx%)
Inositol Industry Product Landscape
The Inositol market offers a range of products, primarily differentiated by source (plant-based or synthetic) and purity level. Recent innovations focus on developing more bioavailable and easily absorbed forms of inositol, along with formulations tailored to specific health applications. The unique selling propositions frequently emphasize purity, source, and the inclusion of other complementary nutrients. Technological advancements are improving extraction processes and creating customized blends to address particular health concerns, leading to enhanced product performance and efficacy.
Key Drivers, Barriers & Challenges in Inositol Industry
Key Drivers:
- Growing awareness of inositol's health benefits.
- Increased demand for natural and functional food products.
- Rising prevalence of conditions such as PCOS and anxiety disorders.
- Advancements in extraction technologies and formulation development.
Challenges & Restraints:
- Fluctuations in raw material prices (plant-based inositol).
- Stringent regulatory approvals for pharmaceutical applications.
- Competition from other nutritional supplements.
- Potential supply chain disruptions.
Emerging Opportunities in Inositol Industry
Emerging opportunities lie in expanding into untapped markets, particularly in developing countries with growing health-conscious populations. Innovative applications, such as incorporating inositol into functional foods and beverages, are also gaining traction. Evolving consumer preferences towards personalized nutrition and targeted supplement formulations create significant potential for growth. Research into new health benefits of inositol can unlock new market segments.
Growth Accelerators in the Inositol Industry
Technological breakthroughs in extraction and purification techniques will significantly reduce production costs and improve product quality. Strategic partnerships between inositol manufacturers and healthcare providers will enhance market penetration and product reach. Expansion into new geographical markets, especially in developing countries, will unlock significant growth opportunities.
Key Players Shaping the Inositol Industry Market
- Zhucheng Haotian Pharm Co Ltd
- Mr Bill's Pipe & Tobacco Company
- Asiamerica Group Inc
- Ronas Chemicals Ind Co Ltd
- Hebei Yuwei Biotechnology Co Ltd
- Charles Bowman & Company
- Koninklijke DSM NV
- Shandong Runde Biotechnology Co
- T J Clark & Company
- Jingkai Biotechnology
Notable Milestones in Inositol Industry Sector
- March 2023: MD Logic Health launched "Inositol by Cynthia Thurlow," a physician-recommended dietary supplement.
- March 2023: Veera Wellness launched VeeVital PCOS support, featuring a clinically studied dose of Myo-inositol.
- February 2023: Pro360 launched its FemCare+ and HPHF product lines, incorporating myoinositol.
In-Depth Inositol Industry Market Outlook
The Inositol market is poised for substantial growth over the next decade, driven by increasing consumer awareness, technological advancements, and the expansion of its application in diverse sectors. Strategic partnerships, focusing on R&D, and the development of novel formulations will accelerate market expansion. Untapped markets and evolving consumer needs present exciting opportunities for innovative businesses to capture market share. The long-term outlook is positive, projecting strong growth and significant market potential.
Inositol Industry Segmentation
-
1. Source
- 1.1. Plant-based Inositol
- 1.2. Synthetic Inositol
-
2. Application
- 2.1. Dietary Supplement
- 2.2. Beverage
- 2.3. Feed Industry
- 2.4. Pharmaceutical Industry
- 2.5. Other Applications
Inositol Industry Segmentation By Geography
-
1. North America
- 1.1. United States
- 1.2. Canada
- 1.3. Mexico
- 1.4. Rest of North America
-
2. Europe
- 2.1. United Kingdom
- 2.2. Germany
- 2.3. France
- 2.4. Russia
- 2.5. Italy
- 2.6. Spain
- 2.7. Rest of Europe
-
3. Asia Pacific
- 3.1. India
- 3.2. China
- 3.3. Japan
- 3.4. Australia
- 3.5. Rest of Asia Pacific
-
4. South America
- 4.1. Brazil
- 4.2. Argentina
- 4.3. Rest of South America
-
5. Middle East and Africa
- 5.1. South Africa
- 5.2. Saudi Arabia
- 5.3. Rest of Middle East and Africa
Inositol Industry REPORT HIGHLIGHTS
| Aspects | Details |
|---|---|
| Study Period | 2019-2033 |
| Base Year | 2024 |
| Estimated Year | 2025 |
| Forecast Period | 2025-2033 |
| Historical Period | 2019-2024 |
| Growth Rate | CAGR of 7.18% from 2019-2033 |
| Segmentation |
|
Table of Contents
- 1. Introduction
- 1.1. Research Scope
- 1.2. Market Segmentation
- 1.3. Research Methodology
- 1.4. Definitions and Assumptions
- 2. Executive Summary
- 2.1. Introduction
- 3. Market Dynamics
- 3.1. Introduction
- 3.2. Market Drivers
- 3.2.1. Increasing Demand for Clean Label Bakery Products; Increasing Popularity of Specialty Ingredients
- 3.3. Market Restrains
- 3.3.1. Risk of Allergies
- 3.4. Market Trends
- 3.4.1. Increasing Demand for Inositol in Pharmaceutical Industry
- 4. Market Factor Analysis
- 4.1. Porters Five Forces
- 4.2. Supply/Value Chain
- 4.3. PESTEL analysis
- 4.4. Market Entropy
- 4.5. Patent/Trademark Analysis
- 5. Global Inositol Industry Analysis, Insights and Forecast, 2019-2031
- 5.1. Market Analysis, Insights and Forecast - by Source
- 5.1.1. Plant-based Inositol
- 5.1.2. Synthetic Inositol
- 5.2. Market Analysis, Insights and Forecast - by Application
- 5.2.1. Dietary Supplement
- 5.2.2. Beverage
- 5.2.3. Feed Industry
- 5.2.4. Pharmaceutical Industry
- 5.2.5. Other Applications
- 5.3. Market Analysis, Insights and Forecast - by Region
- 5.3.1. North America
- 5.3.2. Europe
- 5.3.3. Asia Pacific
- 5.3.4. South America
- 5.3.5. Middle East and Africa
- 5.1. Market Analysis, Insights and Forecast - by Source
- 6. North America Inositol Industry Analysis, Insights and Forecast, 2019-2031
- 6.1. Market Analysis, Insights and Forecast - by Source
- 6.1.1. Plant-based Inositol
- 6.1.2. Synthetic Inositol
- 6.2. Market Analysis, Insights and Forecast - by Application
- 6.2.1. Dietary Supplement
- 6.2.2. Beverage
- 6.2.3. Feed Industry
- 6.2.4. Pharmaceutical Industry
- 6.2.5. Other Applications
- 6.1. Market Analysis, Insights and Forecast - by Source
- 7. Europe Inositol Industry Analysis, Insights and Forecast, 2019-2031
- 7.1. Market Analysis, Insights and Forecast - by Source
- 7.1.1. Plant-based Inositol
- 7.1.2. Synthetic Inositol
- 7.2. Market Analysis, Insights and Forecast - by Application
- 7.2.1. Dietary Supplement
- 7.2.2. Beverage
- 7.2.3. Feed Industry
- 7.2.4. Pharmaceutical Industry
- 7.2.5. Other Applications
- 7.1. Market Analysis, Insights and Forecast - by Source
- 8. Asia Pacific Inositol Industry Analysis, Insights and Forecast, 2019-2031
- 8.1. Market Analysis, Insights and Forecast - by Source
- 8.1.1. Plant-based Inositol
- 8.1.2. Synthetic Inositol
- 8.2. Market Analysis, Insights and Forecast - by Application
- 8.2.1. Dietary Supplement
- 8.2.2. Beverage
- 8.2.3. Feed Industry
- 8.2.4. Pharmaceutical Industry
- 8.2.5. Other Applications
- 8.1. Market Analysis, Insights and Forecast - by Source
- 9. South America Inositol Industry Analysis, Insights and Forecast, 2019-2031
- 9.1. Market Analysis, Insights and Forecast - by Source
- 9.1.1. Plant-based Inositol
- 9.1.2. Synthetic Inositol
- 9.2. Market Analysis, Insights and Forecast - by Application
- 9.2.1. Dietary Supplement
- 9.2.2. Beverage
- 9.2.3. Feed Industry
- 9.2.4. Pharmaceutical Industry
- 9.2.5. Other Applications
- 9.1. Market Analysis, Insights and Forecast - by Source
- 10. Middle East and Africa Inositol Industry Analysis, Insights and Forecast, 2019-2031
- 10.1. Market Analysis, Insights and Forecast - by Source
- 10.1.1. Plant-based Inositol
- 10.1.2. Synthetic Inositol
- 10.2. Market Analysis, Insights and Forecast - by Application
- 10.2.1. Dietary Supplement
- 10.2.2. Beverage
- 10.2.3. Feed Industry
- 10.2.4. Pharmaceutical Industry
- 10.2.5. Other Applications
- 10.1. Market Analysis, Insights and Forecast - by Source
- 11. North America Inositol Industry Analysis, Insights and Forecast, 2019-2031
- 11.1. Market Analysis, Insights and Forecast - By Country/Sub-region
- 11.1.1 United States
- 11.1.2 Canada
- 11.1.3 Mexico
- 11.1.4 Rest of North America
- 12. Europe Inositol Industry Analysis, Insights and Forecast, 2019-2031
- 12.1. Market Analysis, Insights and Forecast - By Country/Sub-region
- 12.1.1 United Kingdom
- 12.1.2 Germany
- 12.1.3 France
- 12.1.4 Russia
- 12.1.5 Italy
- 12.1.6 Spain
- 12.1.7 Rest of Europe
- 13. Asia Pacific Inositol Industry Analysis, Insights and Forecast, 2019-2031
- 13.1. Market Analysis, Insights and Forecast - By Country/Sub-region
- 13.1.1 India
- 13.1.2 China
- 13.1.3 Japan
- 13.1.4 Australia
- 13.1.5 Rest of Asia Pacific
- 14. South America Inositol Industry Analysis, Insights and Forecast, 2019-2031
- 14.1. Market Analysis, Insights and Forecast - By Country/Sub-region
- 14.1.1 Brazil
- 14.1.2 Argentina
- 14.1.3 Rest of South America
- 15. Middle East and Africa Inositol Industry Analysis, Insights and Forecast, 2019-2031
- 15.1. Market Analysis, Insights and Forecast - By Country/Sub-region
- 15.1.1 South Africa
- 15.1.2 Saudi Arabia
- 15.1.3 Rest of Middle East and Africa
- 16. Competitive Analysis
- 16.1. Global Market Share Analysis 2024
- 16.2. Company Profiles
- 16.2.1 Zhucheng Haotian Pharm Co Ltd
- 16.2.1.1. Overview
- 16.2.1.2. Products
- 16.2.1.3. SWOT Analysis
- 16.2.1.4. Recent Developments
- 16.2.1.5. Financials (Based on Availability)
- 16.2.2 Mr Bill's Pipe & Tobacco Company
- 16.2.2.1. Overview
- 16.2.2.2. Products
- 16.2.2.3. SWOT Analysis
- 16.2.2.4. Recent Developments
- 16.2.2.5. Financials (Based on Availability)
- 16.2.3 Asiamerica Group Inc
- 16.2.3.1. Overview
- 16.2.3.2. Products
- 16.2.3.3. SWOT Analysis
- 16.2.3.4. Recent Developments
- 16.2.3.5. Financials (Based on Availability)
- 16.2.4 Ronas Chemicals Ind Co Ltd*List Not Exhaustive
- 16.2.4.1. Overview
- 16.2.4.2. Products
- 16.2.4.3. SWOT Analysis
- 16.2.4.4. Recent Developments
- 16.2.4.5. Financials (Based on Availability)
- 16.2.5 Hebei Yuwei Biotechnology Co Ltd
- 16.2.5.1. Overview
- 16.2.5.2. Products
- 16.2.5.3. SWOT Analysis
- 16.2.5.4. Recent Developments
- 16.2.5.5. Financials (Based on Availability)
- 16.2.6 Charles Bowman & Company
- 16.2.6.1. Overview
- 16.2.6.2. Products
- 16.2.6.3. SWOT Analysis
- 16.2.6.4. Recent Developments
- 16.2.6.5. Financials (Based on Availability)
- 16.2.7 Koninklijke DSM NV
- 16.2.7.1. Overview
- 16.2.7.2. Products
- 16.2.7.3. SWOT Analysis
- 16.2.7.4. Recent Developments
- 16.2.7.5. Financials (Based on Availability)
- 16.2.8 Shandong Runde Biotechnology Co
- 16.2.8.1. Overview
- 16.2.8.2. Products
- 16.2.8.3. SWOT Analysis
- 16.2.8.4. Recent Developments
- 16.2.8.5. Financials (Based on Availability)
- 16.2.9 T J Clark & Company
- 16.2.9.1. Overview
- 16.2.9.2. Products
- 16.2.9.3. SWOT Analysis
- 16.2.9.4. Recent Developments
- 16.2.9.5. Financials (Based on Availability)
- 16.2.10 Jingkai Biotechnology
- 16.2.10.1. Overview
- 16.2.10.2. Products
- 16.2.10.3. SWOT Analysis
- 16.2.10.4. Recent Developments
- 16.2.10.5. Financials (Based on Availability)
- 16.2.1 Zhucheng Haotian Pharm Co Ltd
List of Figures
- Figure 1: Global Inositol Industry Revenue Breakdown (Million, %) by Region 2024 & 2032
- Figure 2: North America Inositol Industry Revenue (Million), by Country 2024 & 2032
- Figure 3: North America Inositol Industry Revenue Share (%), by Country 2024 & 2032
- Figure 4: Europe Inositol Industry Revenue (Million), by Country 2024 & 2032
- Figure 5: Europe Inositol Industry Revenue Share (%), by Country 2024 & 2032
- Figure 6: Asia Pacific Inositol Industry Revenue (Million), by Country 2024 & 2032
- Figure 7: Asia Pacific Inositol Industry Revenue Share (%), by Country 2024 & 2032
- Figure 8: South America Inositol Industry Revenue (Million), by Country 2024 & 2032
- Figure 9: South America Inositol Industry Revenue Share (%), by Country 2024 & 2032
- Figure 10: Middle East and Africa Inositol Industry Revenue (Million), by Country 2024 & 2032
- Figure 11: Middle East and Africa Inositol Industry Revenue Share (%), by Country 2024 & 2032
- Figure 12: North America Inositol Industry Revenue (Million), by Source 2024 & 2032
- Figure 13: North America Inositol Industry Revenue Share (%), by Source 2024 & 2032
- Figure 14: North America Inositol Industry Revenue (Million), by Application 2024 & 2032
- Figure 15: North America Inositol Industry Revenue Share (%), by Application 2024 & 2032
- Figure 16: North America Inositol Industry Revenue (Million), by Country 2024 & 2032
- Figure 17: North America Inositol Industry Revenue Share (%), by Country 2024 & 2032
- Figure 18: Europe Inositol Industry Revenue (Million), by Source 2024 & 2032
- Figure 19: Europe Inositol Industry Revenue Share (%), by Source 2024 & 2032
- Figure 20: Europe Inositol Industry Revenue (Million), by Application 2024 & 2032
- Figure 21: Europe Inositol Industry Revenue Share (%), by Application 2024 & 2032
- Figure 22: Europe Inositol Industry Revenue (Million), by Country 2024 & 2032
- Figure 23: Europe Inositol Industry Revenue Share (%), by Country 2024 & 2032
- Figure 24: Asia Pacific Inositol Industry Revenue (Million), by Source 2024 & 2032
- Figure 25: Asia Pacific Inositol Industry Revenue Share (%), by Source 2024 & 2032
- Figure 26: Asia Pacific Inositol Industry Revenue (Million), by Application 2024 & 2032
- Figure 27: Asia Pacific Inositol Industry Revenue Share (%), by Application 2024 & 2032
- Figure 28: Asia Pacific Inositol Industry Revenue (Million), by Country 2024 & 2032
- Figure 29: Asia Pacific Inositol Industry Revenue Share (%), by Country 2024 & 2032
- Figure 30: South America Inositol Industry Revenue (Million), by Source 2024 & 2032
- Figure 31: South America Inositol Industry Revenue Share (%), by Source 2024 & 2032
- Figure 32: South America Inositol Industry Revenue (Million), by Application 2024 & 2032
- Figure 33: South America Inositol Industry Revenue Share (%), by Application 2024 & 2032
- Figure 34: South America Inositol Industry Revenue (Million), by Country 2024 & 2032
- Figure 35: South America Inositol Industry Revenue Share (%), by Country 2024 & 2032
- Figure 36: Middle East and Africa Inositol Industry Revenue (Million), by Source 2024 & 2032
- Figure 37: Middle East and Africa Inositol Industry Revenue Share (%), by Source 2024 & 2032
- Figure 38: Middle East and Africa Inositol Industry Revenue (Million), by Application 2024 & 2032
- Figure 39: Middle East and Africa Inositol Industry Revenue Share (%), by Application 2024 & 2032
- Figure 40: Middle East and Africa Inositol Industry Revenue (Million), by Country 2024 & 2032
- Figure 41: Middle East and Africa Inositol Industry Revenue Share (%), by Country 2024 & 2032
List of Tables
- Table 1: Global Inositol Industry Revenue Million Forecast, by Region 2019 & 2032
- Table 2: Global Inositol Industry Revenue Million Forecast, by Source 2019 & 2032
- Table 3: Global Inositol Industry Revenue Million Forecast, by Application 2019 & 2032
- Table 4: Global Inositol Industry Revenue Million Forecast, by Region 2019 & 2032
- Table 5: Global Inositol Industry Revenue Million Forecast, by Country 2019 & 2032
- Table 6: United States Inositol Industry Revenue (Million) Forecast, by Application 2019 & 2032
- Table 7: Canada Inositol Industry Revenue (Million) Forecast, by Application 2019 & 2032
- Table 8: Mexico Inositol Industry Revenue (Million) Forecast, by Application 2019 & 2032
- Table 9: Rest of North America Inositol Industry Revenue (Million) Forecast, by Application 2019 & 2032
- Table 10: Global Inositol Industry Revenue Million Forecast, by Country 2019 & 2032
- Table 11: United Kingdom Inositol Industry Revenue (Million) Forecast, by Application 2019 & 2032
- Table 12: Germany Inositol Industry Revenue (Million) Forecast, by Application 2019 & 2032
- Table 13: France Inositol Industry Revenue (Million) Forecast, by Application 2019 & 2032
- Table 14: Russia Inositol Industry Revenue (Million) Forecast, by Application 2019 & 2032
- Table 15: Italy Inositol Industry Revenue (Million) Forecast, by Application 2019 & 2032
- Table 16: Spain Inositol Industry Revenue (Million) Forecast, by Application 2019 & 2032
- Table 17: Rest of Europe Inositol Industry Revenue (Million) Forecast, by Application 2019 & 2032
- Table 18: Global Inositol Industry Revenue Million Forecast, by Country 2019 & 2032
- Table 19: India Inositol Industry Revenue (Million) Forecast, by Application 2019 & 2032
- Table 20: China Inositol Industry Revenue (Million) Forecast, by Application 2019 & 2032
- Table 21: Japan Inositol Industry Revenue (Million) Forecast, by Application 2019 & 2032
- Table 22: Australia Inositol Industry Revenue (Million) Forecast, by Application 2019 & 2032
- Table 23: Rest of Asia Pacific Inositol Industry Revenue (Million) Forecast, by Application 2019 & 2032
- Table 24: Global Inositol Industry Revenue Million Forecast, by Country 2019 & 2032
- Table 25: Brazil Inositol Industry Revenue (Million) Forecast, by Application 2019 & 2032
- Table 26: Argentina Inositol Industry Revenue (Million) Forecast, by Application 2019 & 2032
- Table 27: Rest of South America Inositol Industry Revenue (Million) Forecast, by Application 2019 & 2032
- Table 28: Global Inositol Industry Revenue Million Forecast, by Country 2019 & 2032
- Table 29: South Africa Inositol Industry Revenue (Million) Forecast, by Application 2019 & 2032
- Table 30: Saudi Arabia Inositol Industry Revenue (Million) Forecast, by Application 2019 & 2032
- Table 31: Rest of Middle East and Africa Inositol Industry Revenue (Million) Forecast, by Application 2019 & 2032
- Table 32: Global Inositol Industry Revenue Million Forecast, by Source 2019 & 2032
- Table 33: Global Inositol Industry Revenue Million Forecast, by Application 2019 & 2032
- Table 34: Global Inositol Industry Revenue Million Forecast, by Country 2019 & 2032
- Table 35: United States Inositol Industry Revenue (Million) Forecast, by Application 2019 & 2032
- Table 36: Canada Inositol Industry Revenue (Million) Forecast, by Application 2019 & 2032
- Table 37: Mexico Inositol Industry Revenue (Million) Forecast, by Application 2019 & 2032
- Table 38: Rest of North America Inositol Industry Revenue (Million) Forecast, by Application 2019 & 2032
- Table 39: Global Inositol Industry Revenue Million Forecast, by Source 2019 & 2032
- Table 40: Global Inositol Industry Revenue Million Forecast, by Application 2019 & 2032
- Table 41: Global Inositol Industry Revenue Million Forecast, by Country 2019 & 2032
- Table 42: United Kingdom Inositol Industry Revenue (Million) Forecast, by Application 2019 & 2032
- Table 43: Germany Inositol Industry Revenue (Million) Forecast, by Application 2019 & 2032
- Table 44: France Inositol Industry Revenue (Million) Forecast, by Application 2019 & 2032
- Table 45: Russia Inositol Industry Revenue (Million) Forecast, by Application 2019 & 2032
- Table 46: Italy Inositol Industry Revenue (Million) Forecast, by Application 2019 & 2032
- Table 47: Spain Inositol Industry Revenue (Million) Forecast, by Application 2019 & 2032
- Table 48: Rest of Europe Inositol Industry Revenue (Million) Forecast, by Application 2019 & 2032
- Table 49: Global Inositol Industry Revenue Million Forecast, by Source 2019 & 2032
- Table 50: Global Inositol Industry Revenue Million Forecast, by Application 2019 & 2032
- Table 51: Global Inositol Industry Revenue Million Forecast, by Country 2019 & 2032
- Table 52: India Inositol Industry Revenue (Million) Forecast, by Application 2019 & 2032
- Table 53: China Inositol Industry Revenue (Million) Forecast, by Application 2019 & 2032
- Table 54: Japan Inositol Industry Revenue (Million) Forecast, by Application 2019 & 2032
- Table 55: Australia Inositol Industry Revenue (Million) Forecast, by Application 2019 & 2032
- Table 56: Rest of Asia Pacific Inositol Industry Revenue (Million) Forecast, by Application 2019 & 2032
- Table 57: Global Inositol Industry Revenue Million Forecast, by Source 2019 & 2032
- Table 58: Global Inositol Industry Revenue Million Forecast, by Application 2019 & 2032
- Table 59: Global Inositol Industry Revenue Million Forecast, by Country 2019 & 2032
- Table 60: Brazil Inositol Industry Revenue (Million) Forecast, by Application 2019 & 2032
- Table 61: Argentina Inositol Industry Revenue (Million) Forecast, by Application 2019 & 2032
- Table 62: Rest of South America Inositol Industry Revenue (Million) Forecast, by Application 2019 & 2032
- Table 63: Global Inositol Industry Revenue Million Forecast, by Source 2019 & 2032
- Table 64: Global Inositol Industry Revenue Million Forecast, by Application 2019 & 2032
- Table 65: Global Inositol Industry Revenue Million Forecast, by Country 2019 & 2032
- Table 66: South Africa Inositol Industry Revenue (Million) Forecast, by Application 2019 & 2032
- Table 67: Saudi Arabia Inositol Industry Revenue (Million) Forecast, by Application 2019 & 2032
- Table 68: Rest of Middle East and Africa Inositol Industry Revenue (Million) Forecast, by Application 2019 & 2032
Frequently Asked Questions
1. What is the projected Compound Annual Growth Rate (CAGR) of the Inositol Industry?
The projected CAGR is approximately 7.18%.
2. Which companies are prominent players in the Inositol Industry?
Key companies in the market include Zhucheng Haotian Pharm Co Ltd, Mr Bill's Pipe & Tobacco Company, Asiamerica Group Inc, Ronas Chemicals Ind Co Ltd*List Not Exhaustive, Hebei Yuwei Biotechnology Co Ltd, Charles Bowman & Company, Koninklijke DSM NV, Shandong Runde Biotechnology Co, T J Clark & Company, Jingkai Biotechnology.
3. What are the main segments of the Inositol Industry?
The market segments include Source, Application.
4. Can you provide details about the market size?
The market size is estimated to be USD 146.25 Million as of 2022.
5. What are some drivers contributing to market growth?
Increasing Demand for Clean Label Bakery Products; Increasing Popularity of Specialty Ingredients.
6. What are the notable trends driving market growth?
Increasing Demand for Inositol in Pharmaceutical Industry.
7. Are there any restraints impacting market growth?
Risk of Allergies.
8. Can you provide examples of recent developments in the market?
In March 2023, MD Logic Health, a leading provider of USA-made professional-grade nutraceuticals and physician-recommended dietary supplements, announced its second collaboration with Cynthia Thurlow, NP. The latest product developed under this collaboration is Inositol by Cynthia Thurlow, powered by MD Logic Health. Myo-inositol, a naturally occurring organic compound produced by the liver and kidney, is crucial in regulating the body's response and hormones associated with mood and cognition.
9. What pricing options are available for accessing the report?
Pricing options include single-user, multi-user, and enterprise licenses priced at USD 4750, USD 5250, and USD 8750 respectively.
10. Is the market size provided in terms of value or volume?
The market size is provided in terms of value, measured in Million.
11. Are there any specific market keywords associated with the report?
Yes, the market keyword associated with the report is "Inositol Industry," which aids in identifying and referencing the specific market segment covered.
12. How do I determine which pricing option suits my needs best?
The pricing options vary based on user requirements and access needs. Individual users may opt for single-user licenses, while businesses requiring broader access may choose multi-user or enterprise licenses for cost-effective access to the report.
13. Are there any additional resources or data provided in the Inositol Industry report?
While the report offers comprehensive insights, it's advisable to review the specific contents or supplementary materials provided to ascertain if additional resources or data are available.
14. How can I stay updated on further developments or reports in the Inositol Industry?
To stay informed about further developments, trends, and reports in the Inositol Industry, consider subscribing to industry newsletters, following relevant companies and organizations, or regularly checking reputable industry news sources and publications.
Methodology
Step 1 - Identification of Relevant Samples Size from Population Database


Step 2 - Approaches for Defining Global Market Size (Value, Volume* & Price*)

Note*: In applicable scenarios
Step 3 - Data Sources
Primary Research
- Web Analytics
- Survey Reports
- Research Institute
- Latest Research Reports
- Opinion Leaders
Secondary Research
- Annual Reports
- White Paper
- Latest Press Release
- Industry Association
- Paid Database
- Investor Presentations

Step 4 - Data Triangulation
Involves using different sources of information in order to increase the validity of a study
These sources are likely to be stakeholders in a program - participants, other researchers, program staff, other community members, and so on.
Then we put all data in single framework & apply various statistical tools to find out the dynamic on the market.
During the analysis stage, feedback from the stakeholder groups would be compared to determine areas of agreement as well as areas of divergence
