

Key Insights
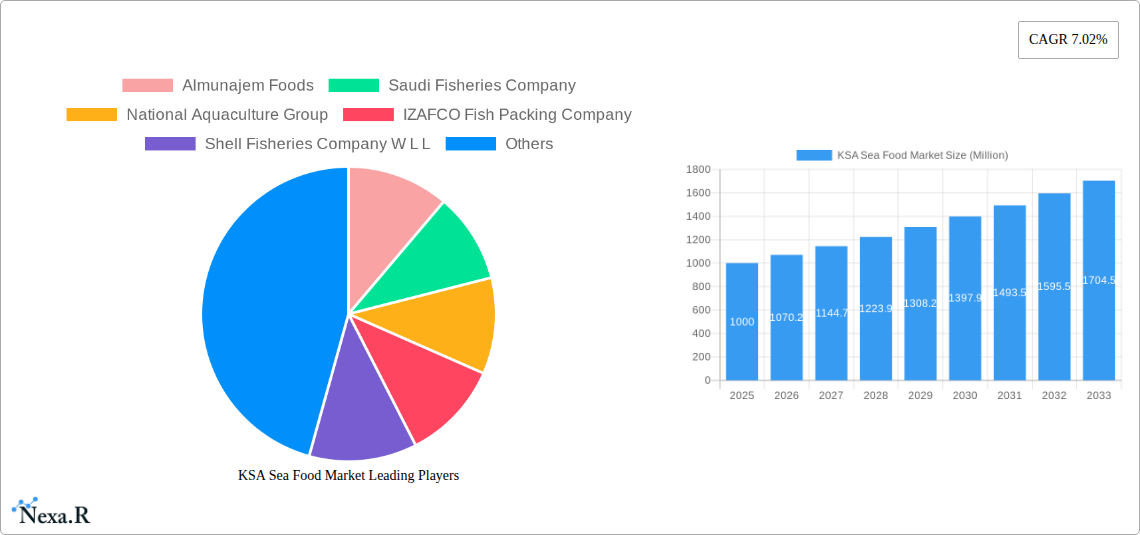
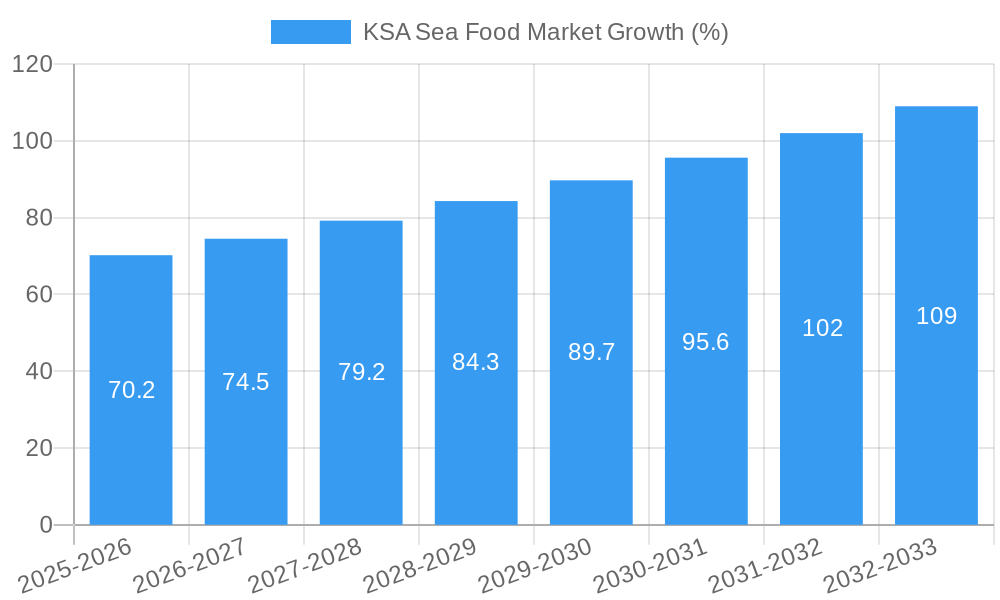
The Kingdom of Saudi Arabia (KSA) seafood market, valued at approximately $1 billion in 2025, is projected to experience robust growth, exhibiting a Compound Annual Growth Rate (CAGR) of 7.02% from 2025 to 2033. This expansion is fueled by several key factors. Rising disposable incomes within the KSA are driving increased consumer spending on premium seafood products, particularly shrimp and fish. A growing preference for healthier dietary options further contributes to this market's dynamism. Furthermore, the government's initiatives to promote sustainable aquaculture and improve seafood supply chain infrastructure are creating a more favorable environment for market growth. The burgeoning tourism sector also plays a crucial role, boosting demand within the on-trade segment (restaurants and hotels). While challenges such as fluctuating global seafood prices and potential supply chain disruptions exist, the overall outlook remains positive, with significant opportunities for both domestic and international players.
The market is segmented by seafood type (fish, shrimp, other seafood), form (canned, fresh/chilled, frozen, processed), and distribution channel (off-trade, on-trade). Frozen seafood currently dominates the market due to its extended shelf life and convenience. However, the demand for fresh and chilled seafood is steadily increasing, indicating a growing preference for quality and freshness. The off-trade segment (supermarkets, hypermarkets) holds a larger market share than the on-trade, but the latter is projected to witness faster growth driven by the expanding food service industry. Key players like Almunajem Foods, Saudi Fisheries Company, and National Aquaculture Group are consolidating their market positions, while smaller regional players focus on niche segments. Geographic expansion within the KSA, particularly targeting underserved regions, presents considerable potential for future market penetration.
KSA Seafood Market: A Comprehensive Market Report (2019-2033)
This comprehensive report provides an in-depth analysis of the Kingdom of Saudi Arabia (KSA) seafood market, encompassing market dynamics, growth trends, key players, and future projections from 2019 to 2033. The report leverages rigorous data analysis and industry insights to offer a holistic view of this dynamic sector, providing invaluable intelligence for businesses operating within or planning to enter the KSA seafood market. The report delves into parent market segments (Seafood) and child market segments (Fish, Shrimp, Other Seafood; Canned, Fresh/Chilled, Frozen, Processed; Off-Trade, On-Trade) providing a granular understanding of market performance across various categories.
KSA Sea Food Market Market Dynamics & Structure
This section analyzes the KSA seafood market's competitive landscape, regulatory environment, and technological advancements impacting the industry. The market is characterized by a mix of large established players and smaller, specialized companies. Market concentration is moderate, with several key players holding significant market share. The report examines the competitive dynamics between these players, including Almunajem Foods, Saudi Fisheries Company, National Aquaculture Group, IZAFCO Fish Packing Company, Shell Fisheries Company WLL, Arab Fisheries Co, The Savola Group, and Tabuk Fisheries Co.
- Market Concentration: xx% market share held by the top 5 players (2024).
- Technological Innovation: Focus on sustainable aquaculture practices, improved processing techniques, and cold chain logistics is driving innovation. Barriers include high initial investment costs and a lack of skilled labor.
- Regulatory Framework: Government regulations related to food safety, sustainability, and import/export procedures significantly impact market operations.
- Competitive Substitutes: Plant-based seafood alternatives are emerging as a potential competitive threat, although current market penetration remains low (xx%).
- End-User Demographics: Growing population, rising disposable incomes, and changing dietary preferences are driving demand for diverse seafood products.
- M&A Trends: The strategic partnership between NAQUA and SALIC (November 2023) highlights a trend towards consolidation and increased investment in the aquaculture sector. The number of M&A deals in the period 2019-2024 is estimated at xx.
KSA Sea Food Market Growth Trends & Insights
The KSA seafood market experienced significant growth during the historical period (2019-2024), driven by factors such as increasing consumption, government support for the aquaculture industry, and investments in infrastructure. The market size is expected to reach xx Million units in 2025 and maintain a Compound Annual Growth Rate (CAGR) of xx% during the forecast period (2025-2033). This growth is fueled by several key factors: rising per capita seafood consumption, expanding food service sector, government initiatives to support sustainable aquaculture, and increasing tourism. Technological disruptions, such as automation in processing and improved cold chain management, are expected to enhance efficiency and product quality. Consumer behavior shifts are reflected in increasing demand for higher-quality, sustainably sourced seafood products. The report further examines the impact of changing consumer preferences on various seafood types and forms.
Dominant Regions, Countries, or Segments in KSA Sea Food Market
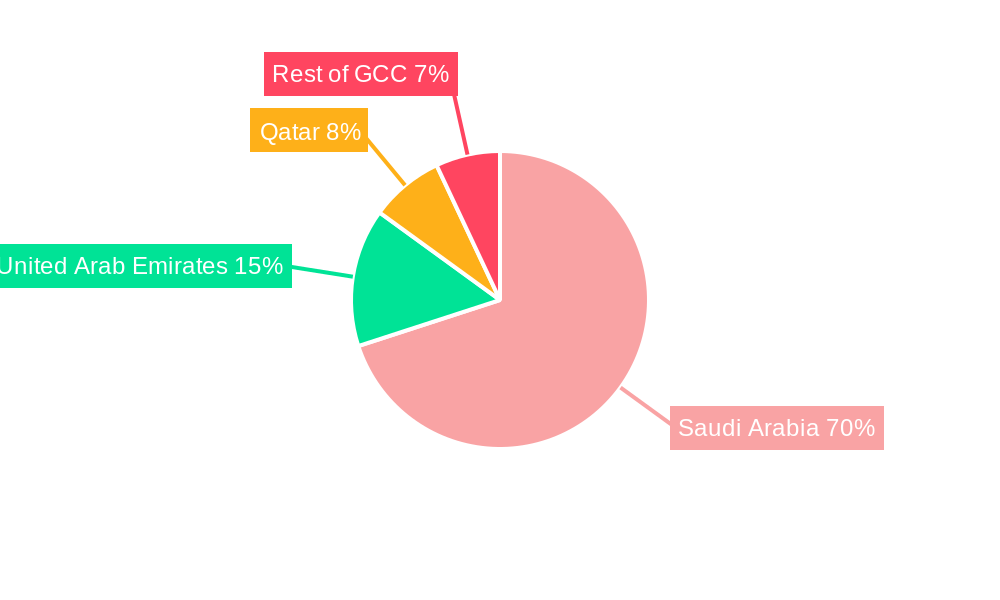
The Western region of KSA currently dominates the seafood market due to higher population density, strong tourism, and established distribution networks. The Fish segment holds the largest market share (xx%) followed by Shrimp (xx%) and Other Seafood (xx%). Within forms, Frozen seafood dominates owing to its longer shelf life and convenience. On-Trade channels are expanding rapidly due to the growth of restaurants and food service outlets.
- Key Drivers: Government investments in aquaculture, expanding retail infrastructure, increasing urbanization, and rising tourism.
- Dominance Factors: Established supply chains, high population density in Western region, strong consumer demand for frozen and processed seafood.
- Growth Potential: Significant growth potential exists in Eastern region due to increasing aquaculture activities and rising demand. The Processed segment is poised for rapid growth fueled by convenience and demand for value-added products.
KSA Sea Food Market Product Landscape
The KSA seafood market offers a diverse range of products, encompassing various types (fish, shrimp, other seafood), forms (canned, fresh/chilled, frozen, processed), and distribution channels (off-trade, on-trade). Product innovation focuses on value-added products, convenient packaging, and sustainably sourced options. Technological advancements are improving processing efficiency, extending shelf life, and enhancing product quality. Unique selling propositions include locally sourced products, organic options, and premium quality seafood items.
Key Drivers, Barriers & Challenges in KSA Sea Food Market
Key Drivers: Increasing per capita income, growing population, tourism boom, government support for aquaculture development, and a shift towards healthier dietary habits.
Challenges and Restraints: Fluctuations in global seafood prices, dependence on imports for certain species, stringent regulatory compliance, and infrastructural challenges in maintaining cold chain logistics. Supply chain disruptions can impact product availability and price stability, resulting in estimated losses of xx Million units annually.
Emerging Opportunities in KSA Sea Food Market
Emerging opportunities include the growth of value-added products, premium seafood segments, and increasing demand for sustainable and ethically sourced seafood. Untapped markets exist in smaller cities and rural areas where seafood consumption is relatively low. Innovation in packaging and distribution can unlock new opportunities.
Growth Accelerators in the KSA Sea Food Market Industry
Government initiatives promoting sustainable aquaculture, increasing investment in cold chain infrastructure, and the entry of international seafood companies are key catalysts driving long-term growth. Technological advancements, strategic partnerships, and market expansion into new regions are further propelling the market's expansion.
Key Players Shaping the KSA Sea Food Market Market
- Almunajem Foods
- Saudi Fisheries Company
- National Aquaculture Group
- IZAFCO Fish Packing Company
- Shell Fisheries Company WLL
- Arab Fisheries Co
- The Savola Group
- Tabuk Fisheries Co
Notable Milestones in KSA Sea Food Market Sector
- November 2023: NAQUA and SALIC's strategic partnership signals increased investment in the aquaculture sector, potentially boosting production capacity and market competitiveness.
- February 2022: Asmak's distribution agreement with Fish Farm expands market reach and product offerings, boosting local and regional availability.
- January 2022: NAQUA's planned production capacity expansion (from 60,000 to 250,000 tons by 2030) signifies ambitious growth plans within the industry.
In-Depth KSA Sea Food Market Market Outlook
The KSA seafood market presents substantial growth potential driven by favorable demographic trends, increased government support, and evolving consumer preferences. Strategic investments in sustainable aquaculture, cold chain infrastructure, and value-added product development will be crucial for maximizing market opportunities. The projected CAGR of xx% indicates a strong and dynamic market outlook for the coming decade.
KSA Sea Food Market Segmentation
-
1. Type
- 1.1. Fish
- 1.2. Shrimp
- 1.3. Other Seafood
-
2. Form
- 2.1. Canned
- 2.2. Fresh / Chilled
- 2.3. Frozen
- 2.4. Processed
-
3. Distribution Channel
-
3.1. Off-Trade
- 3.1.1. Convenience Stores
- 3.1.2. Online Channel
- 3.1.3. Supermarkets and Hypermarkets
- 3.1.4. Others
- 3.2. On-Trade
-
3.1. Off-Trade
KSA Sea Food Market Segmentation By Geography
-
1. North America
- 1.1. United States
- 1.2. Canada
- 1.3. Mexico
-
2. South America
- 2.1. Brazil
- 2.2. Argentina
- 2.3. Rest of South America
-
3. Europe
- 3.1. United Kingdom
- 3.2. Germany
- 3.3. France
- 3.4. Italy
- 3.5. Spain
- 3.6. Russia
- 3.7. Benelux
- 3.8. Nordics
- 3.9. Rest of Europe
-
4. Middle East & Africa
- 4.1. Turkey
- 4.2. Israel
- 4.3. GCC
- 4.4. North Africa
- 4.5. South Africa
- 4.6. Rest of Middle East & Africa
-
5. Asia Pacific
- 5.1. China
- 5.2. India
- 5.3. Japan
- 5.4. South Korea
- 5.5. ASEAN
- 5.6. Oceania
- 5.7. Rest of Asia Pacific
KSA Sea Food Market REPORT HIGHLIGHTS
| Aspects | Details |
|---|---|
| Study Period | 2019-2033 |
| Base Year | 2024 |
| Estimated Year | 2025 |
| Forecast Period | 2025-2033 |
| Historical Period | 2019-2024 |
| Growth Rate | CAGR of 7.02% from 2019-2033 |
| Segmentation |
|
Table of Contents
- 1. Introduction
- 1.1. Research Scope
- 1.2. Market Segmentation
- 1.3. Research Methodology
- 1.4. Definitions and Assumptions
- 2. Executive Summary
- 2.1. Introduction
- 3. Market Dynamics
- 3.1. Introduction
- 3.2. Market Drivers
- 3.2.1. Rising Demand for Clean Label Food & Beverage Products; Rising Demand for Dairy Products
- 3.3. Market Restrains
- 3.3.1. Presence of Preservatives in Ready Meals may Hamper the Market Growth
- 3.4. Market Trends
- 3.4.1. OTHER KEY INDUSTRY TRENDS COVERED IN THE REPORT
- 4. Market Factor Analysis
- 4.1. Porters Five Forces
- 4.2. Supply/Value Chain
- 4.3. PESTEL analysis
- 4.4. Market Entropy
- 4.5. Patent/Trademark Analysis
- 5. Global KSA Sea Food Market Analysis, Insights and Forecast, 2019-2031
- 5.1. Market Analysis, Insights and Forecast - by Type
- 5.1.1. Fish
- 5.1.2. Shrimp
- 5.1.3. Other Seafood
- 5.2. Market Analysis, Insights and Forecast - by Form
- 5.2.1. Canned
- 5.2.2. Fresh / Chilled
- 5.2.3. Frozen
- 5.2.4. Processed
- 5.3. Market Analysis, Insights and Forecast - by Distribution Channel
- 5.3.1. Off-Trade
- 5.3.1.1. Convenience Stores
- 5.3.1.2. Online Channel
- 5.3.1.3. Supermarkets and Hypermarkets
- 5.3.1.4. Others
- 5.3.2. On-Trade
- 5.3.1. Off-Trade
- 5.4. Market Analysis, Insights and Forecast - by Region
- 5.4.1. North America
- 5.4.2. South America
- 5.4.3. Europe
- 5.4.4. Middle East & Africa
- 5.4.5. Asia Pacific
- 5.1. Market Analysis, Insights and Forecast - by Type
- 6. North America KSA Sea Food Market Analysis, Insights and Forecast, 2019-2031
- 6.1. Market Analysis, Insights and Forecast - by Type
- 6.1.1. Fish
- 6.1.2. Shrimp
- 6.1.3. Other Seafood
- 6.2. Market Analysis, Insights and Forecast - by Form
- 6.2.1. Canned
- 6.2.2. Fresh / Chilled
- 6.2.3. Frozen
- 6.2.4. Processed
- 6.3. Market Analysis, Insights and Forecast - by Distribution Channel
- 6.3.1. Off-Trade
- 6.3.1.1. Convenience Stores
- 6.3.1.2. Online Channel
- 6.3.1.3. Supermarkets and Hypermarkets
- 6.3.1.4. Others
- 6.3.2. On-Trade
- 6.3.1. Off-Trade
- 6.1. Market Analysis, Insights and Forecast - by Type
- 7. South America KSA Sea Food Market Analysis, Insights and Forecast, 2019-2031
- 7.1. Market Analysis, Insights and Forecast - by Type
- 7.1.1. Fish
- 7.1.2. Shrimp
- 7.1.3. Other Seafood
- 7.2. Market Analysis, Insights and Forecast - by Form
- 7.2.1. Canned
- 7.2.2. Fresh / Chilled
- 7.2.3. Frozen
- 7.2.4. Processed
- 7.3. Market Analysis, Insights and Forecast - by Distribution Channel
- 7.3.1. Off-Trade
- 7.3.1.1. Convenience Stores
- 7.3.1.2. Online Channel
- 7.3.1.3. Supermarkets and Hypermarkets
- 7.3.1.4. Others
- 7.3.2. On-Trade
- 7.3.1. Off-Trade
- 7.1. Market Analysis, Insights and Forecast - by Type
- 8. Europe KSA Sea Food Market Analysis, Insights and Forecast, 2019-2031
- 8.1. Market Analysis, Insights and Forecast - by Type
- 8.1.1. Fish
- 8.1.2. Shrimp
- 8.1.3. Other Seafood
- 8.2. Market Analysis, Insights and Forecast - by Form
- 8.2.1. Canned
- 8.2.2. Fresh / Chilled
- 8.2.3. Frozen
- 8.2.4. Processed
- 8.3. Market Analysis, Insights and Forecast - by Distribution Channel
- 8.3.1. Off-Trade
- 8.3.1.1. Convenience Stores
- 8.3.1.2. Online Channel
- 8.3.1.3. Supermarkets and Hypermarkets
- 8.3.1.4. Others
- 8.3.2. On-Trade
- 8.3.1. Off-Trade
- 8.1. Market Analysis, Insights and Forecast - by Type
- 9. Middle East & Africa KSA Sea Food Market Analysis, Insights and Forecast, 2019-2031
- 9.1. Market Analysis, Insights and Forecast - by Type
- 9.1.1. Fish
- 9.1.2. Shrimp
- 9.1.3. Other Seafood
- 9.2. Market Analysis, Insights and Forecast - by Form
- 9.2.1. Canned
- 9.2.2. Fresh / Chilled
- 9.2.3. Frozen
- 9.2.4. Processed
- 9.3. Market Analysis, Insights and Forecast - by Distribution Channel
- 9.3.1. Off-Trade
- 9.3.1.1. Convenience Stores
- 9.3.1.2. Online Channel
- 9.3.1.3. Supermarkets and Hypermarkets
- 9.3.1.4. Others
- 9.3.2. On-Trade
- 9.3.1. Off-Trade
- 9.1. Market Analysis, Insights and Forecast - by Type
- 10. Asia Pacific KSA Sea Food Market Analysis, Insights and Forecast, 2019-2031
- 10.1. Market Analysis, Insights and Forecast - by Type
- 10.1.1. Fish
- 10.1.2. Shrimp
- 10.1.3. Other Seafood
- 10.2. Market Analysis, Insights and Forecast - by Form
- 10.2.1. Canned
- 10.2.2. Fresh / Chilled
- 10.2.3. Frozen
- 10.2.4. Processed
- 10.3. Market Analysis, Insights and Forecast - by Distribution Channel
- 10.3.1. Off-Trade
- 10.3.1.1. Convenience Stores
- 10.3.1.2. Online Channel
- 10.3.1.3. Supermarkets and Hypermarkets
- 10.3.1.4. Others
- 10.3.2. On-Trade
- 10.3.1. Off-Trade
- 10.1. Market Analysis, Insights and Forecast - by Type
- 11. United Arab Emirates KSA Sea Food Market Analysis, Insights and Forecast, 2019-2031
- 11.1. Market Analysis, Insights and Forecast - By Country/Sub-region
- 11.1.1.
- 12. Saudi Arabia KSA Sea Food Market Analysis, Insights and Forecast, 2019-2031
- 12.1. Market Analysis, Insights and Forecast - By Country/Sub-region
- 12.1.1.
- 13. Qatar KSA Sea Food Market Analysis, Insights and Forecast, 2019-2031
- 13.1. Market Analysis, Insights and Forecast - By Country/Sub-region
- 13.1.1.
- 14. Rest of Gulf Cooperation Council KSA Sea Food Market Analysis, Insights and Forecast, 2019-2031
- 14.1. Market Analysis, Insights and Forecast - By Country/Sub-region
- 14.1.1.
- 15. Competitive Analysis
- 15.1. Global Market Share Analysis 2024
- 15.2. Company Profiles
- 15.2.1 Almunajem Foods
- 15.2.1.1. Overview
- 15.2.1.2. Products
- 15.2.1.3. SWOT Analysis
- 15.2.1.4. Recent Developments
- 15.2.1.5. Financials (Based on Availability)
- 15.2.2 Saudi Fisheries Company
- 15.2.2.1. Overview
- 15.2.2.2. Products
- 15.2.2.3. SWOT Analysis
- 15.2.2.4. Recent Developments
- 15.2.2.5. Financials (Based on Availability)
- 15.2.3 National Aquaculture Group
- 15.2.3.1. Overview
- 15.2.3.2. Products
- 15.2.3.3. SWOT Analysis
- 15.2.3.4. Recent Developments
- 15.2.3.5. Financials (Based on Availability)
- 15.2.4 IZAFCO Fish Packing Company
- 15.2.4.1. Overview
- 15.2.4.2. Products
- 15.2.4.3. SWOT Analysis
- 15.2.4.4. Recent Developments
- 15.2.4.5. Financials (Based on Availability)
- 15.2.5 Shell Fisheries Company W L L
- 15.2.5.1. Overview
- 15.2.5.2. Products
- 15.2.5.3. SWOT Analysis
- 15.2.5.4. Recent Developments
- 15.2.5.5. Financials (Based on Availability)
- 15.2.6 Arab Fisheries Co
- 15.2.6.1. Overview
- 15.2.6.2. Products
- 15.2.6.3. SWOT Analysis
- 15.2.6.4. Recent Developments
- 15.2.6.5. Financials (Based on Availability)
- 15.2.7 The Savola Grou
- 15.2.7.1. Overview
- 15.2.7.2. Products
- 15.2.7.3. SWOT Analysis
- 15.2.7.4. Recent Developments
- 15.2.7.5. Financials (Based on Availability)
- 15.2.8 Tabuk Fisheries Co
- 15.2.8.1. Overview
- 15.2.8.2. Products
- 15.2.8.3. SWOT Analysis
- 15.2.8.4. Recent Developments
- 15.2.8.5. Financials (Based on Availability)
- 15.2.1 Almunajem Foods
List of Figures
- Figure 1: Global KSA Sea Food Market Revenue Breakdown (Million, %) by Region 2024 & 2032
- Figure 2: Global KSA Sea Food Market Volume Breakdown (K Tons, %) by Region 2024 & 2032
- Figure 3: United Arab Emirates KSA Sea Food Market Revenue (Million), by Country 2024 & 2032
- Figure 4: United Arab Emirates KSA Sea Food Market Volume (K Tons), by Country 2024 & 2032
- Figure 5: United Arab Emirates KSA Sea Food Market Revenue Share (%), by Country 2024 & 2032
- Figure 6: United Arab Emirates KSA Sea Food Market Volume Share (%), by Country 2024 & 2032
- Figure 7: Saudi Arabia KSA Sea Food Market Revenue (Million), by Country 2024 & 2032
- Figure 8: Saudi Arabia KSA Sea Food Market Volume (K Tons), by Country 2024 & 2032
- Figure 9: Saudi Arabia KSA Sea Food Market Revenue Share (%), by Country 2024 & 2032
- Figure 10: Saudi Arabia KSA Sea Food Market Volume Share (%), by Country 2024 & 2032
- Figure 11: Qatar KSA Sea Food Market Revenue (Million), by Country 2024 & 2032
- Figure 12: Qatar KSA Sea Food Market Volume (K Tons), by Country 2024 & 2032
- Figure 13: Qatar KSA Sea Food Market Revenue Share (%), by Country 2024 & 2032
- Figure 14: Qatar KSA Sea Food Market Volume Share (%), by Country 2024 & 2032
- Figure 15: Rest of Gulf Cooperation Council KSA Sea Food Market Revenue (Million), by Country 2024 & 2032
- Figure 16: Rest of Gulf Cooperation Council KSA Sea Food Market Volume (K Tons), by Country 2024 & 2032
- Figure 17: Rest of Gulf Cooperation Council KSA Sea Food Market Revenue Share (%), by Country 2024 & 2032
- Figure 18: Rest of Gulf Cooperation Council KSA Sea Food Market Volume Share (%), by Country 2024 & 2032
- Figure 19: North America KSA Sea Food Market Revenue (Million), by Type 2024 & 2032
- Figure 20: North America KSA Sea Food Market Volume (K Tons), by Type 2024 & 2032
- Figure 21: North America KSA Sea Food Market Revenue Share (%), by Type 2024 & 2032
- Figure 22: North America KSA Sea Food Market Volume Share (%), by Type 2024 & 2032
- Figure 23: North America KSA Sea Food Market Revenue (Million), by Form 2024 & 2032
- Figure 24: North America KSA Sea Food Market Volume (K Tons), by Form 2024 & 2032
- Figure 25: North America KSA Sea Food Market Revenue Share (%), by Form 2024 & 2032
- Figure 26: North America KSA Sea Food Market Volume Share (%), by Form 2024 & 2032
- Figure 27: North America KSA Sea Food Market Revenue (Million), by Distribution Channel 2024 & 2032
- Figure 28: North America KSA Sea Food Market Volume (K Tons), by Distribution Channel 2024 & 2032
- Figure 29: North America KSA Sea Food Market Revenue Share (%), by Distribution Channel 2024 & 2032
- Figure 30: North America KSA Sea Food Market Volume Share (%), by Distribution Channel 2024 & 2032
- Figure 31: North America KSA Sea Food Market Revenue (Million), by Country 2024 & 2032
- Figure 32: North America KSA Sea Food Market Volume (K Tons), by Country 2024 & 2032
- Figure 33: North America KSA Sea Food Market Revenue Share (%), by Country 2024 & 2032
- Figure 34: North America KSA Sea Food Market Volume Share (%), by Country 2024 & 2032
- Figure 35: South America KSA Sea Food Market Revenue (Million), by Type 2024 & 2032
- Figure 36: South America KSA Sea Food Market Volume (K Tons), by Type 2024 & 2032
- Figure 37: South America KSA Sea Food Market Revenue Share (%), by Type 2024 & 2032
- Figure 38: South America KSA Sea Food Market Volume Share (%), by Type 2024 & 2032
- Figure 39: South America KSA Sea Food Market Revenue (Million), by Form 2024 & 2032
- Figure 40: South America KSA Sea Food Market Volume (K Tons), by Form 2024 & 2032
- Figure 41: South America KSA Sea Food Market Revenue Share (%), by Form 2024 & 2032
- Figure 42: South America KSA Sea Food Market Volume Share (%), by Form 2024 & 2032
- Figure 43: South America KSA Sea Food Market Revenue (Million), by Distribution Channel 2024 & 2032
- Figure 44: South America KSA Sea Food Market Volume (K Tons), by Distribution Channel 2024 & 2032
- Figure 45: South America KSA Sea Food Market Revenue Share (%), by Distribution Channel 2024 & 2032
- Figure 46: South America KSA Sea Food Market Volume Share (%), by Distribution Channel 2024 & 2032
- Figure 47: South America KSA Sea Food Market Revenue (Million), by Country 2024 & 2032
- Figure 48: South America KSA Sea Food Market Volume (K Tons), by Country 2024 & 2032
- Figure 49: South America KSA Sea Food Market Revenue Share (%), by Country 2024 & 2032
- Figure 50: South America KSA Sea Food Market Volume Share (%), by Country 2024 & 2032
- Figure 51: Europe KSA Sea Food Market Revenue (Million), by Type 2024 & 2032
- Figure 52: Europe KSA Sea Food Market Volume (K Tons), by Type 2024 & 2032
- Figure 53: Europe KSA Sea Food Market Revenue Share (%), by Type 2024 & 2032
- Figure 54: Europe KSA Sea Food Market Volume Share (%), by Type 2024 & 2032
- Figure 55: Europe KSA Sea Food Market Revenue (Million), by Form 2024 & 2032
- Figure 56: Europe KSA Sea Food Market Volume (K Tons), by Form 2024 & 2032
- Figure 57: Europe KSA Sea Food Market Revenue Share (%), by Form 2024 & 2032
- Figure 58: Europe KSA Sea Food Market Volume Share (%), by Form 2024 & 2032
- Figure 59: Europe KSA Sea Food Market Revenue (Million), by Distribution Channel 2024 & 2032
- Figure 60: Europe KSA Sea Food Market Volume (K Tons), by Distribution Channel 2024 & 2032
- Figure 61: Europe KSA Sea Food Market Revenue Share (%), by Distribution Channel 2024 & 2032
- Figure 62: Europe KSA Sea Food Market Volume Share (%), by Distribution Channel 2024 & 2032
- Figure 63: Europe KSA Sea Food Market Revenue (Million), by Country 2024 & 2032
- Figure 64: Europe KSA Sea Food Market Volume (K Tons), by Country 2024 & 2032
- Figure 65: Europe KSA Sea Food Market Revenue Share (%), by Country 2024 & 2032
- Figure 66: Europe KSA Sea Food Market Volume Share (%), by Country 2024 & 2032
- Figure 67: Middle East & Africa KSA Sea Food Market Revenue (Million), by Type 2024 & 2032
- Figure 68: Middle East & Africa KSA Sea Food Market Volume (K Tons), by Type 2024 & 2032
- Figure 69: Middle East & Africa KSA Sea Food Market Revenue Share (%), by Type 2024 & 2032
- Figure 70: Middle East & Africa KSA Sea Food Market Volume Share (%), by Type 2024 & 2032
- Figure 71: Middle East & Africa KSA Sea Food Market Revenue (Million), by Form 2024 & 2032
- Figure 72: Middle East & Africa KSA Sea Food Market Volume (K Tons), by Form 2024 & 2032
- Figure 73: Middle East & Africa KSA Sea Food Market Revenue Share (%), by Form 2024 & 2032
- Figure 74: Middle East & Africa KSA Sea Food Market Volume Share (%), by Form 2024 & 2032
- Figure 75: Middle East & Africa KSA Sea Food Market Revenue (Million), by Distribution Channel 2024 & 2032
- Figure 76: Middle East & Africa KSA Sea Food Market Volume (K Tons), by Distribution Channel 2024 & 2032
- Figure 77: Middle East & Africa KSA Sea Food Market Revenue Share (%), by Distribution Channel 2024 & 2032
- Figure 78: Middle East & Africa KSA Sea Food Market Volume Share (%), by Distribution Channel 2024 & 2032
- Figure 79: Middle East & Africa KSA Sea Food Market Revenue (Million), by Country 2024 & 2032
- Figure 80: Middle East & Africa KSA Sea Food Market Volume (K Tons), by Country 2024 & 2032
- Figure 81: Middle East & Africa KSA Sea Food Market Revenue Share (%), by Country 2024 & 2032
- Figure 82: Middle East & Africa KSA Sea Food Market Volume Share (%), by Country 2024 & 2032
- Figure 83: Asia Pacific KSA Sea Food Market Revenue (Million), by Type 2024 & 2032
- Figure 84: Asia Pacific KSA Sea Food Market Volume (K Tons), by Type 2024 & 2032
- Figure 85: Asia Pacific KSA Sea Food Market Revenue Share (%), by Type 2024 & 2032
- Figure 86: Asia Pacific KSA Sea Food Market Volume Share (%), by Type 2024 & 2032
- Figure 87: Asia Pacific KSA Sea Food Market Revenue (Million), by Form 2024 & 2032
- Figure 88: Asia Pacific KSA Sea Food Market Volume (K Tons), by Form 2024 & 2032
- Figure 89: Asia Pacific KSA Sea Food Market Revenue Share (%), by Form 2024 & 2032
- Figure 90: Asia Pacific KSA Sea Food Market Volume Share (%), by Form 2024 & 2032
- Figure 91: Asia Pacific KSA Sea Food Market Revenue (Million), by Distribution Channel 2024 & 2032
- Figure 92: Asia Pacific KSA Sea Food Market Volume (K Tons), by Distribution Channel 2024 & 2032
- Figure 93: Asia Pacific KSA Sea Food Market Revenue Share (%), by Distribution Channel 2024 & 2032
- Figure 94: Asia Pacific KSA Sea Food Market Volume Share (%), by Distribution Channel 2024 & 2032
- Figure 95: Asia Pacific KSA Sea Food Market Revenue (Million), by Country 2024 & 2032
- Figure 96: Asia Pacific KSA Sea Food Market Volume (K Tons), by Country 2024 & 2032
- Figure 97: Asia Pacific KSA Sea Food Market Revenue Share (%), by Country 2024 & 2032
- Figure 98: Asia Pacific KSA Sea Food Market Volume Share (%), by Country 2024 & 2032
List of Tables
- Table 1: Global KSA Sea Food Market Revenue Million Forecast, by Region 2019 & 2032
- Table 2: Global KSA Sea Food Market Volume K Tons Forecast, by Region 2019 & 2032
- Table 3: Global KSA Sea Food Market Revenue Million Forecast, by Type 2019 & 2032
- Table 4: Global KSA Sea Food Market Volume K Tons Forecast, by Type 2019 & 2032
- Table 5: Global KSA Sea Food Market Revenue Million Forecast, by Form 2019 & 2032
- Table 6: Global KSA Sea Food Market Volume K Tons Forecast, by Form 2019 & 2032
- Table 7: Global KSA Sea Food Market Revenue Million Forecast, by Distribution Channel 2019 & 2032
- Table 8: Global KSA Sea Food Market Volume K Tons Forecast, by Distribution Channel 2019 & 2032
- Table 9: Global KSA Sea Food Market Revenue Million Forecast, by Region 2019 & 2032
- Table 10: Global KSA Sea Food Market Volume K Tons Forecast, by Region 2019 & 2032
- Table 11: Global KSA Sea Food Market Revenue Million Forecast, by Country 2019 & 2032
- Table 12: Global KSA Sea Food Market Volume K Tons Forecast, by Country 2019 & 2032
- Table 13: KSA Sea Food Market Revenue (Million) Forecast, by Application 2019 & 2032
- Table 14: KSA Sea Food Market Volume (K Tons) Forecast, by Application 2019 & 2032
- Table 15: Global KSA Sea Food Market Revenue Million Forecast, by Country 2019 & 2032
- Table 16: Global KSA Sea Food Market Volume K Tons Forecast, by Country 2019 & 2032
- Table 17: KSA Sea Food Market Revenue (Million) Forecast, by Application 2019 & 2032
- Table 18: KSA Sea Food Market Volume (K Tons) Forecast, by Application 2019 & 2032
- Table 19: Global KSA Sea Food Market Revenue Million Forecast, by Country 2019 & 2032
- Table 20: Global KSA Sea Food Market Volume K Tons Forecast, by Country 2019 & 2032
- Table 21: KSA Sea Food Market Revenue (Million) Forecast, by Application 2019 & 2032
- Table 22: KSA Sea Food Market Volume (K Tons) Forecast, by Application 2019 & 2032
- Table 23: Global KSA Sea Food Market Revenue Million Forecast, by Country 2019 & 2032
- Table 24: Global KSA Sea Food Market Volume K Tons Forecast, by Country 2019 & 2032
- Table 25: KSA Sea Food Market Revenue (Million) Forecast, by Application 2019 & 2032
- Table 26: KSA Sea Food Market Volume (K Tons) Forecast, by Application 2019 & 2032
- Table 27: Global KSA Sea Food Market Revenue Million Forecast, by Type 2019 & 2032
- Table 28: Global KSA Sea Food Market Volume K Tons Forecast, by Type 2019 & 2032
- Table 29: Global KSA Sea Food Market Revenue Million Forecast, by Form 2019 & 2032
- Table 30: Global KSA Sea Food Market Volume K Tons Forecast, by Form 2019 & 2032
- Table 31: Global KSA Sea Food Market Revenue Million Forecast, by Distribution Channel 2019 & 2032
- Table 32: Global KSA Sea Food Market Volume K Tons Forecast, by Distribution Channel 2019 & 2032
- Table 33: Global KSA Sea Food Market Revenue Million Forecast, by Country 2019 & 2032
- Table 34: Global KSA Sea Food Market Volume K Tons Forecast, by Country 2019 & 2032
- Table 35: United States KSA Sea Food Market Revenue (Million) Forecast, by Application 2019 & 2032
- Table 36: United States KSA Sea Food Market Volume (K Tons) Forecast, by Application 2019 & 2032
- Table 37: Canada KSA Sea Food Market Revenue (Million) Forecast, by Application 2019 & 2032
- Table 38: Canada KSA Sea Food Market Volume (K Tons) Forecast, by Application 2019 & 2032
- Table 39: Mexico KSA Sea Food Market Revenue (Million) Forecast, by Application 2019 & 2032
- Table 40: Mexico KSA Sea Food Market Volume (K Tons) Forecast, by Application 2019 & 2032
- Table 41: Global KSA Sea Food Market Revenue Million Forecast, by Type 2019 & 2032
- Table 42: Global KSA Sea Food Market Volume K Tons Forecast, by Type 2019 & 2032
- Table 43: Global KSA Sea Food Market Revenue Million Forecast, by Form 2019 & 2032
- Table 44: Global KSA Sea Food Market Volume K Tons Forecast, by Form 2019 & 2032
- Table 45: Global KSA Sea Food Market Revenue Million Forecast, by Distribution Channel 2019 & 2032
- Table 46: Global KSA Sea Food Market Volume K Tons Forecast, by Distribution Channel 2019 & 2032
- Table 47: Global KSA Sea Food Market Revenue Million Forecast, by Country 2019 & 2032
- Table 48: Global KSA Sea Food Market Volume K Tons Forecast, by Country 2019 & 2032
- Table 49: Brazil KSA Sea Food Market Revenue (Million) Forecast, by Application 2019 & 2032
- Table 50: Brazil KSA Sea Food Market Volume (K Tons) Forecast, by Application 2019 & 2032
- Table 51: Argentina KSA Sea Food Market Revenue (Million) Forecast, by Application 2019 & 2032
- Table 52: Argentina KSA Sea Food Market Volume (K Tons) Forecast, by Application 2019 & 2032
- Table 53: Rest of South America KSA Sea Food Market Revenue (Million) Forecast, by Application 2019 & 2032
- Table 54: Rest of South America KSA Sea Food Market Volume (K Tons) Forecast, by Application 2019 & 2032
- Table 55: Global KSA Sea Food Market Revenue Million Forecast, by Type 2019 & 2032
- Table 56: Global KSA Sea Food Market Volume K Tons Forecast, by Type 2019 & 2032
- Table 57: Global KSA Sea Food Market Revenue Million Forecast, by Form 2019 & 2032
- Table 58: Global KSA Sea Food Market Volume K Tons Forecast, by Form 2019 & 2032
- Table 59: Global KSA Sea Food Market Revenue Million Forecast, by Distribution Channel 2019 & 2032
- Table 60: Global KSA Sea Food Market Volume K Tons Forecast, by Distribution Channel 2019 & 2032
- Table 61: Global KSA Sea Food Market Revenue Million Forecast, by Country 2019 & 2032
- Table 62: Global KSA Sea Food Market Volume K Tons Forecast, by Country 2019 & 2032
- Table 63: United Kingdom KSA Sea Food Market Revenue (Million) Forecast, by Application 2019 & 2032
- Table 64: United Kingdom KSA Sea Food Market Volume (K Tons) Forecast, by Application 2019 & 2032
- Table 65: Germany KSA Sea Food Market Revenue (Million) Forecast, by Application 2019 & 2032
- Table 66: Germany KSA Sea Food Market Volume (K Tons) Forecast, by Application 2019 & 2032
- Table 67: France KSA Sea Food Market Revenue (Million) Forecast, by Application 2019 & 2032
- Table 68: France KSA Sea Food Market Volume (K Tons) Forecast, by Application 2019 & 2032
- Table 69: Italy KSA Sea Food Market Revenue (Million) Forecast, by Application 2019 & 2032
- Table 70: Italy KSA Sea Food Market Volume (K Tons) Forecast, by Application 2019 & 2032
- Table 71: Spain KSA Sea Food Market Revenue (Million) Forecast, by Application 2019 & 2032
- Table 72: Spain KSA Sea Food Market Volume (K Tons) Forecast, by Application 2019 & 2032
- Table 73: Russia KSA Sea Food Market Revenue (Million) Forecast, by Application 2019 & 2032
- Table 74: Russia KSA Sea Food Market Volume (K Tons) Forecast, by Application 2019 & 2032
- Table 75: Benelux KSA Sea Food Market Revenue (Million) Forecast, by Application 2019 & 2032
- Table 76: Benelux KSA Sea Food Market Volume (K Tons) Forecast, by Application 2019 & 2032
- Table 77: Nordics KSA Sea Food Market Revenue (Million) Forecast, by Application 2019 & 2032
- Table 78: Nordics KSA Sea Food Market Volume (K Tons) Forecast, by Application 2019 & 2032
- Table 79: Rest of Europe KSA Sea Food Market Revenue (Million) Forecast, by Application 2019 & 2032
- Table 80: Rest of Europe KSA Sea Food Market Volume (K Tons) Forecast, by Application 2019 & 2032
- Table 81: Global KSA Sea Food Market Revenue Million Forecast, by Type 2019 & 2032
- Table 82: Global KSA Sea Food Market Volume K Tons Forecast, by Type 2019 & 2032
- Table 83: Global KSA Sea Food Market Revenue Million Forecast, by Form 2019 & 2032
- Table 84: Global KSA Sea Food Market Volume K Tons Forecast, by Form 2019 & 2032
- Table 85: Global KSA Sea Food Market Revenue Million Forecast, by Distribution Channel 2019 & 2032
- Table 86: Global KSA Sea Food Market Volume K Tons Forecast, by Distribution Channel 2019 & 2032
- Table 87: Global KSA Sea Food Market Revenue Million Forecast, by Country 2019 & 2032
- Table 88: Global KSA Sea Food Market Volume K Tons Forecast, by Country 2019 & 2032
- Table 89: Turkey KSA Sea Food Market Revenue (Million) Forecast, by Application 2019 & 2032
- Table 90: Turkey KSA Sea Food Market Volume (K Tons) Forecast, by Application 2019 & 2032
- Table 91: Israel KSA Sea Food Market Revenue (Million) Forecast, by Application 2019 & 2032
- Table 92: Israel KSA Sea Food Market Volume (K Tons) Forecast, by Application 2019 & 2032
- Table 93: GCC KSA Sea Food Market Revenue (Million) Forecast, by Application 2019 & 2032
- Table 94: GCC KSA Sea Food Market Volume (K Tons) Forecast, by Application 2019 & 2032
- Table 95: North Africa KSA Sea Food Market Revenue (Million) Forecast, by Application 2019 & 2032
- Table 96: North Africa KSA Sea Food Market Volume (K Tons) Forecast, by Application 2019 & 2032
- Table 97: South Africa KSA Sea Food Market Revenue (Million) Forecast, by Application 2019 & 2032
- Table 98: South Africa KSA Sea Food Market Volume (K Tons) Forecast, by Application 2019 & 2032
- Table 99: Rest of Middle East & Africa KSA Sea Food Market Revenue (Million) Forecast, by Application 2019 & 2032
- Table 100: Rest of Middle East & Africa KSA Sea Food Market Volume (K Tons) Forecast, by Application 2019 & 2032
- Table 101: Global KSA Sea Food Market Revenue Million Forecast, by Type 2019 & 2032
- Table 102: Global KSA Sea Food Market Volume K Tons Forecast, by Type 2019 & 2032
- Table 103: Global KSA Sea Food Market Revenue Million Forecast, by Form 2019 & 2032
- Table 104: Global KSA Sea Food Market Volume K Tons Forecast, by Form 2019 & 2032
- Table 105: Global KSA Sea Food Market Revenue Million Forecast, by Distribution Channel 2019 & 2032
- Table 106: Global KSA Sea Food Market Volume K Tons Forecast, by Distribution Channel 2019 & 2032
- Table 107: Global KSA Sea Food Market Revenue Million Forecast, by Country 2019 & 2032
- Table 108: Global KSA Sea Food Market Volume K Tons Forecast, by Country 2019 & 2032
- Table 109: China KSA Sea Food Market Revenue (Million) Forecast, by Application 2019 & 2032
- Table 110: China KSA Sea Food Market Volume (K Tons) Forecast, by Application 2019 & 2032
- Table 111: India KSA Sea Food Market Revenue (Million) Forecast, by Application 2019 & 2032
- Table 112: India KSA Sea Food Market Volume (K Tons) Forecast, by Application 2019 & 2032
- Table 113: Japan KSA Sea Food Market Revenue (Million) Forecast, by Application 2019 & 2032
- Table 114: Japan KSA Sea Food Market Volume (K Tons) Forecast, by Application 2019 & 2032
- Table 115: South Korea KSA Sea Food Market Revenue (Million) Forecast, by Application 2019 & 2032
- Table 116: South Korea KSA Sea Food Market Volume (K Tons) Forecast, by Application 2019 & 2032
- Table 117: ASEAN KSA Sea Food Market Revenue (Million) Forecast, by Application 2019 & 2032
- Table 118: ASEAN KSA Sea Food Market Volume (K Tons) Forecast, by Application 2019 & 2032
- Table 119: Oceania KSA Sea Food Market Revenue (Million) Forecast, by Application 2019 & 2032
- Table 120: Oceania KSA Sea Food Market Volume (K Tons) Forecast, by Application 2019 & 2032
- Table 121: Rest of Asia Pacific KSA Sea Food Market Revenue (Million) Forecast, by Application 2019 & 2032
- Table 122: Rest of Asia Pacific KSA Sea Food Market Volume (K Tons) Forecast, by Application 2019 & 2032
Frequently Asked Questions
1. What is the projected Compound Annual Growth Rate (CAGR) of the KSA Sea Food Market?
The projected CAGR is approximately 7.02%.
2. Which companies are prominent players in the KSA Sea Food Market?
Key companies in the market include Almunajem Foods, Saudi Fisheries Company, National Aquaculture Group, IZAFCO Fish Packing Company, Shell Fisheries Company W L L, Arab Fisheries Co, The Savola Grou, Tabuk Fisheries Co.
3. What are the main segments of the KSA Sea Food Market?
The market segments include Type, Form, Distribution Channel.
4. Can you provide details about the market size?
The market size is estimated to be USD 1 Million as of 2022.
5. What are some drivers contributing to market growth?
Rising Demand for Clean Label Food & Beverage Products; Rising Demand for Dairy Products.
6. What are the notable trends driving market growth?
OTHER KEY INDUSTRY TRENDS COVERED IN THE REPORT.
7. Are there any restraints impacting market growth?
Presence of Preservatives in Ready Meals may Hamper the Market Growth.
8. Can you provide examples of recent developments in the market?
November 2023: NAQUA and the Saudi Agricultural and Livestock Investment Company (SALIC) have signed a strategic partnership contract. Under this agreement, SALIC agreed to raise the capital for NAQUA by way of primary investment and consequently holds a 42.4% shareholding in the NAQUA company.February 2022: Asmak announced a strategic distribution agreement with Fish Farm, a UAE-based aquaculture company. Under this agreement, Asmak distributes fish farm products to capture a wider audience locally and regionally through its processing facility and strong distribution channels, including wholesale, foodservice, and retail.January 2022: NAQUA plans to expand its production capacity from 60,000 tons of fish a year to 250,000 tons of fish a year by 2030.
9. What pricing options are available for accessing the report?
Pricing options include single-user, multi-user, and enterprise licenses priced at USD 3800, USD 4500, and USD 5800 respectively.
10. Is the market size provided in terms of value or volume?
The market size is provided in terms of value, measured in Million and volume, measured in K Tons.
11. Are there any specific market keywords associated with the report?
Yes, the market keyword associated with the report is "KSA Sea Food Market," which aids in identifying and referencing the specific market segment covered.
12. How do I determine which pricing option suits my needs best?
The pricing options vary based on user requirements and access needs. Individual users may opt for single-user licenses, while businesses requiring broader access may choose multi-user or enterprise licenses for cost-effective access to the report.
13. Are there any additional resources or data provided in the KSA Sea Food Market report?
While the report offers comprehensive insights, it's advisable to review the specific contents or supplementary materials provided to ascertain if additional resources or data are available.
14. How can I stay updated on further developments or reports in the KSA Sea Food Market?
To stay informed about further developments, trends, and reports in the KSA Sea Food Market, consider subscribing to industry newsletters, following relevant companies and organizations, or regularly checking reputable industry news sources and publications.
Methodology
Step 1 - Identification of Relevant Samples Size from Population Database


Step 2 - Approaches for Defining Global Market Size (Value, Volume* & Price*)

Note*: In applicable scenarios
Step 3 - Data Sources
Primary Research
- Web Analytics
- Survey Reports
- Research Institute
- Latest Research Reports
- Opinion Leaders
Secondary Research
- Annual Reports
- White Paper
- Latest Press Release
- Industry Association
- Paid Database
- Investor Presentations

Step 4 - Data Triangulation
Involves using different sources of information in order to increase the validity of a study
These sources are likely to be stakeholders in a program - participants, other researchers, program staff, other community members, and so on.
Then we put all data in single framework & apply various statistical tools to find out the dynamic on the market.
During the analysis stage, feedback from the stakeholder groups would be compared to determine areas of agreement as well as areas of divergence
