

Key Insights
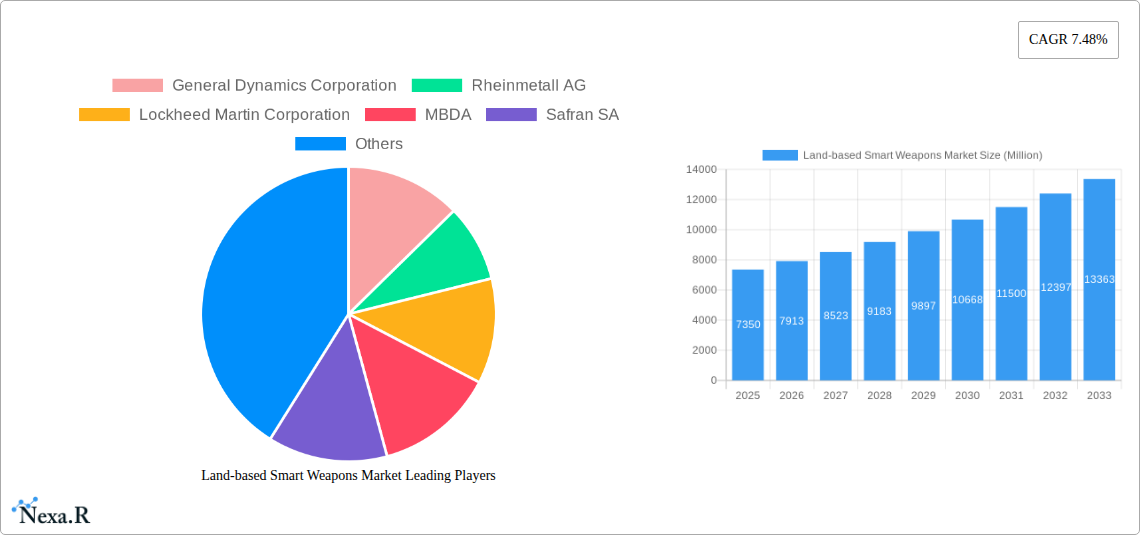
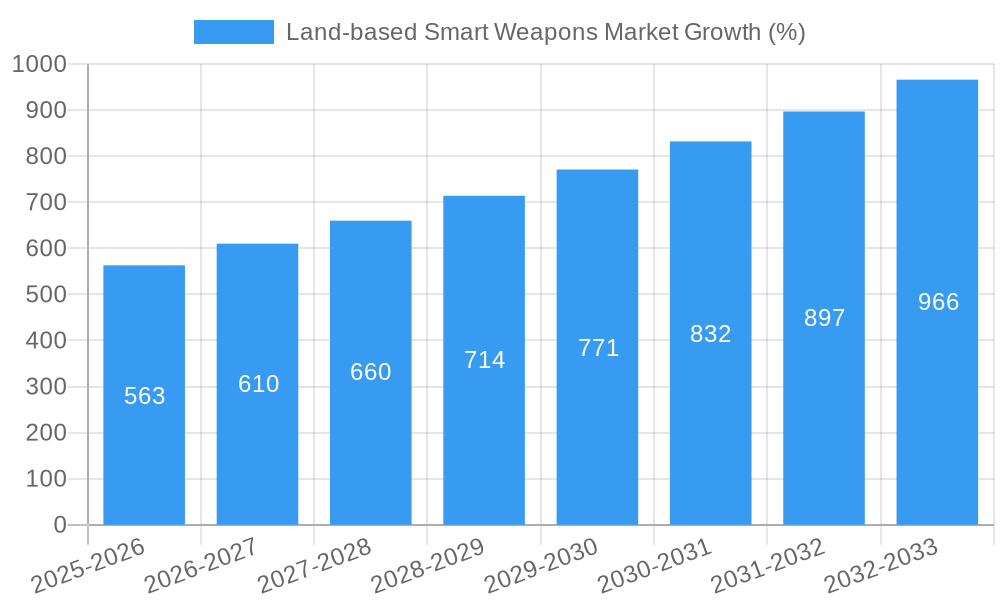
The land-based smart weapons market is experiencing robust growth, projected to reach a market size of $7.35 billion in 2025 and maintain a Compound Annual Growth Rate (CAGR) of 7.48% from 2025 to 2033. This expansion is driven by several key factors. Increased geopolitical instability and regional conflicts fuel demand for advanced weaponry capable of precise targeting and minimizing collateral damage. Technological advancements in guidance systems, such as satellite, radar, infrared, and laser guidance, enhance the accuracy and effectiveness of these weapons, further stimulating market growth. Furthermore, growing investments in military modernization programs by various nations, particularly in North America and Asia-Pacific regions, are significantly contributing to market expansion. The market is segmented by product type (missiles, ammunitions, and other products) and technology (satellite, radar, infrared, laser, and other guidance systems). While the specifics of market share distribution across these segments are not provided, it's reasonable to assume that missiles hold a significant portion, driven by their long-range capabilities and destructive power. Similarly, satellite and radar guidance technologies likely dominate the market owing to their reliability and precision, compared to other options like infrared and laser guidance which might have limitations in adverse weather conditions.
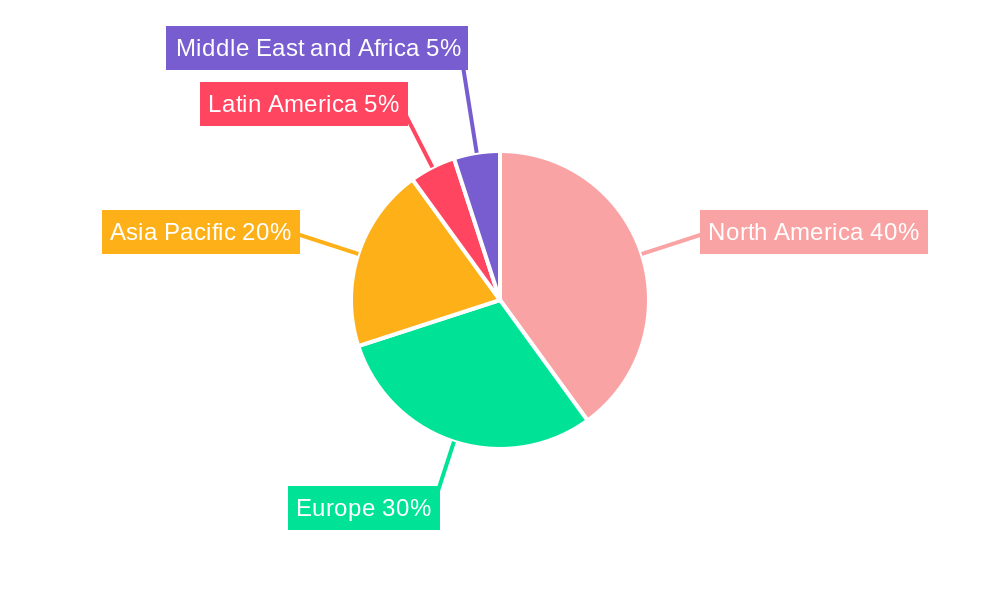
Market restraints include the high cost of research and development, stringent regulations surrounding the production and sale of such weapons, and the ethical concerns associated with their use in conflicts. However, the increasing demand for advanced defense systems and the continuous innovation in guidance technologies are expected to offset these challenges. Regional analysis indicates that North America and Asia-Pacific, given their significant military spending and presence of major manufacturers, are likely to dominate the market share. Europe will also contribute significantly, while other regions might exhibit slower growth due to factors like lower defense budgets and political stability. The forecast period of 2025-2033 anticipates continued market expansion propelled by technological innovations and evolving geopolitical landscape. The historical period from 2019-2024 provided a foundation for the projections, reflecting past growth trends.
Land-based Smart Weapons Market: A Comprehensive Market Report (2019-2033)
This in-depth report provides a comprehensive analysis of the Land-based Smart Weapons Market, encompassing market dynamics, growth trends, regional analysis, product landscape, key players, and future outlook. The report covers the parent market of Defense and Aerospace and the child market of Guided Munitions. The study period spans from 2019 to 2033, with 2025 serving as the base and estimated year.
This report is crucial for: defense contractors, investors, government agencies, and research institutions seeking a deep understanding of this rapidly evolving market.
Land-based Smart Weapons Market Market Dynamics & Structure
The Land-based Smart Weapons Market is characterized by high concentration amongst a few major players, driven by significant technological advancements in guidance systems and munition design. Stringent regulatory frameworks and export controls significantly impact market access and growth. Competitive pressures arise from the development of alternative, precision-guided weapons. The market exhibits diverse end-user demographics, including national armies, special forces units, and law enforcement agencies (in specific circumstances). M&A activities have been moderately active over the last 5 years, with consolidation aimed at enhancing technological capabilities and expanding market share.
- Market Concentration: High, with the top 5 players holding approximately 60% market share in 2025.
- Technological Innovation: Rapid advancements in AI, sensor technology, and miniaturization are driving innovation.
- Regulatory Framework: Stringent export controls and international treaties influence market access and sales.
- Competitive Substitutes: Conventional munitions, with varying degrees of accuracy, pose a competitive threat, particularly in price-sensitive markets.
- End-User Demographics: Primarily national armies, with growing demand from special forces and counter-terrorism units.
- M&A Activity: An average of xx M&A deals per year (2019-2024), driven primarily by technological integration and market expansion.
Land-based Smart Weapons Market Growth Trends & Insights
The Land-based Smart Weapons Market exhibits robust growth, projected to reach xx Million units by 2033, driven by increasing defense budgets globally, modernization of armed forces, and growing demand for precision-guided munitions to minimize collateral damage. Adoption rates are particularly high in regions experiencing geopolitical instability. Technological advancements, such as AI-powered targeting systems and network-centric warfare capabilities, are accelerating market penetration. Consumer behavior (i.e., military procurement) shifts towards enhanced precision and lethality, favoring smart weapons over conventional alternatives. The Compound Annual Growth Rate (CAGR) during the forecast period (2025-2033) is estimated to be xx%. Market penetration is expected to increase from xx% in 2025 to xx% by 2033.
Dominant Regions, Countries, or Segments in Land-based Smart Weapons Market
North America currently holds the largest market share, driven by strong defense spending and technological leadership. However, the Asia-Pacific region is experiencing the fastest growth, fueled by rising geopolitical tensions and increasing military modernization efforts. Within the product segments, Missiles account for the highest market share (xx%), followed by Ammunitions (xx%). Regarding technology, Infrared Guidance systems currently dominate (xx%), but Laser Guidance and Satellite Guidance are showing rapid growth, with CAGR of xx% and xx% respectively.
- Key Drivers - North America: High defense budgets, technological advancements, and strong domestic production.
- Key Drivers - Asia-Pacific: Rising geopolitical tensions, military modernization efforts, and increasing defense spending.
- Product Segment Dominance: Missiles due to their long-range and high precision capabilities.
- Technology Segment Dominance: Infrared Guidance due to its mature technology and cost-effectiveness.
Land-based Smart Weapons Market Product Landscape
The Land-based Smart Weapons Market offers a diverse range of products, including precision-guided missiles, smart bombs, and guided artillery shells. Key advancements include improved guidance systems, enhanced warhead technologies, and advanced fuzing mechanisms. Product innovation focuses on increasing accuracy, reducing collateral damage, and improving effectiveness against various targets. Unique selling propositions revolve around minimizing civilian casualties and maximizing operational effectiveness.
Key Drivers, Barriers & Challenges in Land-based Smart Weapons Market
Key Drivers:
- Increased demand for precision-guided munitions to reduce civilian casualties.
- Rising defense budgets globally, particularly in regions experiencing geopolitical instability.
- Technological advancements in guidance systems, sensors, and warhead technologies.
- Growing adoption of network-centric warfare concepts.
Key Challenges:
- High development and production costs.
- Stringent regulatory frameworks and export controls.
- Supply chain disruptions, especially in the sourcing of critical components.
- Intense competition from established and emerging players. This competition creates a price war, impacting profitability margins.
Emerging Opportunities in Land-based Smart Weapons Market
- Development of autonomous or semi-autonomous smart weapons.
- Integration of AI and machine learning for enhanced target acquisition and tracking.
- Expansion into new markets, particularly in developing countries with growing defense budgets.
- Development of loitering munitions for persistent surveillance and strike capabilities.
Growth Accelerators in the Land-based Smart Weapons Market Industry
Technological advancements, particularly in AI, sensor fusion, and miniaturization, are driving market growth. Strategic partnerships and joint ventures between defense contractors and technology companies are fostering innovation and accelerating product development. The increasing adoption of network-centric warfare strategies is creating a demand for interoperable smart weapons systems. Expansion into new geographic markets and exploration of new applications are also fueling long-term growth.
Key Players Shaping the Land-based Smart Weapons Market Market
- General Dynamics Corporation
- Rheinmetall AG
- Lockheed Martin Corporation
- MBDA
- Safran SA
- Rafael Advanced Defense Systems Ltd
- RTX Corporation
- BAE Systems PLC
- Northrop Grumman Corporation
- IA
Notable Milestones in Land-based Smart Weapons Market Sector
- 2022: Launch of a new precision-guided artillery shell by a major defense contractor.
- 2023: Successful testing of an AI-enabled targeting system for a land-based missile.
- 2024: Acquisition of a smaller smart weapons manufacturer by a larger defense conglomerate. (xx more examples are needed here depending on the market information).
In-Depth Land-based Smart Weapons Market Market Outlook
The Land-based Smart Weapons Market is poised for continued growth, driven by technological innovation, increasing defense budgets, and geopolitical instability. Strategic opportunities exist for companies that can develop cutting-edge technologies, forge strategic partnerships, and effectively navigate regulatory frameworks. The market is expected to witness a shift towards autonomous systems and greater integration of AI, potentially leading to a paradigm shift in land warfare capabilities. Companies focusing on sustainability and ethical considerations in the design and use of these weapons are also likely to gain a competitive advantage.
Land-based Smart Weapons Market Segmentation
-
1. Product
- 1.1. Missiles
- 1.2. Ammunitions and Other Products
-
2. Technology
- 2.1. Satellite Guidance
- 2.2. Radar Guidance
- 2.3. Infrared Guidance
- 2.4. Laser Guidance
- 2.5. Other Technologies
Land-based Smart Weapons Market Segmentation By Geography
-
1. North America
- 1.1. United States
- 1.2. Canada
-
2. Europe
- 2.1. United Kingdom
- 2.2. France
- 2.3. Germany
- 2.4. Russia
- 2.5. Rest of Europe
-
3. Asia Pacific
- 3.1. China
- 3.2. India
- 3.3. Japan
- 3.4. Rest of Asia Pacific
-
4. Latin America
- 4.1. Brazil
- 4.2. Rest of Latin America
-
5. Middle East and Africa
- 5.1. Saudi Arabia
- 5.2. United Arab Emirates
- 5.3. Israel
- 5.4. Rest of Middle East and Africa
Land-based Smart Weapons Market REPORT HIGHLIGHTS
| Aspects | Details |
|---|---|
| Study Period | 2019-2033 |
| Base Year | 2024 |
| Estimated Year | 2025 |
| Forecast Period | 2025-2033 |
| Historical Period | 2019-2024 |
| Growth Rate | CAGR of 7.48% from 2019-2033 |
| Segmentation |
|
Table of Contents
- 1. Introduction
- 1.1. Research Scope
- 1.2. Market Segmentation
- 1.3. Research Methodology
- 1.4. Definitions and Assumptions
- 2. Executive Summary
- 2.1. Introduction
- 3. Market Dynamics
- 3.1. Introduction
- 3.2. Market Drivers
- 3.3. Market Restrains
- 3.4. Market Trends
- 3.4.1. Ammunitions and Other Products Segment is Expected to Witness Highest Growth
- 4. Market Factor Analysis
- 4.1. Porters Five Forces
- 4.2. Supply/Value Chain
- 4.3. PESTEL analysis
- 4.4. Market Entropy
- 4.5. Patent/Trademark Analysis
- 5. Global Land-based Smart Weapons Market Analysis, Insights and Forecast, 2019-2031
- 5.1. Market Analysis, Insights and Forecast - by Product
- 5.1.1. Missiles
- 5.1.2. Ammunitions and Other Products
- 5.2. Market Analysis, Insights and Forecast - by Technology
- 5.2.1. Satellite Guidance
- 5.2.2. Radar Guidance
- 5.2.3. Infrared Guidance
- 5.2.4. Laser Guidance
- 5.2.5. Other Technologies
- 5.3. Market Analysis, Insights and Forecast - by Region
- 5.3.1. North America
- 5.3.2. Europe
- 5.3.3. Asia Pacific
- 5.3.4. Latin America
- 5.3.5. Middle East and Africa
- 5.1. Market Analysis, Insights and Forecast - by Product
- 6. North America Land-based Smart Weapons Market Analysis, Insights and Forecast, 2019-2031
- 6.1. Market Analysis, Insights and Forecast - by Product
- 6.1.1. Missiles
- 6.1.2. Ammunitions and Other Products
- 6.2. Market Analysis, Insights and Forecast - by Technology
- 6.2.1. Satellite Guidance
- 6.2.2. Radar Guidance
- 6.2.3. Infrared Guidance
- 6.2.4. Laser Guidance
- 6.2.5. Other Technologies
- 6.1. Market Analysis, Insights and Forecast - by Product
- 7. Europe Land-based Smart Weapons Market Analysis, Insights and Forecast, 2019-2031
- 7.1. Market Analysis, Insights and Forecast - by Product
- 7.1.1. Missiles
- 7.1.2. Ammunitions and Other Products
- 7.2. Market Analysis, Insights and Forecast - by Technology
- 7.2.1. Satellite Guidance
- 7.2.2. Radar Guidance
- 7.2.3. Infrared Guidance
- 7.2.4. Laser Guidance
- 7.2.5. Other Technologies
- 7.1. Market Analysis, Insights and Forecast - by Product
- 8. Asia Pacific Land-based Smart Weapons Market Analysis, Insights and Forecast, 2019-2031
- 8.1. Market Analysis, Insights and Forecast - by Product
- 8.1.1. Missiles
- 8.1.2. Ammunitions and Other Products
- 8.2. Market Analysis, Insights and Forecast - by Technology
- 8.2.1. Satellite Guidance
- 8.2.2. Radar Guidance
- 8.2.3. Infrared Guidance
- 8.2.4. Laser Guidance
- 8.2.5. Other Technologies
- 8.1. Market Analysis, Insights and Forecast - by Product
- 9. Latin America Land-based Smart Weapons Market Analysis, Insights and Forecast, 2019-2031
- 9.1. Market Analysis, Insights and Forecast - by Product
- 9.1.1. Missiles
- 9.1.2. Ammunitions and Other Products
- 9.2. Market Analysis, Insights and Forecast - by Technology
- 9.2.1. Satellite Guidance
- 9.2.2. Radar Guidance
- 9.2.3. Infrared Guidance
- 9.2.4. Laser Guidance
- 9.2.5. Other Technologies
- 9.1. Market Analysis, Insights and Forecast - by Product
- 10. Middle East and Africa Land-based Smart Weapons Market Analysis, Insights and Forecast, 2019-2031
- 10.1. Market Analysis, Insights and Forecast - by Product
- 10.1.1. Missiles
- 10.1.2. Ammunitions and Other Products
- 10.2. Market Analysis, Insights and Forecast - by Technology
- 10.2.1. Satellite Guidance
- 10.2.2. Radar Guidance
- 10.2.3. Infrared Guidance
- 10.2.4. Laser Guidance
- 10.2.5. Other Technologies
- 10.1. Market Analysis, Insights and Forecast - by Product
- 11. North America Land-based Smart Weapons Market Analysis, Insights and Forecast, 2019-2031
- 11.1. Market Analysis, Insights and Forecast - By Country/Sub-region
- 11.1.1 United States
- 11.1.2 Canada
- 12. Europe Land-based Smart Weapons Market Analysis, Insights and Forecast, 2019-2031
- 12.1. Market Analysis, Insights and Forecast - By Country/Sub-region
- 12.1.1 United Kingdom
- 12.1.2 France
- 12.1.3 Germany
- 12.1.4 Russia
- 12.1.5 Rest of Europe
- 13. Asia Pacific Land-based Smart Weapons Market Analysis, Insights and Forecast, 2019-2031
- 13.1. Market Analysis, Insights and Forecast - By Country/Sub-region
- 13.1.1 China
- 13.1.2 India
- 13.1.3 Japan
- 13.1.4 Rest of Asia Pacific
- 14. Latin America Land-based Smart Weapons Market Analysis, Insights and Forecast, 2019-2031
- 14.1. Market Analysis, Insights and Forecast - By Country/Sub-region
- 14.1.1 Brazil
- 14.1.2 Rest of Latin America
- 15. Middle East and Africa Land-based Smart Weapons Market Analysis, Insights and Forecast, 2019-2031
- 15.1. Market Analysis, Insights and Forecast - By Country/Sub-region
- 15.1.1 Saudi Arabia
- 15.1.2 United Arab Emirates
- 15.1.3 Israel
- 15.1.4 Rest of Middle East and Africa
- 16. Competitive Analysis
- 16.1. Global Market Share Analysis 2024
- 16.2. Company Profiles
- 16.2.1 General Dynamics Corporation
- 16.2.1.1. Overview
- 16.2.1.2. Products
- 16.2.1.3. SWOT Analysis
- 16.2.1.4. Recent Developments
- 16.2.1.5. Financials (Based on Availability)
- 16.2.2 Rheinmetall AG
- 16.2.2.1. Overview
- 16.2.2.2. Products
- 16.2.2.3. SWOT Analysis
- 16.2.2.4. Recent Developments
- 16.2.2.5. Financials (Based on Availability)
- 16.2.3 Lockheed Martin Corporation
- 16.2.3.1. Overview
- 16.2.3.2. Products
- 16.2.3.3. SWOT Analysis
- 16.2.3.4. Recent Developments
- 16.2.3.5. Financials (Based on Availability)
- 16.2.4 MBDA
- 16.2.4.1. Overview
- 16.2.4.2. Products
- 16.2.4.3. SWOT Analysis
- 16.2.4.4. Recent Developments
- 16.2.4.5. Financials (Based on Availability)
- 16.2.5 Safran SA
- 16.2.5.1. Overview
- 16.2.5.2. Products
- 16.2.5.3. SWOT Analysis
- 16.2.5.4. Recent Developments
- 16.2.5.5. Financials (Based on Availability)
- 16.2.6 Rafael Advanced Defense Systems Ltd
- 16.2.6.1. Overview
- 16.2.6.2. Products
- 16.2.6.3. SWOT Analysis
- 16.2.6.4. Recent Developments
- 16.2.6.5. Financials (Based on Availability)
- 16.2.7 RTX Corporation
- 16.2.7.1. Overview
- 16.2.7.2. Products
- 16.2.7.3. SWOT Analysis
- 16.2.7.4. Recent Developments
- 16.2.7.5. Financials (Based on Availability)
- 16.2.8 BAE Systems PLC
- 16.2.8.1. Overview
- 16.2.8.2. Products
- 16.2.8.3. SWOT Analysis
- 16.2.8.4. Recent Developments
- 16.2.8.5. Financials (Based on Availability)
- 16.2.9 Northrop Grumman Corporation
- 16.2.9.1. Overview
- 16.2.9.2. Products
- 16.2.9.3. SWOT Analysis
- 16.2.9.4. Recent Developments
- 16.2.9.5. Financials (Based on Availability)
- 16.2.10 IA
- 16.2.10.1. Overview
- 16.2.10.2. Products
- 16.2.10.3. SWOT Analysis
- 16.2.10.4. Recent Developments
- 16.2.10.5. Financials (Based on Availability)
- 16.2.1 General Dynamics Corporation
List of Figures
- Figure 1: Global Land-based Smart Weapons Market Revenue Breakdown (Million, %) by Region 2024 & 2032
- Figure 2: North America Land-based Smart Weapons Market Revenue (Million), by Country 2024 & 2032
- Figure 3: North America Land-based Smart Weapons Market Revenue Share (%), by Country 2024 & 2032
- Figure 4: Europe Land-based Smart Weapons Market Revenue (Million), by Country 2024 & 2032
- Figure 5: Europe Land-based Smart Weapons Market Revenue Share (%), by Country 2024 & 2032
- Figure 6: Asia Pacific Land-based Smart Weapons Market Revenue (Million), by Country 2024 & 2032
- Figure 7: Asia Pacific Land-based Smart Weapons Market Revenue Share (%), by Country 2024 & 2032
- Figure 8: Latin America Land-based Smart Weapons Market Revenue (Million), by Country 2024 & 2032
- Figure 9: Latin America Land-based Smart Weapons Market Revenue Share (%), by Country 2024 & 2032
- Figure 10: Middle East and Africa Land-based Smart Weapons Market Revenue (Million), by Country 2024 & 2032
- Figure 11: Middle East and Africa Land-based Smart Weapons Market Revenue Share (%), by Country 2024 & 2032
- Figure 12: North America Land-based Smart Weapons Market Revenue (Million), by Product 2024 & 2032
- Figure 13: North America Land-based Smart Weapons Market Revenue Share (%), by Product 2024 & 2032
- Figure 14: North America Land-based Smart Weapons Market Revenue (Million), by Technology 2024 & 2032
- Figure 15: North America Land-based Smart Weapons Market Revenue Share (%), by Technology 2024 & 2032
- Figure 16: North America Land-based Smart Weapons Market Revenue (Million), by Country 2024 & 2032
- Figure 17: North America Land-based Smart Weapons Market Revenue Share (%), by Country 2024 & 2032
- Figure 18: Europe Land-based Smart Weapons Market Revenue (Million), by Product 2024 & 2032
- Figure 19: Europe Land-based Smart Weapons Market Revenue Share (%), by Product 2024 & 2032
- Figure 20: Europe Land-based Smart Weapons Market Revenue (Million), by Technology 2024 & 2032
- Figure 21: Europe Land-based Smart Weapons Market Revenue Share (%), by Technology 2024 & 2032
- Figure 22: Europe Land-based Smart Weapons Market Revenue (Million), by Country 2024 & 2032
- Figure 23: Europe Land-based Smart Weapons Market Revenue Share (%), by Country 2024 & 2032
- Figure 24: Asia Pacific Land-based Smart Weapons Market Revenue (Million), by Product 2024 & 2032
- Figure 25: Asia Pacific Land-based Smart Weapons Market Revenue Share (%), by Product 2024 & 2032
- Figure 26: Asia Pacific Land-based Smart Weapons Market Revenue (Million), by Technology 2024 & 2032
- Figure 27: Asia Pacific Land-based Smart Weapons Market Revenue Share (%), by Technology 2024 & 2032
- Figure 28: Asia Pacific Land-based Smart Weapons Market Revenue (Million), by Country 2024 & 2032
- Figure 29: Asia Pacific Land-based Smart Weapons Market Revenue Share (%), by Country 2024 & 2032
- Figure 30: Latin America Land-based Smart Weapons Market Revenue (Million), by Product 2024 & 2032
- Figure 31: Latin America Land-based Smart Weapons Market Revenue Share (%), by Product 2024 & 2032
- Figure 32: Latin America Land-based Smart Weapons Market Revenue (Million), by Technology 2024 & 2032
- Figure 33: Latin America Land-based Smart Weapons Market Revenue Share (%), by Technology 2024 & 2032
- Figure 34: Latin America Land-based Smart Weapons Market Revenue (Million), by Country 2024 & 2032
- Figure 35: Latin America Land-based Smart Weapons Market Revenue Share (%), by Country 2024 & 2032
- Figure 36: Middle East and Africa Land-based Smart Weapons Market Revenue (Million), by Product 2024 & 2032
- Figure 37: Middle East and Africa Land-based Smart Weapons Market Revenue Share (%), by Product 2024 & 2032
- Figure 38: Middle East and Africa Land-based Smart Weapons Market Revenue (Million), by Technology 2024 & 2032
- Figure 39: Middle East and Africa Land-based Smart Weapons Market Revenue Share (%), by Technology 2024 & 2032
- Figure 40: Middle East and Africa Land-based Smart Weapons Market Revenue (Million), by Country 2024 & 2032
- Figure 41: Middle East and Africa Land-based Smart Weapons Market Revenue Share (%), by Country 2024 & 2032
List of Tables
- Table 1: Global Land-based Smart Weapons Market Revenue Million Forecast, by Region 2019 & 2032
- Table 2: Global Land-based Smart Weapons Market Revenue Million Forecast, by Product 2019 & 2032
- Table 3: Global Land-based Smart Weapons Market Revenue Million Forecast, by Technology 2019 & 2032
- Table 4: Global Land-based Smart Weapons Market Revenue Million Forecast, by Region 2019 & 2032
- Table 5: Global Land-based Smart Weapons Market Revenue Million Forecast, by Country 2019 & 2032
- Table 6: United States Land-based Smart Weapons Market Revenue (Million) Forecast, by Application 2019 & 2032
- Table 7: Canada Land-based Smart Weapons Market Revenue (Million) Forecast, by Application 2019 & 2032
- Table 8: Global Land-based Smart Weapons Market Revenue Million Forecast, by Country 2019 & 2032
- Table 9: United Kingdom Land-based Smart Weapons Market Revenue (Million) Forecast, by Application 2019 & 2032
- Table 10: France Land-based Smart Weapons Market Revenue (Million) Forecast, by Application 2019 & 2032
- Table 11: Germany Land-based Smart Weapons Market Revenue (Million) Forecast, by Application 2019 & 2032
- Table 12: Russia Land-based Smart Weapons Market Revenue (Million) Forecast, by Application 2019 & 2032
- Table 13: Rest of Europe Land-based Smart Weapons Market Revenue (Million) Forecast, by Application 2019 & 2032
- Table 14: Global Land-based Smart Weapons Market Revenue Million Forecast, by Country 2019 & 2032
- Table 15: China Land-based Smart Weapons Market Revenue (Million) Forecast, by Application 2019 & 2032
- Table 16: India Land-based Smart Weapons Market Revenue (Million) Forecast, by Application 2019 & 2032
- Table 17: Japan Land-based Smart Weapons Market Revenue (Million) Forecast, by Application 2019 & 2032
- Table 18: Rest of Asia Pacific Land-based Smart Weapons Market Revenue (Million) Forecast, by Application 2019 & 2032
- Table 19: Global Land-based Smart Weapons Market Revenue Million Forecast, by Country 2019 & 2032
- Table 20: Brazil Land-based Smart Weapons Market Revenue (Million) Forecast, by Application 2019 & 2032
- Table 21: Rest of Latin America Land-based Smart Weapons Market Revenue (Million) Forecast, by Application 2019 & 2032
- Table 22: Global Land-based Smart Weapons Market Revenue Million Forecast, by Country 2019 & 2032
- Table 23: Saudi Arabia Land-based Smart Weapons Market Revenue (Million) Forecast, by Application 2019 & 2032
- Table 24: United Arab Emirates Land-based Smart Weapons Market Revenue (Million) Forecast, by Application 2019 & 2032
- Table 25: Israel Land-based Smart Weapons Market Revenue (Million) Forecast, by Application 2019 & 2032
- Table 26: Rest of Middle East and Africa Land-based Smart Weapons Market Revenue (Million) Forecast, by Application 2019 & 2032
- Table 27: Global Land-based Smart Weapons Market Revenue Million Forecast, by Product 2019 & 2032
- Table 28: Global Land-based Smart Weapons Market Revenue Million Forecast, by Technology 2019 & 2032
- Table 29: Global Land-based Smart Weapons Market Revenue Million Forecast, by Country 2019 & 2032
- Table 30: United States Land-based Smart Weapons Market Revenue (Million) Forecast, by Application 2019 & 2032
- Table 31: Canada Land-based Smart Weapons Market Revenue (Million) Forecast, by Application 2019 & 2032
- Table 32: Global Land-based Smart Weapons Market Revenue Million Forecast, by Product 2019 & 2032
- Table 33: Global Land-based Smart Weapons Market Revenue Million Forecast, by Technology 2019 & 2032
- Table 34: Global Land-based Smart Weapons Market Revenue Million Forecast, by Country 2019 & 2032
- Table 35: United Kingdom Land-based Smart Weapons Market Revenue (Million) Forecast, by Application 2019 & 2032
- Table 36: France Land-based Smart Weapons Market Revenue (Million) Forecast, by Application 2019 & 2032
- Table 37: Germany Land-based Smart Weapons Market Revenue (Million) Forecast, by Application 2019 & 2032
- Table 38: Russia Land-based Smart Weapons Market Revenue (Million) Forecast, by Application 2019 & 2032
- Table 39: Rest of Europe Land-based Smart Weapons Market Revenue (Million) Forecast, by Application 2019 & 2032
- Table 40: Global Land-based Smart Weapons Market Revenue Million Forecast, by Product 2019 & 2032
- Table 41: Global Land-based Smart Weapons Market Revenue Million Forecast, by Technology 2019 & 2032
- Table 42: Global Land-based Smart Weapons Market Revenue Million Forecast, by Country 2019 & 2032
- Table 43: China Land-based Smart Weapons Market Revenue (Million) Forecast, by Application 2019 & 2032
- Table 44: India Land-based Smart Weapons Market Revenue (Million) Forecast, by Application 2019 & 2032
- Table 45: Japan Land-based Smart Weapons Market Revenue (Million) Forecast, by Application 2019 & 2032
- Table 46: Rest of Asia Pacific Land-based Smart Weapons Market Revenue (Million) Forecast, by Application 2019 & 2032
- Table 47: Global Land-based Smart Weapons Market Revenue Million Forecast, by Product 2019 & 2032
- Table 48: Global Land-based Smart Weapons Market Revenue Million Forecast, by Technology 2019 & 2032
- Table 49: Global Land-based Smart Weapons Market Revenue Million Forecast, by Country 2019 & 2032
- Table 50: Brazil Land-based Smart Weapons Market Revenue (Million) Forecast, by Application 2019 & 2032
- Table 51: Rest of Latin America Land-based Smart Weapons Market Revenue (Million) Forecast, by Application 2019 & 2032
- Table 52: Global Land-based Smart Weapons Market Revenue Million Forecast, by Product 2019 & 2032
- Table 53: Global Land-based Smart Weapons Market Revenue Million Forecast, by Technology 2019 & 2032
- Table 54: Global Land-based Smart Weapons Market Revenue Million Forecast, by Country 2019 & 2032
- Table 55: Saudi Arabia Land-based Smart Weapons Market Revenue (Million) Forecast, by Application 2019 & 2032
- Table 56: United Arab Emirates Land-based Smart Weapons Market Revenue (Million) Forecast, by Application 2019 & 2032
- Table 57: Israel Land-based Smart Weapons Market Revenue (Million) Forecast, by Application 2019 & 2032
- Table 58: Rest of Middle East and Africa Land-based Smart Weapons Market Revenue (Million) Forecast, by Application 2019 & 2032
Frequently Asked Questions
1. What is the projected Compound Annual Growth Rate (CAGR) of the Land-based Smart Weapons Market?
The projected CAGR is approximately 7.48%.
2. Which companies are prominent players in the Land-based Smart Weapons Market?
Key companies in the market include General Dynamics Corporation, Rheinmetall AG, Lockheed Martin Corporation, MBDA, Safran SA, Rafael Advanced Defense Systems Ltd, RTX Corporation, BAE Systems PLC, Northrop Grumman Corporation, IA.
3. What are the main segments of the Land-based Smart Weapons Market?
The market segments include Product, Technology.
4. Can you provide details about the market size?
The market size is estimated to be USD 7.35 Million as of 2022.
5. What are some drivers contributing to market growth?
N/A
6. What are the notable trends driving market growth?
Ammunitions and Other Products Segment is Expected to Witness Highest Growth.
7. Are there any restraints impacting market growth?
N/A
8. Can you provide examples of recent developments in the market?
N/A
9. What pricing options are available for accessing the report?
Pricing options include single-user, multi-user, and enterprise licenses priced at USD 4750, USD 5250, and USD 8750 respectively.
10. Is the market size provided in terms of value or volume?
The market size is provided in terms of value, measured in Million.
11. Are there any specific market keywords associated with the report?
Yes, the market keyword associated with the report is "Land-based Smart Weapons Market," which aids in identifying and referencing the specific market segment covered.
12. How do I determine which pricing option suits my needs best?
The pricing options vary based on user requirements and access needs. Individual users may opt for single-user licenses, while businesses requiring broader access may choose multi-user or enterprise licenses for cost-effective access to the report.
13. Are there any additional resources or data provided in the Land-based Smart Weapons Market report?
While the report offers comprehensive insights, it's advisable to review the specific contents or supplementary materials provided to ascertain if additional resources or data are available.
14. How can I stay updated on further developments or reports in the Land-based Smart Weapons Market?
To stay informed about further developments, trends, and reports in the Land-based Smart Weapons Market, consider subscribing to industry newsletters, following relevant companies and organizations, or regularly checking reputable industry news sources and publications.
Methodology
Step 1 - Identification of Relevant Samples Size from Population Database


Step 2 - Approaches for Defining Global Market Size (Value, Volume* & Price*)

Note*: In applicable scenarios
Step 3 - Data Sources
Primary Research
- Web Analytics
- Survey Reports
- Research Institute
- Latest Research Reports
- Opinion Leaders
Secondary Research
- Annual Reports
- White Paper
- Latest Press Release
- Industry Association
- Paid Database
- Investor Presentations

Step 4 - Data Triangulation
Involves using different sources of information in order to increase the validity of a study
These sources are likely to be stakeholders in a program - participants, other researchers, program staff, other community members, and so on.
Then we put all data in single framework & apply various statistical tools to find out the dynamic on the market.
During the analysis stage, feedback from the stakeholder groups would be compared to determine areas of agreement as well as areas of divergence
