

Key Insights
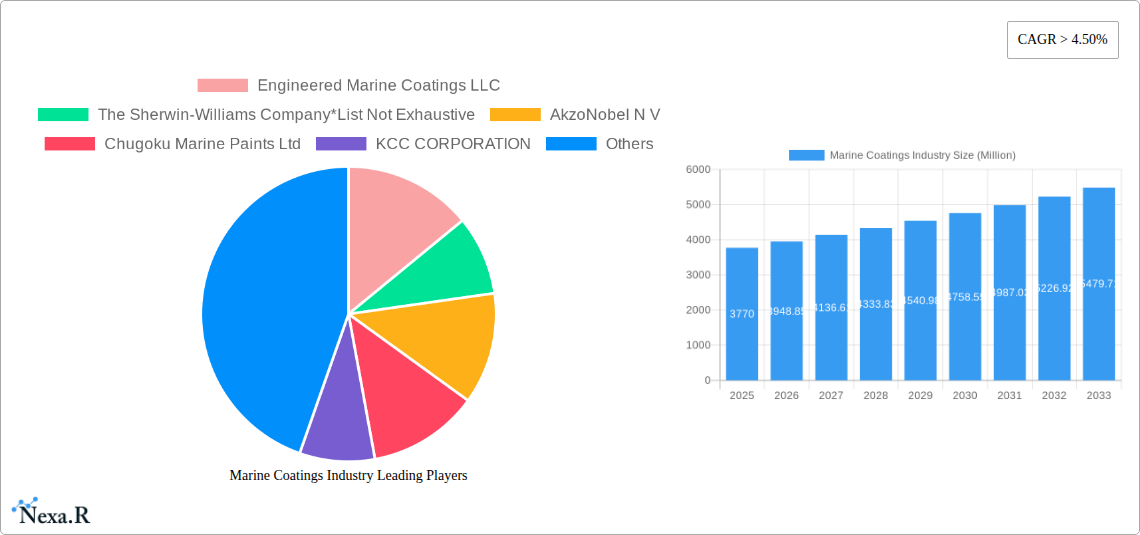
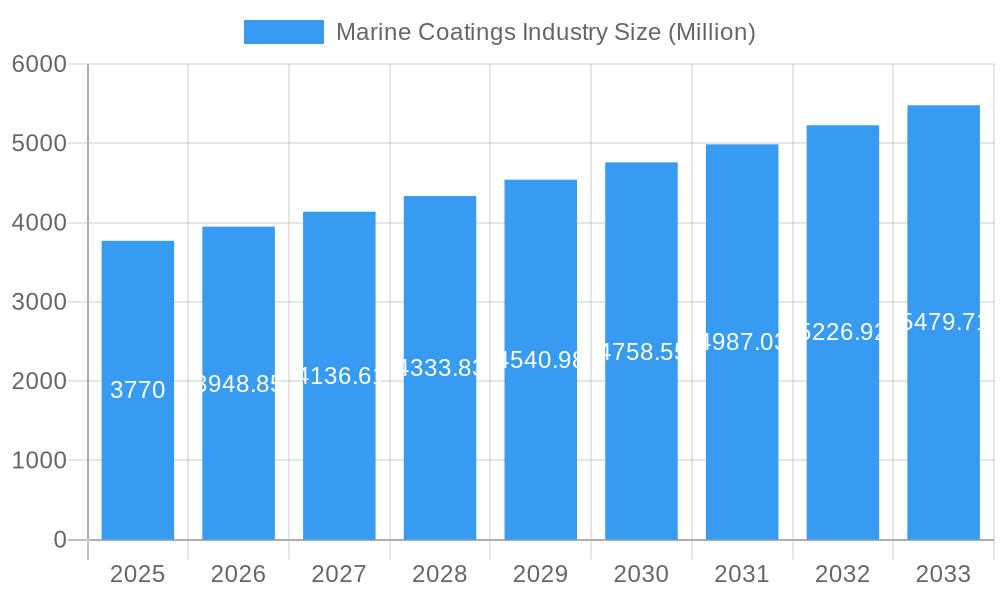
The global marine coatings market, valued at $3.77 billion in 2025, is projected to experience robust growth, exhibiting a compound annual growth rate (CAGR) exceeding 4.5% from 2025 to 2033. This expansion is fueled by several key drivers. The increasing demand for new shipbuilding, particularly in the container and cruise ship segments, significantly contributes to market growth. Stringent environmental regulations promoting the adoption of eco-friendly water-borne and UV-cured coatings further stimulate market expansion. Moreover, the growing awareness of corrosion and biofouling prevention, coupled with the need for enhanced vessel longevity, drives demand for high-performance marine coatings. The market is segmented by type (anti-corrosion, anti-fouling, and others like foul release and moisture cure), resin (epoxy, polyurethane, acrylic, alkyd, and others), technology (water-borne, solvent-borne, UV-cured, and powder coatings), and application (marine OEM and aftermarket). The Asia-Pacific region, driven by significant shipbuilding activities in China, India, and South Korea, is expected to dominate the market, followed by North America and Europe.
Marine Coatings Industry Market Size (In Billion)
Competition within the marine coatings industry is intense, with major players like AkzoNobel, Jotun, Sherwin-Williams, and Nippon Paint holding significant market share. However, smaller, specialized companies focusing on niche applications or innovative technologies are also emerging and contributing to the market's dynamism. While the market faces restraints such as fluctuating raw material prices and potential economic downturns impacting shipbuilding activities, the long-term outlook remains positive. The continued focus on sustainability, technological advancements in coating formulations, and the increasing global maritime trade are expected to drive sustained market growth throughout the forecast period. The shift towards more durable and environmentally friendly coatings will continue to shape market trends, creating opportunities for manufacturers that can successfully adapt to evolving regulations and customer demands.
Marine Coatings Industry Company Market Share
Marine Coatings Industry Market Report: 2019-2033
This comprehensive report provides an in-depth analysis of the global marine coatings market, covering historical data (2019-2024), the base year (2025), and a detailed forecast (2025-2033). We analyze market dynamics, growth trends, leading players, and emerging opportunities within this crucial sector, providing invaluable insights for industry professionals, investors, and strategic decision-makers. The market is segmented by type (anti-corrosion, antifouling, other types), resin (epoxy, polyurethane, acrylic, alkyd, others), technology (water-borne, solvent-borne, UV-cured, powder coatings), and application (marine OEM, marine aftermarket). The total market value in 2025 is estimated at xx Million.
Marine Coatings Industry Market Dynamics & Structure
The global marine coatings market is characterized by moderate concentration, with several key players holding significant market share. The market size in 2025 is projected at xx Million. Technological innovation, driven by stricter environmental regulations and the demand for enhanced performance, is a primary growth driver. Stringent international and regional regulations regarding VOC emissions and biofouling are reshaping the industry landscape. Competition from substitute materials and coatings is also a factor to consider. The market witnesses frequent M&A activity, with larger companies acquiring smaller specialized firms to expand their product portfolios and geographical reach.
- Market Concentration: Moderately concentrated, with top 5 players holding approximately xx% of the market share in 2025.
- Technological Innovation: Focus on developing eco-friendly, high-performance coatings with improved antifouling and anti-corrosion properties.
- Regulatory Framework: Stringent environmental regulations driving demand for low-VOC and biocide-free coatings.
- Competitive Substitutes: Competition from alternative materials and coating technologies.
- End-User Demographics: Significant growth driven by increasing demand from shipbuilding, shipping, and offshore industries.
- M&A Trends: Consistent M&A activity, with xx major deals recorded between 2019 and 2024.
Marine Coatings Industry Growth Trends & Insights
The marine coatings market exhibits steady growth, driven by factors such as the expanding global shipping fleet, increasing demand for new vessels, and the need for regular maintenance and refurbishment of existing ships. The market is projected to witness a CAGR of xx% during the forecast period (2025-2033), reaching xx Million by 2033. Technological advancements, particularly in water-borne and UV-cured coatings, are boosting adoption rates. Shifts in consumer preferences towards environmentally sustainable solutions are also shaping market dynamics. The growing awareness of environmental regulations and the need to reduce carbon footprint is pushing the market towards sustainable solutions.
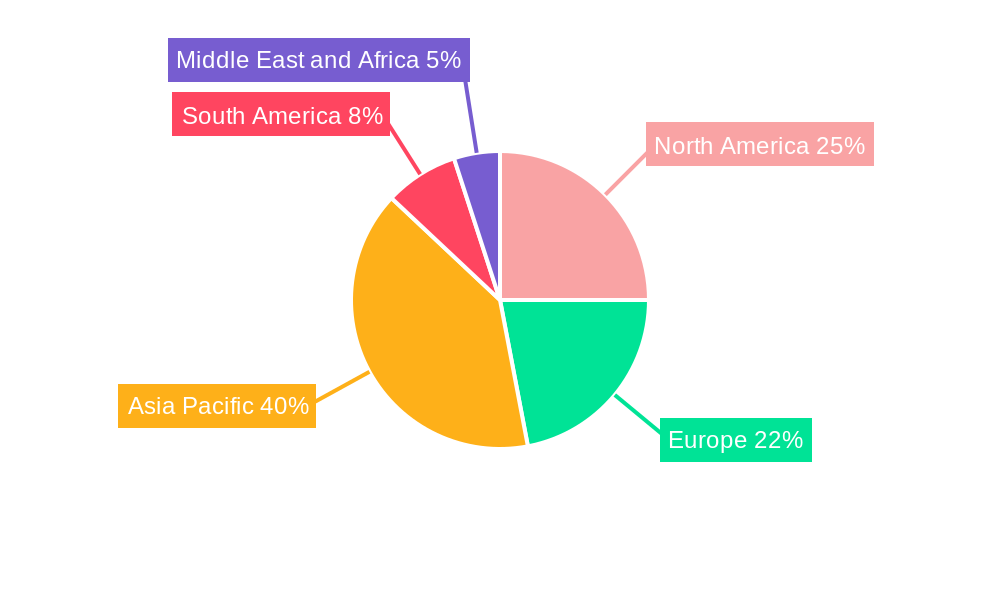
Dominant Regions, Countries, or Segments in Marine Coatings Industry
Asia-Pacific is currently the leading region in the marine coatings market, driven by robust shipbuilding activity and significant investments in infrastructure. Within this region, China and South Korea are key growth drivers. The antifouling segment currently holds the largest market share due to stringent regulations against biofouling and the increasing need to minimize fuel consumption. The epoxy resin segment is a significant contributor due to its excellent anti-corrosion properties. The marine OEM segment dominates the application side due to the large scale of new vessel construction.
- Key Drivers:
- Robust growth in shipbuilding and shipping industries, particularly in Asia-Pacific.
- Stringent environmental regulations promoting the adoption of eco-friendly coatings.
- Increasing demand for high-performance coatings with enhanced durability.
- Dominance Factors:
- High shipbuilding activity in Asia-Pacific.
- Growing awareness of environmental concerns leading to demand for sustainable coatings.
- Favorable government policies and incentives supporting the industry.
Marine Coatings Industry Product Landscape
The marine coatings market showcases a diverse range of products tailored to specific applications and performance requirements. Innovations focus on developing low-VOC, biocide-free antifouling coatings, improved anti-corrosion solutions for harsh marine environments, and coatings with enhanced durability and longevity. Key selling propositions include superior corrosion protection, extended lifespan, reduced maintenance costs, and environmental friendliness. Advancements in resin technology and application methods are driving performance improvements.
Key Drivers, Barriers & Challenges in Marine Coatings Industry
Key Drivers: The growing global shipping fleet, increasing demand for new vessels, stringent environmental regulations promoting eco-friendly coatings, and technological advancements are key drivers. Furthermore, the rising awareness regarding the importance of reducing fuel consumption and carbon emission is encouraging the adoption of high-performance marine coatings.
Key Challenges: Fluctuations in raw material prices, stringent regulatory compliance requirements, intense competition among established players, and supply chain disruptions are significant hurdles. The rising cost of raw materials and the challenges in maintaining a stable supply chain are creating substantial challenges for the marine coatings industry.
Emerging Opportunities in Marine Coatings Industry
Untapped markets in developing economies, the increasing demand for specialized coatings for offshore platforms and renewable energy installations, and the growing focus on sustainable and bio-based solutions present significant opportunities. The development of advanced antifouling technologies with minimal environmental impact represents a crucial area of growth. Focus on customization, digitalization of the application process and expansion into emerging markets are areas poised for significant growth.
Growth Accelerators in the Marine Coatings Industry Industry
Technological advancements, strategic collaborations between coating manufacturers and shipbuilding companies, and the expansion into new geographical markets are driving long-term growth. The focus on developing sustainable coatings which meet stringent environmental regulations is a crucial growth driver. The adoption of digital tools for application and maintenance can lead to significant efficiencies.
Key Players Shaping the Marine Coatings Industry Market
- Engineered Marine Coatings LLC
- The Sherwin-Williams Company
- AkzoNobel N V
- Chugoku Marine Paints Ltd
- KCC CORPORATION
- Jotun
- RPM International Inc
- Kansai Paint Marine Co Ltd
- Pettit Marine Paints
- PPG Industries Inc
- BOERO BARTOLOMEO S p A
- Nippon Paint Marine Coatings Co Ltd
- BASF SE
- Axalta Coating Systems
- Hempel A/S
- MCU COATING INTERNATIONAL
Notable Milestones in Marine Coatings Industry Sector
- March 2023: PPG launched the PPG SIGMAGLIDE 2390 marine coating, focusing on reduced power consumption and lower carbon emissions for shipowners.
- March 2023: Hempel joined the IMO's Global Industry Alliance for Marine Biosafety, aiming to reduce shipping emissions and mitigate invasive species spread.
In-Depth Marine Coatings Industry Market Outlook
The marine coatings market is poised for continued growth, driven by technological advancements, stringent environmental regulations, and expansion into new applications. Strategic partnerships and a focus on sustainable solutions will be key to success in this evolving market. The focus on developing eco-friendly and high-performance products will ensure long-term growth in this dynamic sector. The market presents significant opportunities for companies that can effectively adapt to changing regulatory landscapes and offer innovative solutions.
Marine Coatings Industry Segmentation
-
1. Type
- 1.1. Anti-corrosion
- 1.2. Antifouling
- 1.3. Other Types (Foul Release, Moisture Cure, etc.)
-
2. Resin
- 2.1. Epoxy
- 2.2. Polyurethane
- 2.3. Acrylic
- 2.4. Alkyd
- 2.5. Other Resins (Polyester, Fluoropolymer, etc.)
-
3. Technology
- 3.1. Water-borne
- 3.2. Solvent-borne
- 3.3. UV-cured
- 3.4. Powder Coatings
-
4. Application
- 4.1. Marine OEM
- 4.2. Marine Aftermarket
Marine Coatings Industry Segmentation By Geography
-
1. Asia Pacific
- 1.1. China
- 1.2. India
- 1.3. Japan
- 1.4. South Korea
- 1.5. Malaysia
- 1.6. Vietnam
- 1.7. Rest of Asia Pacific
-
2. North America
- 2.1. United States
- 2.2. Canada
- 2.3. Mexico
-
3. Europe
- 3.1. Germany
- 3.2. United Kingdom
- 3.3. Italy
- 3.4. France
- 3.5. Rest of Europe
-
4. South America
- 4.1. Brazil
- 4.2. Argentina
- 4.3. Rest of South America
-
5. Middle East and Africa
- 5.1. Saudi Arabia
- 5.2. South Africa
- 5.3. Rest of Middle East and Africa
Marine Coatings Industry Regional Market Share
Geographic Coverage of Marine Coatings Industry
Marine Coatings Industry REPORT HIGHLIGHTS
| Aspects | Details |
|---|---|
| Study Period | 2020-2034 |
| Base Year | 2025 |
| Estimated Year | 2026 |
| Forecast Period | 2026-2034 |
| Historical Period | 2020-2025 |
| Growth Rate | CAGR of > 4.50% from 2020-2034 |
| Segmentation |
|
Table of Contents
- 1. Introduction
- 1.1. Research Scope
- 1.2. Market Segmentation
- 1.3. Research Objective
- 1.4. Definitions and Assumptions
- 2. Executive Summary
- 2.1. Market Snapshot
- 3. Market Dynamics
- 3.1. Market Drivers
- 3.2. Market Restrains
- 3.3. Market Trends
- 3.4. Market Opportunities
- 4. Market Factor Analysis
- 4.1. Porters Five Forces
- 4.1.1. Bargaining Power of Suppliers
- 4.1.2. Bargaining Power of Buyers
- 4.1.3. Threat of New Entrants
- 4.1.4. Threat of Substitutes
- 4.1.5. Competitive Rivalry
- 4.2. PESTEL analysis
- 4.3. BCG Analysis
- 4.3.1. Stars (High Growth, High Market Share)
- 4.3.2. Cash Cows (Low Growth, High Market Share)
- 4.3.3. Question Mark (High Growth, Low Market Share)
- 4.3.4. Dogs (Low Growth, Low Market Share)
- 4.4. Ansoff Matrix Analysis
- 4.5. Supply Chain Analysis
- 4.6. Regulatory Landscape
- 4.7. Current Market Potential and Opportunity Assessment (TAM–SAM–SOM Framework)
- 4.8. NRP Analyst Note
- 4.1. Porters Five Forces
- 5. Market Analysis, Insights and Forecast 2021-2033
- 5.1. Market Analysis, Insights and Forecast - by Type
- 5.1.1. Anti-corrosion
- 5.1.2. Antifouling
- 5.1.3. Other Types (Foul Release, Moisture Cure, etc.)
- 5.2. Market Analysis, Insights and Forecast - by Resin
- 5.2.1. Epoxy
- 5.2.2. Polyurethane
- 5.2.3. Acrylic
- 5.2.4. Alkyd
- 5.2.5. Other Resins (Polyester, Fluoropolymer, etc.)
- 5.3. Market Analysis, Insights and Forecast - by Technology
- 5.3.1. Water-borne
- 5.3.2. Solvent-borne
- 5.3.3. UV-cured
- 5.3.4. Powder Coatings
- 5.4. Market Analysis, Insights and Forecast - by Application
- 5.4.1. Marine OEM
- 5.4.2. Marine Aftermarket
- 5.5. Market Analysis, Insights and Forecast - by Region
- 5.5.1. Asia Pacific
- 5.5.2. North America
- 5.5.3. Europe
- 5.5.4. South America
- 5.5.5. Middle East and Africa
- 5.1. Market Analysis, Insights and Forecast - by Type
- 6. Global Marine Coatings Industry Analysis, Insights and Forecast, 2021-2033
- 6.1. Market Analysis, Insights and Forecast - by Type
- 6.1.1. Anti-corrosion
- 6.1.2. Antifouling
- 6.1.3. Other Types (Foul Release, Moisture Cure, etc.)
- 6.2. Market Analysis, Insights and Forecast - by Resin
- 6.2.1. Epoxy
- 6.2.2. Polyurethane
- 6.2.3. Acrylic
- 6.2.4. Alkyd
- 6.2.5. Other Resins (Polyester, Fluoropolymer, etc.)
- 6.3. Market Analysis, Insights and Forecast - by Technology
- 6.3.1. Water-borne
- 6.3.2. Solvent-borne
- 6.3.3. UV-cured
- 6.3.4. Powder Coatings
- 6.4. Market Analysis, Insights and Forecast - by Application
- 6.4.1. Marine OEM
- 6.4.2. Marine Aftermarket
- 6.1. Market Analysis, Insights and Forecast - by Type
- 7. Asia Pacific Marine Coatings Industry Analysis, Insights and Forecast, 2020-2032
- 7.1. Market Analysis, Insights and Forecast - by Type
- 7.1.1. Anti-corrosion
- 7.1.2. Antifouling
- 7.1.3. Other Types (Foul Release, Moisture Cure, etc.)
- 7.2. Market Analysis, Insights and Forecast - by Resin
- 7.2.1. Epoxy
- 7.2.2. Polyurethane
- 7.2.3. Acrylic
- 7.2.4. Alkyd
- 7.2.5. Other Resins (Polyester, Fluoropolymer, etc.)
- 7.3. Market Analysis, Insights and Forecast - by Technology
- 7.3.1. Water-borne
- 7.3.2. Solvent-borne
- 7.3.3. UV-cured
- 7.3.4. Powder Coatings
- 7.4. Market Analysis, Insights and Forecast - by Application
- 7.4.1. Marine OEM
- 7.4.2. Marine Aftermarket
- 7.1. Market Analysis, Insights and Forecast - by Type
- 8. North America Marine Coatings Industry Analysis, Insights and Forecast, 2020-2032
- 8.1. Market Analysis, Insights and Forecast - by Type
- 8.1.1. Anti-corrosion
- 8.1.2. Antifouling
- 8.1.3. Other Types (Foul Release, Moisture Cure, etc.)
- 8.2. Market Analysis, Insights and Forecast - by Resin
- 8.2.1. Epoxy
- 8.2.2. Polyurethane
- 8.2.3. Acrylic
- 8.2.4. Alkyd
- 8.2.5. Other Resins (Polyester, Fluoropolymer, etc.)
- 8.3. Market Analysis, Insights and Forecast - by Technology
- 8.3.1. Water-borne
- 8.3.2. Solvent-borne
- 8.3.3. UV-cured
- 8.3.4. Powder Coatings
- 8.4. Market Analysis, Insights and Forecast - by Application
- 8.4.1. Marine OEM
- 8.4.2. Marine Aftermarket
- 8.1. Market Analysis, Insights and Forecast - by Type
- 9. Europe Marine Coatings Industry Analysis, Insights and Forecast, 2020-2032
- 9.1. Market Analysis, Insights and Forecast - by Type
- 9.1.1. Anti-corrosion
- 9.1.2. Antifouling
- 9.1.3. Other Types (Foul Release, Moisture Cure, etc.)
- 9.2. Market Analysis, Insights and Forecast - by Resin
- 9.2.1. Epoxy
- 9.2.2. Polyurethane
- 9.2.3. Acrylic
- 9.2.4. Alkyd
- 9.2.5. Other Resins (Polyester, Fluoropolymer, etc.)
- 9.3. Market Analysis, Insights and Forecast - by Technology
- 9.3.1. Water-borne
- 9.3.2. Solvent-borne
- 9.3.3. UV-cured
- 9.3.4. Powder Coatings
- 9.4. Market Analysis, Insights and Forecast - by Application
- 9.4.1. Marine OEM
- 9.4.2. Marine Aftermarket
- 9.1. Market Analysis, Insights and Forecast - by Type
- 10. South America Marine Coatings Industry Analysis, Insights and Forecast, 2020-2032
- 10.1. Market Analysis, Insights and Forecast - by Type
- 10.1.1. Anti-corrosion
- 10.1.2. Antifouling
- 10.1.3. Other Types (Foul Release, Moisture Cure, etc.)
- 10.2. Market Analysis, Insights and Forecast - by Resin
- 10.2.1. Epoxy
- 10.2.2. Polyurethane
- 10.2.3. Acrylic
- 10.2.4. Alkyd
- 10.2.5. Other Resins (Polyester, Fluoropolymer, etc.)
- 10.3. Market Analysis, Insights and Forecast - by Technology
- 10.3.1. Water-borne
- 10.3.2. Solvent-borne
- 10.3.3. UV-cured
- 10.3.4. Powder Coatings
- 10.4. Market Analysis, Insights and Forecast - by Application
- 10.4.1. Marine OEM
- 10.4.2. Marine Aftermarket
- 10.1. Market Analysis, Insights and Forecast - by Type
- 11. Middle East and Africa Marine Coatings Industry Analysis, Insights and Forecast, 2020-2032
- 11.1. Market Analysis, Insights and Forecast - by Type
- 11.1.1. Anti-corrosion
- 11.1.2. Antifouling
- 11.1.3. Other Types (Foul Release, Moisture Cure, etc.)
- 11.2. Market Analysis, Insights and Forecast - by Resin
- 11.2.1. Epoxy
- 11.2.2. Polyurethane
- 11.2.3. Acrylic
- 11.2.4. Alkyd
- 11.2.5. Other Resins (Polyester, Fluoropolymer, etc.)
- 11.3. Market Analysis, Insights and Forecast - by Technology
- 11.3.1. Water-borne
- 11.3.2. Solvent-borne
- 11.3.3. UV-cured
- 11.3.4. Powder Coatings
- 11.4. Market Analysis, Insights and Forecast - by Application
- 11.4.1. Marine OEM
- 11.4.2. Marine Aftermarket
- 11.1. Market Analysis, Insights and Forecast - by Type
- 12. Competitive Analysis
- 12.1. Company Profiles
- 12.1.1 Engineered Marine Coatings LLC
- 12.1.1.1. Company Overview
- 12.1.1.2. Products
- 12.1.1.3. Company Financials
- 12.1.1.4. SWOT Analysis
- 12.1.2 The Sherwin-Williams Company*List Not Exhaustive
- 12.1.2.1. Company Overview
- 12.1.2.2. Products
- 12.1.2.3. Company Financials
- 12.1.2.4. SWOT Analysis
- 12.1.3 AkzoNobel N V
- 12.1.3.1. Company Overview
- 12.1.3.2. Products
- 12.1.3.3. Company Financials
- 12.1.3.4. SWOT Analysis
- 12.1.4 Chugoku Marine Paints Ltd
- 12.1.4.1. Company Overview
- 12.1.4.2. Products
- 12.1.4.3. Company Financials
- 12.1.4.4. SWOT Analysis
- 12.1.5 KCC CORPORATION
- 12.1.5.1. Company Overview
- 12.1.5.2. Products
- 12.1.5.3. Company Financials
- 12.1.5.4. SWOT Analysis
- 12.1.6 Jotun
- 12.1.6.1. Company Overview
- 12.1.6.2. Products
- 12.1.6.3. Company Financials
- 12.1.6.4. SWOT Analysis
- 12.1.7 RPM International Inc
- 12.1.7.1. Company Overview
- 12.1.7.2. Products
- 12.1.7.3. Company Financials
- 12.1.7.4. SWOT Analysis
- 12.1.8 Kansai Paint Marine Co Ltd
- 12.1.8.1. Company Overview
- 12.1.8.2. Products
- 12.1.8.3. Company Financials
- 12.1.8.4. SWOT Analysis
- 12.1.9 Pettit Marine Paints
- 12.1.9.1. Company Overview
- 12.1.9.2. Products
- 12.1.9.3. Company Financials
- 12.1.9.4. SWOT Analysis
- 12.1.10 PPG Industries Inc
- 12.1.10.1. Company Overview
- 12.1.10.2. Products
- 12.1.10.3. Company Financials
- 12.1.10.4. SWOT Analysis
- 12.1.11 BOERO BARTOLOMEO S p A
- 12.1.11.1. Company Overview
- 12.1.11.2. Products
- 12.1.11.3. Company Financials
- 12.1.11.4. SWOT Analysis
- 12.1.12 Nippon Paint Marine Coatings Co Ltd
- 12.1.12.1. Company Overview
- 12.1.12.2. Products
- 12.1.12.3. Company Financials
- 12.1.12.4. SWOT Analysis
- 12.1.13 BASF SE
- 12.1.13.1. Company Overview
- 12.1.13.2. Products
- 12.1.13.3. Company Financials
- 12.1.13.4. SWOT Analysis
- 12.1.14 Axalta Coating Systems
- 12.1.14.1. Company Overview
- 12.1.14.2. Products
- 12.1.14.3. Company Financials
- 12.1.14.4. SWOT Analysis
- 12.1.15 Hempel A/S
- 12.1.15.1. Company Overview
- 12.1.15.2. Products
- 12.1.15.3. Company Financials
- 12.1.15.4. SWOT Analysis
- 12.1.16 MCU COATING INTERNATIONAL
- 12.1.16.1. Company Overview
- 12.1.16.2. Products
- 12.1.16.3. Company Financials
- 12.1.16.4. SWOT Analysis
- 12.1.1 Engineered Marine Coatings LLC
- 12.2. Market Entropy
- 12.2.1 Company's Key Areas Served
- 12.2.2 Recent Developments
- 12.3. Company Market Share Analysis 2025
- 12.3.1 Top 5 Companies Market Share Analysis
- 12.3.2 Top 3 Companies Market Share Analysis
- 12.4. List of Potential Customers
- 13. Research Methodology
List of Figures
- Figure 1: Global Marine Coatings Industry Revenue Breakdown (Million, %) by Region 2025 & 2033
- Figure 2: Global Marine Coatings Industry Volume Breakdown (liter , %) by Region 2025 & 2033
- Figure 3: Asia Pacific Marine Coatings Industry Revenue (Million), by Type 2025 & 2033
- Figure 4: Asia Pacific Marine Coatings Industry Volume (liter ), by Type 2025 & 2033
- Figure 5: Asia Pacific Marine Coatings Industry Revenue Share (%), by Type 2025 & 2033
- Figure 6: Asia Pacific Marine Coatings Industry Volume Share (%), by Type 2025 & 2033
- Figure 7: Asia Pacific Marine Coatings Industry Revenue (Million), by Resin 2025 & 2033
- Figure 8: Asia Pacific Marine Coatings Industry Volume (liter ), by Resin 2025 & 2033
- Figure 9: Asia Pacific Marine Coatings Industry Revenue Share (%), by Resin 2025 & 2033
- Figure 10: Asia Pacific Marine Coatings Industry Volume Share (%), by Resin 2025 & 2033
- Figure 11: Asia Pacific Marine Coatings Industry Revenue (Million), by Technology 2025 & 2033
- Figure 12: Asia Pacific Marine Coatings Industry Volume (liter ), by Technology 2025 & 2033
- Figure 13: Asia Pacific Marine Coatings Industry Revenue Share (%), by Technology 2025 & 2033
- Figure 14: Asia Pacific Marine Coatings Industry Volume Share (%), by Technology 2025 & 2033
- Figure 15: Asia Pacific Marine Coatings Industry Revenue (Million), by Application 2025 & 2033
- Figure 16: Asia Pacific Marine Coatings Industry Volume (liter ), by Application 2025 & 2033
- Figure 17: Asia Pacific Marine Coatings Industry Revenue Share (%), by Application 2025 & 2033
- Figure 18: Asia Pacific Marine Coatings Industry Volume Share (%), by Application 2025 & 2033
- Figure 19: Asia Pacific Marine Coatings Industry Revenue (Million), by Country 2025 & 2033
- Figure 20: Asia Pacific Marine Coatings Industry Volume (liter ), by Country 2025 & 2033
- Figure 21: Asia Pacific Marine Coatings Industry Revenue Share (%), by Country 2025 & 2033
- Figure 22: Asia Pacific Marine Coatings Industry Volume Share (%), by Country 2025 & 2033
- Figure 23: North America Marine Coatings Industry Revenue (Million), by Type 2025 & 2033
- Figure 24: North America Marine Coatings Industry Volume (liter ), by Type 2025 & 2033
- Figure 25: North America Marine Coatings Industry Revenue Share (%), by Type 2025 & 2033
- Figure 26: North America Marine Coatings Industry Volume Share (%), by Type 2025 & 2033
- Figure 27: North America Marine Coatings Industry Revenue (Million), by Resin 2025 & 2033
- Figure 28: North America Marine Coatings Industry Volume (liter ), by Resin 2025 & 2033
- Figure 29: North America Marine Coatings Industry Revenue Share (%), by Resin 2025 & 2033
- Figure 30: North America Marine Coatings Industry Volume Share (%), by Resin 2025 & 2033
- Figure 31: North America Marine Coatings Industry Revenue (Million), by Technology 2025 & 2033
- Figure 32: North America Marine Coatings Industry Volume (liter ), by Technology 2025 & 2033
- Figure 33: North America Marine Coatings Industry Revenue Share (%), by Technology 2025 & 2033
- Figure 34: North America Marine Coatings Industry Volume Share (%), by Technology 2025 & 2033
- Figure 35: North America Marine Coatings Industry Revenue (Million), by Application 2025 & 2033
- Figure 36: North America Marine Coatings Industry Volume (liter ), by Application 2025 & 2033
- Figure 37: North America Marine Coatings Industry Revenue Share (%), by Application 2025 & 2033
- Figure 38: North America Marine Coatings Industry Volume Share (%), by Application 2025 & 2033
- Figure 39: North America Marine Coatings Industry Revenue (Million), by Country 2025 & 2033
- Figure 40: North America Marine Coatings Industry Volume (liter ), by Country 2025 & 2033
- Figure 41: North America Marine Coatings Industry Revenue Share (%), by Country 2025 & 2033
- Figure 42: North America Marine Coatings Industry Volume Share (%), by Country 2025 & 2033
- Figure 43: Europe Marine Coatings Industry Revenue (Million), by Type 2025 & 2033
- Figure 44: Europe Marine Coatings Industry Volume (liter ), by Type 2025 & 2033
- Figure 45: Europe Marine Coatings Industry Revenue Share (%), by Type 2025 & 2033
- Figure 46: Europe Marine Coatings Industry Volume Share (%), by Type 2025 & 2033
- Figure 47: Europe Marine Coatings Industry Revenue (Million), by Resin 2025 & 2033
- Figure 48: Europe Marine Coatings Industry Volume (liter ), by Resin 2025 & 2033
- Figure 49: Europe Marine Coatings Industry Revenue Share (%), by Resin 2025 & 2033
- Figure 50: Europe Marine Coatings Industry Volume Share (%), by Resin 2025 & 2033
- Figure 51: Europe Marine Coatings Industry Revenue (Million), by Technology 2025 & 2033
- Figure 52: Europe Marine Coatings Industry Volume (liter ), by Technology 2025 & 2033
- Figure 53: Europe Marine Coatings Industry Revenue Share (%), by Technology 2025 & 2033
- Figure 54: Europe Marine Coatings Industry Volume Share (%), by Technology 2025 & 2033
- Figure 55: Europe Marine Coatings Industry Revenue (Million), by Application 2025 & 2033
- Figure 56: Europe Marine Coatings Industry Volume (liter ), by Application 2025 & 2033
- Figure 57: Europe Marine Coatings Industry Revenue Share (%), by Application 2025 & 2033
- Figure 58: Europe Marine Coatings Industry Volume Share (%), by Application 2025 & 2033
- Figure 59: Europe Marine Coatings Industry Revenue (Million), by Country 2025 & 2033
- Figure 60: Europe Marine Coatings Industry Volume (liter ), by Country 2025 & 2033
- Figure 61: Europe Marine Coatings Industry Revenue Share (%), by Country 2025 & 2033
- Figure 62: Europe Marine Coatings Industry Volume Share (%), by Country 2025 & 2033
- Figure 63: South America Marine Coatings Industry Revenue (Million), by Type 2025 & 2033
- Figure 64: South America Marine Coatings Industry Volume (liter ), by Type 2025 & 2033
- Figure 65: South America Marine Coatings Industry Revenue Share (%), by Type 2025 & 2033
- Figure 66: South America Marine Coatings Industry Volume Share (%), by Type 2025 & 2033
- Figure 67: South America Marine Coatings Industry Revenue (Million), by Resin 2025 & 2033
- Figure 68: South America Marine Coatings Industry Volume (liter ), by Resin 2025 & 2033
- Figure 69: South America Marine Coatings Industry Revenue Share (%), by Resin 2025 & 2033
- Figure 70: South America Marine Coatings Industry Volume Share (%), by Resin 2025 & 2033
- Figure 71: South America Marine Coatings Industry Revenue (Million), by Technology 2025 & 2033
- Figure 72: South America Marine Coatings Industry Volume (liter ), by Technology 2025 & 2033
- Figure 73: South America Marine Coatings Industry Revenue Share (%), by Technology 2025 & 2033
- Figure 74: South America Marine Coatings Industry Volume Share (%), by Technology 2025 & 2033
- Figure 75: South America Marine Coatings Industry Revenue (Million), by Application 2025 & 2033
- Figure 76: South America Marine Coatings Industry Volume (liter ), by Application 2025 & 2033
- Figure 77: South America Marine Coatings Industry Revenue Share (%), by Application 2025 & 2033
- Figure 78: South America Marine Coatings Industry Volume Share (%), by Application 2025 & 2033
- Figure 79: South America Marine Coatings Industry Revenue (Million), by Country 2025 & 2033
- Figure 80: South America Marine Coatings Industry Volume (liter ), by Country 2025 & 2033
- Figure 81: South America Marine Coatings Industry Revenue Share (%), by Country 2025 & 2033
- Figure 82: South America Marine Coatings Industry Volume Share (%), by Country 2025 & 2033
- Figure 83: Middle East and Africa Marine Coatings Industry Revenue (Million), by Type 2025 & 2033
- Figure 84: Middle East and Africa Marine Coatings Industry Volume (liter ), by Type 2025 & 2033
- Figure 85: Middle East and Africa Marine Coatings Industry Revenue Share (%), by Type 2025 & 2033
- Figure 86: Middle East and Africa Marine Coatings Industry Volume Share (%), by Type 2025 & 2033
- Figure 87: Middle East and Africa Marine Coatings Industry Revenue (Million), by Resin 2025 & 2033
- Figure 88: Middle East and Africa Marine Coatings Industry Volume (liter ), by Resin 2025 & 2033
- Figure 89: Middle East and Africa Marine Coatings Industry Revenue Share (%), by Resin 2025 & 2033
- Figure 90: Middle East and Africa Marine Coatings Industry Volume Share (%), by Resin 2025 & 2033
- Figure 91: Middle East and Africa Marine Coatings Industry Revenue (Million), by Technology 2025 & 2033
- Figure 92: Middle East and Africa Marine Coatings Industry Volume (liter ), by Technology 2025 & 2033
- Figure 93: Middle East and Africa Marine Coatings Industry Revenue Share (%), by Technology 2025 & 2033
- Figure 94: Middle East and Africa Marine Coatings Industry Volume Share (%), by Technology 2025 & 2033
- Figure 95: Middle East and Africa Marine Coatings Industry Revenue (Million), by Application 2025 & 2033
- Figure 96: Middle East and Africa Marine Coatings Industry Volume (liter ), by Application 2025 & 2033
- Figure 97: Middle East and Africa Marine Coatings Industry Revenue Share (%), by Application 2025 & 2033
- Figure 98: Middle East and Africa Marine Coatings Industry Volume Share (%), by Application 2025 & 2033
- Figure 99: Middle East and Africa Marine Coatings Industry Revenue (Million), by Country 2025 & 2033
- Figure 100: Middle East and Africa Marine Coatings Industry Volume (liter ), by Country 2025 & 2033
- Figure 101: Middle East and Africa Marine Coatings Industry Revenue Share (%), by Country 2025 & 2033
- Figure 102: Middle East and Africa Marine Coatings Industry Volume Share (%), by Country 2025 & 2033
List of Tables
- Table 1: Global Marine Coatings Industry Revenue Million Forecast, by Type 2020 & 2033
- Table 2: Global Marine Coatings Industry Volume liter Forecast, by Type 2020 & 2033
- Table 3: Global Marine Coatings Industry Revenue Million Forecast, by Resin 2020 & 2033
- Table 4: Global Marine Coatings Industry Volume liter Forecast, by Resin 2020 & 2033
- Table 5: Global Marine Coatings Industry Revenue Million Forecast, by Technology 2020 & 2033
- Table 6: Global Marine Coatings Industry Volume liter Forecast, by Technology 2020 & 2033
- Table 7: Global Marine Coatings Industry Revenue Million Forecast, by Application 2020 & 2033
- Table 8: Global Marine Coatings Industry Volume liter Forecast, by Application 2020 & 2033
- Table 9: Global Marine Coatings Industry Revenue Million Forecast, by Region 2020 & 2033
- Table 10: Global Marine Coatings Industry Volume liter Forecast, by Region 2020 & 2033
- Table 11: Global Marine Coatings Industry Revenue Million Forecast, by Type 2020 & 2033
- Table 12: Global Marine Coatings Industry Volume liter Forecast, by Type 2020 & 2033
- Table 13: Global Marine Coatings Industry Revenue Million Forecast, by Resin 2020 & 2033
- Table 14: Global Marine Coatings Industry Volume liter Forecast, by Resin 2020 & 2033
- Table 15: Global Marine Coatings Industry Revenue Million Forecast, by Technology 2020 & 2033
- Table 16: Global Marine Coatings Industry Volume liter Forecast, by Technology 2020 & 2033
- Table 17: Global Marine Coatings Industry Revenue Million Forecast, by Application 2020 & 2033
- Table 18: Global Marine Coatings Industry Volume liter Forecast, by Application 2020 & 2033
- Table 19: Global Marine Coatings Industry Revenue Million Forecast, by Country 2020 & 2033
- Table 20: Global Marine Coatings Industry Volume liter Forecast, by Country 2020 & 2033
- Table 21: China Marine Coatings Industry Revenue (Million) Forecast, by Application 2020 & 2033
- Table 22: China Marine Coatings Industry Volume (liter ) Forecast, by Application 2020 & 2033
- Table 23: India Marine Coatings Industry Revenue (Million) Forecast, by Application 2020 & 2033
- Table 24: India Marine Coatings Industry Volume (liter ) Forecast, by Application 2020 & 2033
- Table 25: Japan Marine Coatings Industry Revenue (Million) Forecast, by Application 2020 & 2033
- Table 26: Japan Marine Coatings Industry Volume (liter ) Forecast, by Application 2020 & 2033
- Table 27: South Korea Marine Coatings Industry Revenue (Million) Forecast, by Application 2020 & 2033
- Table 28: South Korea Marine Coatings Industry Volume (liter ) Forecast, by Application 2020 & 2033
- Table 29: Malaysia Marine Coatings Industry Revenue (Million) Forecast, by Application 2020 & 2033
- Table 30: Malaysia Marine Coatings Industry Volume (liter ) Forecast, by Application 2020 & 2033
- Table 31: Vietnam Marine Coatings Industry Revenue (Million) Forecast, by Application 2020 & 2033
- Table 32: Vietnam Marine Coatings Industry Volume (liter ) Forecast, by Application 2020 & 2033
- Table 33: Rest of Asia Pacific Marine Coatings Industry Revenue (Million) Forecast, by Application 2020 & 2033
- Table 34: Rest of Asia Pacific Marine Coatings Industry Volume (liter ) Forecast, by Application 2020 & 2033
- Table 35: Global Marine Coatings Industry Revenue Million Forecast, by Type 2020 & 2033
- Table 36: Global Marine Coatings Industry Volume liter Forecast, by Type 2020 & 2033
- Table 37: Global Marine Coatings Industry Revenue Million Forecast, by Resin 2020 & 2033
- Table 38: Global Marine Coatings Industry Volume liter Forecast, by Resin 2020 & 2033
- Table 39: Global Marine Coatings Industry Revenue Million Forecast, by Technology 2020 & 2033
- Table 40: Global Marine Coatings Industry Volume liter Forecast, by Technology 2020 & 2033
- Table 41: Global Marine Coatings Industry Revenue Million Forecast, by Application 2020 & 2033
- Table 42: Global Marine Coatings Industry Volume liter Forecast, by Application 2020 & 2033
- Table 43: Global Marine Coatings Industry Revenue Million Forecast, by Country 2020 & 2033
- Table 44: Global Marine Coatings Industry Volume liter Forecast, by Country 2020 & 2033
- Table 45: United States Marine Coatings Industry Revenue (Million) Forecast, by Application 2020 & 2033
- Table 46: United States Marine Coatings Industry Volume (liter ) Forecast, by Application 2020 & 2033
- Table 47: Canada Marine Coatings Industry Revenue (Million) Forecast, by Application 2020 & 2033
- Table 48: Canada Marine Coatings Industry Volume (liter ) Forecast, by Application 2020 & 2033
- Table 49: Mexico Marine Coatings Industry Revenue (Million) Forecast, by Application 2020 & 2033
- Table 50: Mexico Marine Coatings Industry Volume (liter ) Forecast, by Application 2020 & 2033
- Table 51: Global Marine Coatings Industry Revenue Million Forecast, by Type 2020 & 2033
- Table 52: Global Marine Coatings Industry Volume liter Forecast, by Type 2020 & 2033
- Table 53: Global Marine Coatings Industry Revenue Million Forecast, by Resin 2020 & 2033
- Table 54: Global Marine Coatings Industry Volume liter Forecast, by Resin 2020 & 2033
- Table 55: Global Marine Coatings Industry Revenue Million Forecast, by Technology 2020 & 2033
- Table 56: Global Marine Coatings Industry Volume liter Forecast, by Technology 2020 & 2033
- Table 57: Global Marine Coatings Industry Revenue Million Forecast, by Application 2020 & 2033
- Table 58: Global Marine Coatings Industry Volume liter Forecast, by Application 2020 & 2033
- Table 59: Global Marine Coatings Industry Revenue Million Forecast, by Country 2020 & 2033
- Table 60: Global Marine Coatings Industry Volume liter Forecast, by Country 2020 & 2033
- Table 61: Germany Marine Coatings Industry Revenue (Million) Forecast, by Application 2020 & 2033
- Table 62: Germany Marine Coatings Industry Volume (liter ) Forecast, by Application 2020 & 2033
- Table 63: United Kingdom Marine Coatings Industry Revenue (Million) Forecast, by Application 2020 & 2033
- Table 64: United Kingdom Marine Coatings Industry Volume (liter ) Forecast, by Application 2020 & 2033
- Table 65: Italy Marine Coatings Industry Revenue (Million) Forecast, by Application 2020 & 2033
- Table 66: Italy Marine Coatings Industry Volume (liter ) Forecast, by Application 2020 & 2033
- Table 67: France Marine Coatings Industry Revenue (Million) Forecast, by Application 2020 & 2033
- Table 68: France Marine Coatings Industry Volume (liter ) Forecast, by Application 2020 & 2033
- Table 69: Rest of Europe Marine Coatings Industry Revenue (Million) Forecast, by Application 2020 & 2033
- Table 70: Rest of Europe Marine Coatings Industry Volume (liter ) Forecast, by Application 2020 & 2033
- Table 71: Global Marine Coatings Industry Revenue Million Forecast, by Type 2020 & 2033
- Table 72: Global Marine Coatings Industry Volume liter Forecast, by Type 2020 & 2033
- Table 73: Global Marine Coatings Industry Revenue Million Forecast, by Resin 2020 & 2033
- Table 74: Global Marine Coatings Industry Volume liter Forecast, by Resin 2020 & 2033
- Table 75: Global Marine Coatings Industry Revenue Million Forecast, by Technology 2020 & 2033
- Table 76: Global Marine Coatings Industry Volume liter Forecast, by Technology 2020 & 2033
- Table 77: Global Marine Coatings Industry Revenue Million Forecast, by Application 2020 & 2033
- Table 78: Global Marine Coatings Industry Volume liter Forecast, by Application 2020 & 2033
- Table 79: Global Marine Coatings Industry Revenue Million Forecast, by Country 2020 & 2033
- Table 80: Global Marine Coatings Industry Volume liter Forecast, by Country 2020 & 2033
- Table 81: Brazil Marine Coatings Industry Revenue (Million) Forecast, by Application 2020 & 2033
- Table 82: Brazil Marine Coatings Industry Volume (liter ) Forecast, by Application 2020 & 2033
- Table 83: Argentina Marine Coatings Industry Revenue (Million) Forecast, by Application 2020 & 2033
- Table 84: Argentina Marine Coatings Industry Volume (liter ) Forecast, by Application 2020 & 2033
- Table 85: Rest of South America Marine Coatings Industry Revenue (Million) Forecast, by Application 2020 & 2033
- Table 86: Rest of South America Marine Coatings Industry Volume (liter ) Forecast, by Application 2020 & 2033
- Table 87: Global Marine Coatings Industry Revenue Million Forecast, by Type 2020 & 2033
- Table 88: Global Marine Coatings Industry Volume liter Forecast, by Type 2020 & 2033
- Table 89: Global Marine Coatings Industry Revenue Million Forecast, by Resin 2020 & 2033
- Table 90: Global Marine Coatings Industry Volume liter Forecast, by Resin 2020 & 2033
- Table 91: Global Marine Coatings Industry Revenue Million Forecast, by Technology 2020 & 2033
- Table 92: Global Marine Coatings Industry Volume liter Forecast, by Technology 2020 & 2033
- Table 93: Global Marine Coatings Industry Revenue Million Forecast, by Application 2020 & 2033
- Table 94: Global Marine Coatings Industry Volume liter Forecast, by Application 2020 & 2033
- Table 95: Global Marine Coatings Industry Revenue Million Forecast, by Country 2020 & 2033
- Table 96: Global Marine Coatings Industry Volume liter Forecast, by Country 2020 & 2033
- Table 97: Saudi Arabia Marine Coatings Industry Revenue (Million) Forecast, by Application 2020 & 2033
- Table 98: Saudi Arabia Marine Coatings Industry Volume (liter ) Forecast, by Application 2020 & 2033
- Table 99: South Africa Marine Coatings Industry Revenue (Million) Forecast, by Application 2020 & 2033
- Table 100: South Africa Marine Coatings Industry Volume (liter ) Forecast, by Application 2020 & 2033
- Table 101: Rest of Middle East and Africa Marine Coatings Industry Revenue (Million) Forecast, by Application 2020 & 2033
- Table 102: Rest of Middle East and Africa Marine Coatings Industry Volume (liter ) Forecast, by Application 2020 & 2033
Frequently Asked Questions
1. What is the projected Compound Annual Growth Rate (CAGR) of the Marine Coatings Industry?
The projected CAGR is approximately > 4.50%.
2. Which companies are prominent players in the Marine Coatings Industry?
Key companies in the market include Engineered Marine Coatings LLC, The Sherwin-Williams Company*List Not Exhaustive, AkzoNobel N V, Chugoku Marine Paints Ltd, KCC CORPORATION, Jotun, RPM International Inc, Kansai Paint Marine Co Ltd, Pettit Marine Paints, PPG Industries Inc, BOERO BARTOLOMEO S p A, Nippon Paint Marine Coatings Co Ltd, BASF SE, Axalta Coating Systems, Hempel A/S, MCU COATING INTERNATIONAL.
3. What are the main segments of the Marine Coatings Industry?
The market segments include Type, Resin, Technology, Application.
4. Can you provide details about the market size?
The market size is estimated to be USD 3.77 Million as of 2022.
5. What are some drivers contributing to market growth?
Increase in Production of Leisure Boats and Cruise Ships; Growing Ship Repairs and Maintenance Activities.
6. What are the notable trends driving market growth?
Marine OEM Application Segment to Dominate The Market.
7. Are there any restraints impacting market growth?
Stringent Government Regulations; Sluggish Growth in Shipbuilding Activities in Few Countries.
8. Can you provide examples of recent developments in the market?
March 2023: PPG launched the PPG SIGMAGLIDE 2390 marine coating to help shipowners lower power consumption and carbon emissions and meet demands for higher performance without adversely impacting the marine environment.
9. What pricing options are available for accessing the report?
Pricing options include single-user, multi-user, and enterprise licenses priced at USD 4750, USD 5250, and USD 8750 respectively.
10. Is the market size provided in terms of value or volume?
The market size is provided in terms of value, measured in Million and volume, measured in liter .
11. Are there any specific market keywords associated with the report?
Yes, the market keyword associated with the report is "Marine Coatings Industry," which aids in identifying and referencing the specific market segment covered.
12. How do I determine which pricing option suits my needs best?
The pricing options vary based on user requirements and access needs. Individual users may opt for single-user licenses, while businesses requiring broader access may choose multi-user or enterprise licenses for cost-effective access to the report.
13. Are there any additional resources or data provided in the Marine Coatings Industry report?
While the report offers comprehensive insights, it's advisable to review the specific contents or supplementary materials provided to ascertain if additional resources or data are available.
14. How can I stay updated on further developments or reports in the Marine Coatings Industry?
To stay informed about further developments, trends, and reports in the Marine Coatings Industry, consider subscribing to industry newsletters, following relevant companies and organizations, or regularly checking reputable industry news sources and publications.
Methodology
Step 1 - Identification of Relevant Samples Size from Population Database


Step 2 - Approaches for Defining Global Market Size (Value, Volume* & Price*)

Note*: In applicable scenarios
Step 3 - Data Sources
Primary Research
- Web Analytics
- Survey Reports
- Research Institute
- Latest Research Reports
- Opinion Leaders
Secondary Research
- Annual Reports
- White Paper
- Latest Press Release
- Industry Association
- Paid Database
- Investor Presentations

Step 4 - Data Triangulation
Involves using different sources of information in order to increase the validity of a study
These sources are likely to be stakeholders in a program - participants, other researchers, program staff, other community members, and so on.
Then we put all data in single framework & apply various statistical tools to find out the dynamic on the market.
During the analysis stage, feedback from the stakeholder groups would be compared to determine areas of agreement as well as areas of divergence