

Key Insights
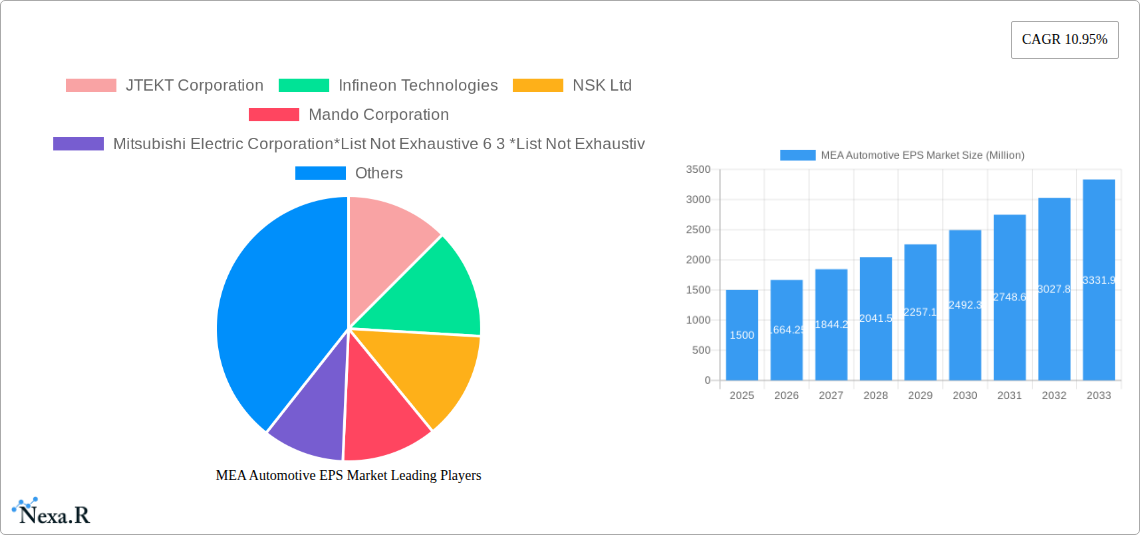
The Middle East and Africa (MEA) Automotive Electric Power Steering (EPS) market is experiencing robust growth, driven by increasing vehicle production, rising adoption of advanced driver-assistance systems (ADAS), and stringent government regulations promoting fuel efficiency. The market, valued at approximately $XX million in 2025, is projected to exhibit a Compound Annual Growth Rate (CAGR) of 10.95% from 2025 to 2033. This expansion is fueled by a significant rise in passenger car sales across the region, particularly in countries like the United Arab Emirates and Saudi Arabia, which are witnessing rapid urbanization and economic development. Furthermore, the increasing demand for enhanced safety features and comfort in vehicles is bolstering the adoption of EPS systems, surpassing traditional hydraulic power steering systems. Key segments driving growth include passenger cars, followed by commercial vehicles. Component-wise, Electronic Control Units (ECUs) and sensors are experiencing high demand due to their crucial role in EPS functionality and integration with ADAS. Leading players such as JTEKT Corporation, Infineon Technologies, and Robert Bosch GmbH are strategically investing in research and development to offer innovative and cost-effective EPS solutions, further intensifying competition and market penetration. Challenges include the relatively high initial investment costs associated with EPS technology and the need for robust infrastructure to support widespread adoption, particularly in certain regions within the MEA.
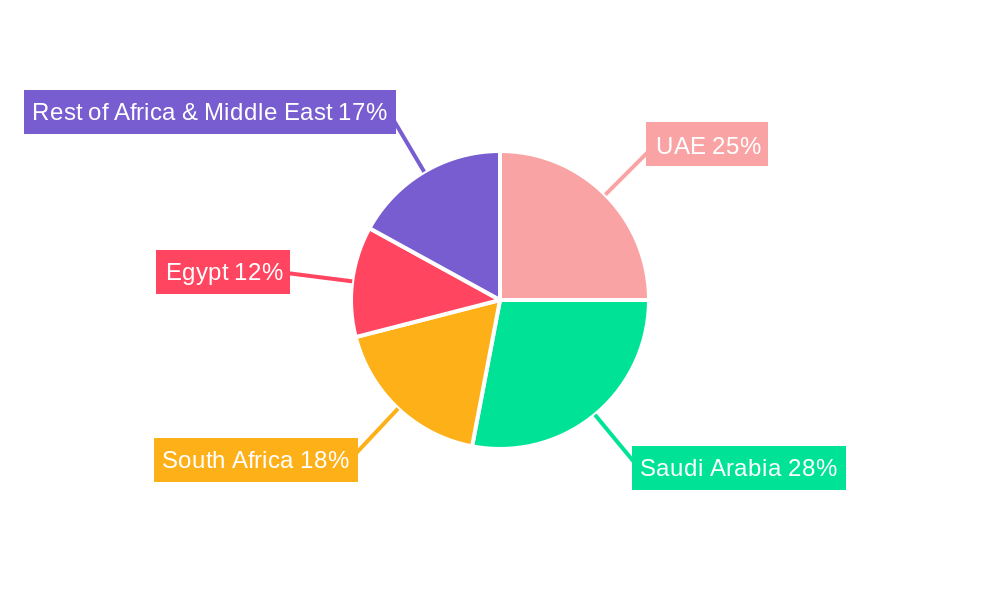
Despite these challenges, the long-term outlook for the MEA Automotive EPS market remains positive. The growing middle class, increasing disposable incomes, and government initiatives to improve road safety and infrastructure are expected to propel market expansion throughout the forecast period. The market segmentation by country reveals that the UAE and Saudi Arabia represent significant revenue streams, owing to their well-established automotive industries and strong government support for technological advancements. Growth in other countries like South Africa and Egypt is also expected, albeit at a potentially slower pace, as these markets continue to develop their automotive sectors. Continued innovation in EPS technology, including the integration of advanced functionalities and features, will be crucial for sustained market growth and capturing a larger share of the automotive industry.
MEA Automotive EPS Market: A Comprehensive Market Report (2019-2033)
This comprehensive report provides an in-depth analysis of the Middle East and Africa (MEA) Automotive Electronic Power Steering (EPS) market, offering invaluable insights for industry professionals, investors, and strategic decision-makers. The report covers the period from 2019 to 2033, with a focus on the forecast period from 2025 to 2033, using 2025 as the base year. The MEA automotive EPS market, a key segment within the broader global automotive industry, is experiencing significant growth driven by technological advancements and increasing demand for enhanced vehicle safety and fuel efficiency. This report analyzes the parent market (Automotive Industry in MEA) and the child market (MEA Automotive EPS) to offer a holistic perspective. The market size is projected to reach xx Million units by 2033.
Keywords: MEA Automotive EPS Market, Electronic Power Steering, Automotive Industry MEA, EPS Market Growth, Automotive EPS Components, Passenger Cars, Commercial Vehicles, South Africa Automotive Market, Egypt Automotive Market, UAE Automotive Market, Saudi Arabia Automotive Market, JTEKT Corporation, Infineon Technologies, NSK Ltd, Mando Corporation, Mitsubishi Electric Corporation, Robert Bosch GmbH, ATS Automation Tooling Systems Inc, Delphi Automotive Systems, Thyssenkrupp Presta AG, ZF Friedrichshafen AG.
MEA Automotive EPS Market Dynamics & Structure
The MEA Automotive EPS market is characterized by moderate concentration, with several key players holding significant market share. Technological innovation, particularly in areas such as sensor technology and control algorithms, is a primary driver of growth. Stringent safety regulations are pushing the adoption of EPS systems, particularly in passenger cars. Competitive substitutes include traditional hydraulic power steering systems; however, the advantages of EPS in terms of fuel efficiency and performance are driving a shift towards adoption. The end-user demographic is primarily composed of car manufacturers and tier-1 automotive suppliers. M&A activity in the sector has been moderate, with a focus on strategic partnerships and technology acquisitions.
- Market Concentration: Moderately concentrated, with top 5 players holding approximately xx% of market share in 2024 (estimated).
- Technological Innovation: Rapid advancements in sensor technology, control algorithms, and software are driving market growth.
- Regulatory Framework: Increasingly stringent safety regulations mandate EPS adoption in new vehicle models.
- Competitive Substitutes: Hydraulic power steering systems; however, their market share is declining due to EPS advantages.
- M&A Activity: Moderate level of mergers and acquisitions, focusing on technology integration and market expansion. xx M&A deals were recorded in the MEA region between 2019 and 2024 (estimated).
- Innovation Barriers: High initial investment costs for R&D and manufacturing can hinder innovation for smaller players.
MEA Automotive EPS Market Growth Trends & Insights
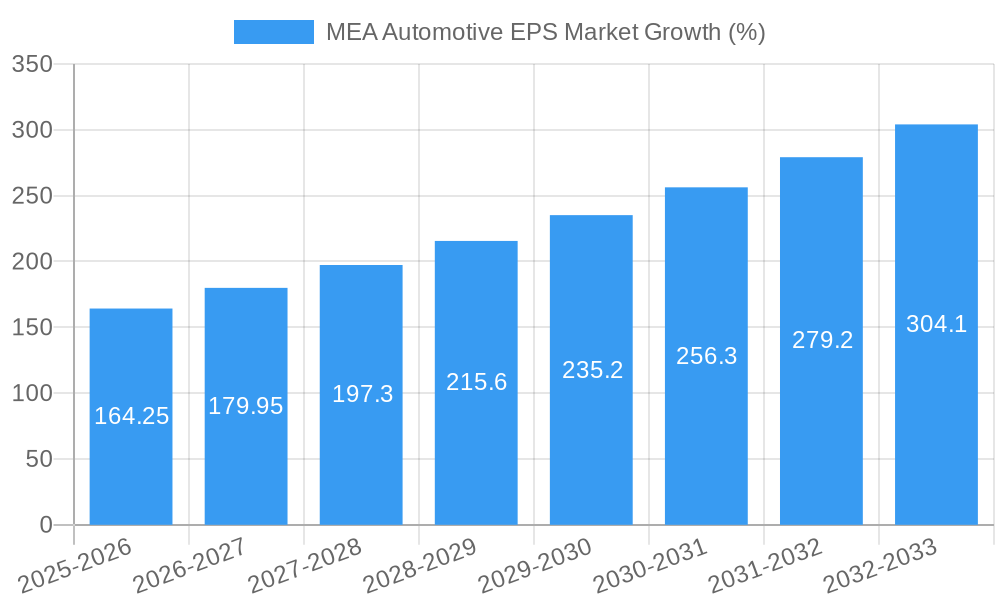
The MEA Automotive EPS market has experienced robust growth during the historical period (2019-2024), primarily driven by the rising demand for passenger cars and increasing disposable incomes across several MEA countries. Technological advancements in EPS systems, offering improved fuel efficiency and enhanced driving experience, are further boosting market growth. The adoption rate of EPS systems has shown a consistent upward trend. Consumer preference for advanced driver-assistance systems (ADAS) is also driving the demand. The market is expected to witness a CAGR of xx% during the forecast period (2025-2033), driven by factors such as increasing vehicle production, rising urbanization, and favorable government policies promoting automotive sector growth. Market penetration of EPS in the passenger car segment is expected to reach xx% by 2033.
Dominant Regions, Countries, or Segments in MEA Automotive EPS Market
The UAE and Saudi Arabia are currently the leading countries in the MEA Automotive EPS market, driven by high vehicle sales, substantial investments in infrastructure, and supportive government initiatives for the automotive sector. Within the component type segment, Electronic Control Units (ECUs) hold the largest market share, owing to their crucial role in EPS system functionality. Passenger cars are the dominant vehicle type, contributing to a larger market share compared to commercial vehicles. However, the commercial vehicle segment is projected to show significant growth in the coming years due to rising logistics and transportation activities.
- Key Drivers in UAE and Saudi Arabia: High vehicle sales, strong infrastructure development, government support for the automotive industry.
- Component Type Dominance: Electronic Control Units (ECUs) hold the largest market share due to their central role in EPS functionality.
- Vehicle Type Dominance: Passenger cars currently lead, however, commercial vehicles are expected to witness substantial growth.
- Growth Potential: Rest of Africa and Middle-East regions offer significant untapped market potential for EPS systems.
MEA Automotive EPS Market Product Landscape
The MEA Automotive EPS market offers a diverse range of products, featuring varying levels of sophistication and technological integration. Recent innovations focus on enhancing steering feel, improving fuel efficiency, and integrating advanced driver assistance systems. Key performance metrics include steering response time, energy efficiency, and system reliability. Unique selling propositions often center on advanced features such as variable steering assist and haptic feedback. The market is witnessing a growing trend towards the integration of EPS systems with ADAS features, such as lane keeping assist and autonomous emergency braking.
Key Drivers, Barriers & Challenges in MEA Automotive EPS Market
Key Drivers: Rising demand for fuel-efficient vehicles, increasing adoption of ADAS, stringent government regulations promoting safety, and growing investment in automotive manufacturing within the MEA region.
Challenges & Restraints: High initial investment costs, limited technological expertise in certain MEA countries, complex supply chain logistics, and intense competition from established international players. These challenges can lead to slower adoption rates in some regions and hinder market growth by an estimated xx% annually if not addressed effectively (estimated impact).
Emerging Opportunities in MEA Automotive EPS Market
Significant opportunities exist within the MEA Automotive EPS market, including the expansion into untapped markets within the Rest of Africa and Middle-East region, the integration of EPS with advanced driver assistance systems (ADAS), the development of cost-effective solutions to cater to the budget-conscious consumer segments, and growth in electric and hybrid vehicles.
Growth Accelerators in the MEA Automotive EPS Market Industry
Technological advancements in sensor technology, control algorithms, and software will accelerate market growth. Strategic partnerships between automotive manufacturers and technology companies will drive innovation and market expansion. Government incentives promoting the adoption of fuel-efficient vehicles and investment in automotive manufacturing capabilities will further fuel market expansion.
Key Players Shaping the MEA Automotive EPS Market
- JTEKT Corporation
- Infineon Technologies
- NSK Ltd
- Mando Corporation
- Mitsubishi Electric Corporation
- Robert Bosch GmbH
- ATS Automation Tooling Systems Inc
- Delphi Automotive Systems
- Thyssenkrupp Presta AG
- ZF Friedrichshafen AG
Notable Milestones in MEA Automotive EPS Market Sector
- 2020: Introduction of stricter safety regulations regarding EPS in the UAE.
- 2022: Launch of a new generation of EPS systems with enhanced ADAS integration by JTEKT Corporation.
- 2023: A major merger between two key EPS component suppliers in South Africa. (Further details unavailable - xx)
In-Depth MEA Automotive EPS Market Outlook
The MEA Automotive EPS market is poised for strong growth in the coming years, driven by technological advancements, increased vehicle production, and government initiatives promoting automotive sector growth. Strategic opportunities exist for companies to capitalize on this growth by focusing on product innovation, strategic partnerships, and expanding into untapped markets. The market's future potential lies in the integration of EPS with advanced ADAS, the development of cost-effective solutions, and the electrification of the automotive sector.
MEA Automotive EPS Market Segmentation
-
1. Component Type
- 1.1. Steering Wheel/Column
- 1.2. Sensors
- 1.3. Electronic Control Unit
- 1.4. Others
-
2. Vehicle Type
- 2.1. Passenger Cars
- 2.2. Commercial Vehicles
MEA Automotive EPS Market Segmentation By Geography
-
1. North America
- 1.1. United States
- 1.2. Canada
- 1.3. Mexico
-
2. South America
- 2.1. Brazil
- 2.2. Argentina
- 2.3. Rest of South America
-
3. Europe
- 3.1. United Kingdom
- 3.2. Germany
- 3.3. France
- 3.4. Italy
- 3.5. Spain
- 3.6. Russia
- 3.7. Benelux
- 3.8. Nordics
- 3.9. Rest of Europe
-
4. Middle East & Africa
- 4.1. Turkey
- 4.2. Israel
- 4.3. GCC
- 4.4. North Africa
- 4.5. South Africa
- 4.6. Rest of Middle East & Africa
-
5. Asia Pacific
- 5.1. China
- 5.2. India
- 5.3. Japan
- 5.4. South Korea
- 5.5. ASEAN
- 5.6. Oceania
- 5.7. Rest of Asia Pacific
MEA Automotive EPS Market REPORT HIGHLIGHTS
| Aspects | Details |
|---|---|
| Study Period | 2019-2033 |
| Base Year | 2024 |
| Estimated Year | 2025 |
| Forecast Period | 2025-2033 |
| Historical Period | 2019-2024 |
| Growth Rate | CAGR of 10.95% from 2019-2033 |
| Segmentation |
|
Table of Contents
- 1. Introduction
- 1.1. Research Scope
- 1.2. Market Segmentation
- 1.3. Research Methodology
- 1.4. Definitions and Assumptions
- 2. Executive Summary
- 2.1. Introduction
- 3. Market Dynamics
- 3.1. Introduction
- 3.2. Market Drivers
- 3.2.1. Rise in demand for Luxury Cars Across the Country
- 3.3. Market Restrains
- 3.3.1. High Cost Associated with the Product
- 3.4. Market Trends
- 3.4.1. ECU is the Fastest-Growing Component
- 4. Market Factor Analysis
- 4.1. Porters Five Forces
- 4.2. Supply/Value Chain
- 4.3. PESTEL analysis
- 4.4. Market Entropy
- 4.5. Patent/Trademark Analysis
- 5. Global MEA Automotive EPS Market Analysis, Insights and Forecast, 2019-2031
- 5.1. Market Analysis, Insights and Forecast - by Component Type
- 5.1.1. Steering Wheel/Column
- 5.1.2. Sensors
- 5.1.3. Electronic Control Unit
- 5.1.4. Others
- 5.2. Market Analysis, Insights and Forecast - by Vehicle Type
- 5.2.1. Passenger Cars
- 5.2.2. Commercial Vehicles
- 5.3. Market Analysis, Insights and Forecast - by Region
- 5.3.1. North America
- 5.3.2. South America
- 5.3.3. Europe
- 5.3.4. Middle East & Africa
- 5.3.5. Asia Pacific
- 5.1. Market Analysis, Insights and Forecast - by Component Type
- 6. North America MEA Automotive EPS Market Analysis, Insights and Forecast, 2019-2031
- 6.1. Market Analysis, Insights and Forecast - by Component Type
- 6.1.1. Steering Wheel/Column
- 6.1.2. Sensors
- 6.1.3. Electronic Control Unit
- 6.1.4. Others
- 6.2. Market Analysis, Insights and Forecast - by Vehicle Type
- 6.2.1. Passenger Cars
- 6.2.2. Commercial Vehicles
- 6.1. Market Analysis, Insights and Forecast - by Component Type
- 7. South America MEA Automotive EPS Market Analysis, Insights and Forecast, 2019-2031
- 7.1. Market Analysis, Insights and Forecast - by Component Type
- 7.1.1. Steering Wheel/Column
- 7.1.2. Sensors
- 7.1.3. Electronic Control Unit
- 7.1.4. Others
- 7.2. Market Analysis, Insights and Forecast - by Vehicle Type
- 7.2.1. Passenger Cars
- 7.2.2. Commercial Vehicles
- 7.1. Market Analysis, Insights and Forecast - by Component Type
- 8. Europe MEA Automotive EPS Market Analysis, Insights and Forecast, 2019-2031
- 8.1. Market Analysis, Insights and Forecast - by Component Type
- 8.1.1. Steering Wheel/Column
- 8.1.2. Sensors
- 8.1.3. Electronic Control Unit
- 8.1.4. Others
- 8.2. Market Analysis, Insights and Forecast - by Vehicle Type
- 8.2.1. Passenger Cars
- 8.2.2. Commercial Vehicles
- 8.1. Market Analysis, Insights and Forecast - by Component Type
- 9. Middle East & Africa MEA Automotive EPS Market Analysis, Insights and Forecast, 2019-2031
- 9.1. Market Analysis, Insights and Forecast - by Component Type
- 9.1.1. Steering Wheel/Column
- 9.1.2. Sensors
- 9.1.3. Electronic Control Unit
- 9.1.4. Others
- 9.2. Market Analysis, Insights and Forecast - by Vehicle Type
- 9.2.1. Passenger Cars
- 9.2.2. Commercial Vehicles
- 9.1. Market Analysis, Insights and Forecast - by Component Type
- 10. Asia Pacific MEA Automotive EPS Market Analysis, Insights and Forecast, 2019-2031
- 10.1. Market Analysis, Insights and Forecast - by Component Type
- 10.1.1. Steering Wheel/Column
- 10.1.2. Sensors
- 10.1.3. Electronic Control Unit
- 10.1.4. Others
- 10.2. Market Analysis, Insights and Forecast - by Vehicle Type
- 10.2.1. Passenger Cars
- 10.2.2. Commercial Vehicles
- 10.1. Market Analysis, Insights and Forecast - by Component Type
- 11. United Arab Emirates MEA Automotive EPS Market Analysis, Insights and Forecast, 2019-2031
- 11.1. Market Analysis, Insights and Forecast - By Country/Sub-region
- 11.1.1.
- 12. Saudi Arabia MEA Automotive EPS Market Analysis, Insights and Forecast, 2019-2031
- 12.1. Market Analysis, Insights and Forecast - By Country/Sub-region
- 12.1.1.
- 13. South Africa MEA Automotive EPS Market Analysis, Insights and Forecast, 2019-2031
- 13.1. Market Analysis, Insights and Forecast - By Country/Sub-region
- 13.1.1.
- 14. Morocco MEA Automotive EPS Market Analysis, Insights and Forecast, 2019-2031
- 14.1. Market Analysis, Insights and Forecast - By Country/Sub-region
- 14.1.1.
- 15. Rest of Africa And Middle East MEA Automotive EPS Market Analysis, Insights and Forecast, 2019-2031
- 15.1. Market Analysis, Insights and Forecast - By Country/Sub-region
- 15.1.1.
- 16. Competitive Analysis
- 16.1. Global Market Share Analysis 2024
- 16.2. Company Profiles
- 16.2.1 JTEKT Corporation
- 16.2.1.1. Overview
- 16.2.1.2. Products
- 16.2.1.3. SWOT Analysis
- 16.2.1.4. Recent Developments
- 16.2.1.5. Financials (Based on Availability)
- 16.2.2 Infineon Technologies
- 16.2.2.1. Overview
- 16.2.2.2. Products
- 16.2.2.3. SWOT Analysis
- 16.2.2.4. Recent Developments
- 16.2.2.5. Financials (Based on Availability)
- 16.2.3 NSK Ltd
- 16.2.3.1. Overview
- 16.2.3.2. Products
- 16.2.3.3. SWOT Analysis
- 16.2.3.4. Recent Developments
- 16.2.3.5. Financials (Based on Availability)
- 16.2.4 Mando Corporation
- 16.2.4.1. Overview
- 16.2.4.2. Products
- 16.2.4.3. SWOT Analysis
- 16.2.4.4. Recent Developments
- 16.2.4.5. Financials (Based on Availability)
- 16.2.5 Mitsubishi Electric Corporation*List Not Exhaustive 6 3 *List Not Exhaustiv
- 16.2.5.1. Overview
- 16.2.5.2. Products
- 16.2.5.3. SWOT Analysis
- 16.2.5.4. Recent Developments
- 16.2.5.5. Financials (Based on Availability)
- 16.2.6 Robert Bosch GmbH
- 16.2.6.1. Overview
- 16.2.6.2. Products
- 16.2.6.3. SWOT Analysis
- 16.2.6.4. Recent Developments
- 16.2.6.5. Financials (Based on Availability)
- 16.2.7 ATS Automation Tooling Systems Inc
- 16.2.7.1. Overview
- 16.2.7.2. Products
- 16.2.7.3. SWOT Analysis
- 16.2.7.4. Recent Developments
- 16.2.7.5. Financials (Based on Availability)
- 16.2.8 Delphi Automotive Systems
- 16.2.8.1. Overview
- 16.2.8.2. Products
- 16.2.8.3. SWOT Analysis
- 16.2.8.4. Recent Developments
- 16.2.8.5. Financials (Based on Availability)
- 16.2.9 Thyssenkrupp Presta AG
- 16.2.9.1. Overview
- 16.2.9.2. Products
- 16.2.9.3. SWOT Analysis
- 16.2.9.4. Recent Developments
- 16.2.9.5. Financials (Based on Availability)
- 16.2.10 ZF Friedrichshafen AG
- 16.2.10.1. Overview
- 16.2.10.2. Products
- 16.2.10.3. SWOT Analysis
- 16.2.10.4. Recent Developments
- 16.2.10.5. Financials (Based on Availability)
- 16.2.1 JTEKT Corporation
List of Figures
- Figure 1: Global MEA Automotive EPS Market Revenue Breakdown (Million, %) by Region 2024 & 2032
- Figure 2: United Arab Emirates MEA Automotive EPS Market Revenue (Million), by Country 2024 & 2032
- Figure 3: United Arab Emirates MEA Automotive EPS Market Revenue Share (%), by Country 2024 & 2032
- Figure 4: Saudi Arabia MEA Automotive EPS Market Revenue (Million), by Country 2024 & 2032
- Figure 5: Saudi Arabia MEA Automotive EPS Market Revenue Share (%), by Country 2024 & 2032
- Figure 6: South Africa MEA Automotive EPS Market Revenue (Million), by Country 2024 & 2032
- Figure 7: South Africa MEA Automotive EPS Market Revenue Share (%), by Country 2024 & 2032
- Figure 8: Morocco MEA Automotive EPS Market Revenue (Million), by Country 2024 & 2032
- Figure 9: Morocco MEA Automotive EPS Market Revenue Share (%), by Country 2024 & 2032
- Figure 10: Rest of Africa And Middle East MEA Automotive EPS Market Revenue (Million), by Country 2024 & 2032
- Figure 11: Rest of Africa And Middle East MEA Automotive EPS Market Revenue Share (%), by Country 2024 & 2032
- Figure 12: North America MEA Automotive EPS Market Revenue (Million), by Component Type 2024 & 2032
- Figure 13: North America MEA Automotive EPS Market Revenue Share (%), by Component Type 2024 & 2032
- Figure 14: North America MEA Automotive EPS Market Revenue (Million), by Vehicle Type 2024 & 2032
- Figure 15: North America MEA Automotive EPS Market Revenue Share (%), by Vehicle Type 2024 & 2032
- Figure 16: North America MEA Automotive EPS Market Revenue (Million), by Country 2024 & 2032
- Figure 17: North America MEA Automotive EPS Market Revenue Share (%), by Country 2024 & 2032
- Figure 18: South America MEA Automotive EPS Market Revenue (Million), by Component Type 2024 & 2032
- Figure 19: South America MEA Automotive EPS Market Revenue Share (%), by Component Type 2024 & 2032
- Figure 20: South America MEA Automotive EPS Market Revenue (Million), by Vehicle Type 2024 & 2032
- Figure 21: South America MEA Automotive EPS Market Revenue Share (%), by Vehicle Type 2024 & 2032
- Figure 22: South America MEA Automotive EPS Market Revenue (Million), by Country 2024 & 2032
- Figure 23: South America MEA Automotive EPS Market Revenue Share (%), by Country 2024 & 2032
- Figure 24: Europe MEA Automotive EPS Market Revenue (Million), by Component Type 2024 & 2032
- Figure 25: Europe MEA Automotive EPS Market Revenue Share (%), by Component Type 2024 & 2032
- Figure 26: Europe MEA Automotive EPS Market Revenue (Million), by Vehicle Type 2024 & 2032
- Figure 27: Europe MEA Automotive EPS Market Revenue Share (%), by Vehicle Type 2024 & 2032
- Figure 28: Europe MEA Automotive EPS Market Revenue (Million), by Country 2024 & 2032
- Figure 29: Europe MEA Automotive EPS Market Revenue Share (%), by Country 2024 & 2032
- Figure 30: Middle East & Africa MEA Automotive EPS Market Revenue (Million), by Component Type 2024 & 2032
- Figure 31: Middle East & Africa MEA Automotive EPS Market Revenue Share (%), by Component Type 2024 & 2032
- Figure 32: Middle East & Africa MEA Automotive EPS Market Revenue (Million), by Vehicle Type 2024 & 2032
- Figure 33: Middle East & Africa MEA Automotive EPS Market Revenue Share (%), by Vehicle Type 2024 & 2032
- Figure 34: Middle East & Africa MEA Automotive EPS Market Revenue (Million), by Country 2024 & 2032
- Figure 35: Middle East & Africa MEA Automotive EPS Market Revenue Share (%), by Country 2024 & 2032
- Figure 36: Asia Pacific MEA Automotive EPS Market Revenue (Million), by Component Type 2024 & 2032
- Figure 37: Asia Pacific MEA Automotive EPS Market Revenue Share (%), by Component Type 2024 & 2032
- Figure 38: Asia Pacific MEA Automotive EPS Market Revenue (Million), by Vehicle Type 2024 & 2032
- Figure 39: Asia Pacific MEA Automotive EPS Market Revenue Share (%), by Vehicle Type 2024 & 2032
- Figure 40: Asia Pacific MEA Automotive EPS Market Revenue (Million), by Country 2024 & 2032
- Figure 41: Asia Pacific MEA Automotive EPS Market Revenue Share (%), by Country 2024 & 2032
List of Tables
- Table 1: Global MEA Automotive EPS Market Revenue Million Forecast, by Region 2019 & 2032
- Table 2: Global MEA Automotive EPS Market Revenue Million Forecast, by Component Type 2019 & 2032
- Table 3: Global MEA Automotive EPS Market Revenue Million Forecast, by Vehicle Type 2019 & 2032
- Table 4: Global MEA Automotive EPS Market Revenue Million Forecast, by Region 2019 & 2032
- Table 5: Global MEA Automotive EPS Market Revenue Million Forecast, by Country 2019 & 2032
- Table 6: MEA Automotive EPS Market Revenue (Million) Forecast, by Application 2019 & 2032
- Table 7: Global MEA Automotive EPS Market Revenue Million Forecast, by Country 2019 & 2032
- Table 8: MEA Automotive EPS Market Revenue (Million) Forecast, by Application 2019 & 2032
- Table 9: Global MEA Automotive EPS Market Revenue Million Forecast, by Country 2019 & 2032
- Table 10: MEA Automotive EPS Market Revenue (Million) Forecast, by Application 2019 & 2032
- Table 11: Global MEA Automotive EPS Market Revenue Million Forecast, by Country 2019 & 2032
- Table 12: MEA Automotive EPS Market Revenue (Million) Forecast, by Application 2019 & 2032
- Table 13: Global MEA Automotive EPS Market Revenue Million Forecast, by Country 2019 & 2032
- Table 14: MEA Automotive EPS Market Revenue (Million) Forecast, by Application 2019 & 2032
- Table 15: Global MEA Automotive EPS Market Revenue Million Forecast, by Component Type 2019 & 2032
- Table 16: Global MEA Automotive EPS Market Revenue Million Forecast, by Vehicle Type 2019 & 2032
- Table 17: Global MEA Automotive EPS Market Revenue Million Forecast, by Country 2019 & 2032
- Table 18: United States MEA Automotive EPS Market Revenue (Million) Forecast, by Application 2019 & 2032
- Table 19: Canada MEA Automotive EPS Market Revenue (Million) Forecast, by Application 2019 & 2032
- Table 20: Mexico MEA Automotive EPS Market Revenue (Million) Forecast, by Application 2019 & 2032
- Table 21: Global MEA Automotive EPS Market Revenue Million Forecast, by Component Type 2019 & 2032
- Table 22: Global MEA Automotive EPS Market Revenue Million Forecast, by Vehicle Type 2019 & 2032
- Table 23: Global MEA Automotive EPS Market Revenue Million Forecast, by Country 2019 & 2032
- Table 24: Brazil MEA Automotive EPS Market Revenue (Million) Forecast, by Application 2019 & 2032
- Table 25: Argentina MEA Automotive EPS Market Revenue (Million) Forecast, by Application 2019 & 2032
- Table 26: Rest of South America MEA Automotive EPS Market Revenue (Million) Forecast, by Application 2019 & 2032
- Table 27: Global MEA Automotive EPS Market Revenue Million Forecast, by Component Type 2019 & 2032
- Table 28: Global MEA Automotive EPS Market Revenue Million Forecast, by Vehicle Type 2019 & 2032
- Table 29: Global MEA Automotive EPS Market Revenue Million Forecast, by Country 2019 & 2032
- Table 30: United Kingdom MEA Automotive EPS Market Revenue (Million) Forecast, by Application 2019 & 2032
- Table 31: Germany MEA Automotive EPS Market Revenue (Million) Forecast, by Application 2019 & 2032
- Table 32: France MEA Automotive EPS Market Revenue (Million) Forecast, by Application 2019 & 2032
- Table 33: Italy MEA Automotive EPS Market Revenue (Million) Forecast, by Application 2019 & 2032
- Table 34: Spain MEA Automotive EPS Market Revenue (Million) Forecast, by Application 2019 & 2032
- Table 35: Russia MEA Automotive EPS Market Revenue (Million) Forecast, by Application 2019 & 2032
- Table 36: Benelux MEA Automotive EPS Market Revenue (Million) Forecast, by Application 2019 & 2032
- Table 37: Nordics MEA Automotive EPS Market Revenue (Million) Forecast, by Application 2019 & 2032
- Table 38: Rest of Europe MEA Automotive EPS Market Revenue (Million) Forecast, by Application 2019 & 2032
- Table 39: Global MEA Automotive EPS Market Revenue Million Forecast, by Component Type 2019 & 2032
- Table 40: Global MEA Automotive EPS Market Revenue Million Forecast, by Vehicle Type 2019 & 2032
- Table 41: Global MEA Automotive EPS Market Revenue Million Forecast, by Country 2019 & 2032
- Table 42: Turkey MEA Automotive EPS Market Revenue (Million) Forecast, by Application 2019 & 2032
- Table 43: Israel MEA Automotive EPS Market Revenue (Million) Forecast, by Application 2019 & 2032
- Table 44: GCC MEA Automotive EPS Market Revenue (Million) Forecast, by Application 2019 & 2032
- Table 45: North Africa MEA Automotive EPS Market Revenue (Million) Forecast, by Application 2019 & 2032
- Table 46: South Africa MEA Automotive EPS Market Revenue (Million) Forecast, by Application 2019 & 2032
- Table 47: Rest of Middle East & Africa MEA Automotive EPS Market Revenue (Million) Forecast, by Application 2019 & 2032
- Table 48: Global MEA Automotive EPS Market Revenue Million Forecast, by Component Type 2019 & 2032
- Table 49: Global MEA Automotive EPS Market Revenue Million Forecast, by Vehicle Type 2019 & 2032
- Table 50: Global MEA Automotive EPS Market Revenue Million Forecast, by Country 2019 & 2032
- Table 51: China MEA Automotive EPS Market Revenue (Million) Forecast, by Application 2019 & 2032
- Table 52: India MEA Automotive EPS Market Revenue (Million) Forecast, by Application 2019 & 2032
- Table 53: Japan MEA Automotive EPS Market Revenue (Million) Forecast, by Application 2019 & 2032
- Table 54: South Korea MEA Automotive EPS Market Revenue (Million) Forecast, by Application 2019 & 2032
- Table 55: ASEAN MEA Automotive EPS Market Revenue (Million) Forecast, by Application 2019 & 2032
- Table 56: Oceania MEA Automotive EPS Market Revenue (Million) Forecast, by Application 2019 & 2032
- Table 57: Rest of Asia Pacific MEA Automotive EPS Market Revenue (Million) Forecast, by Application 2019 & 2032
Frequently Asked Questions
1. What is the projected Compound Annual Growth Rate (CAGR) of the MEA Automotive EPS Market?
The projected CAGR is approximately 10.95%.
2. Which companies are prominent players in the MEA Automotive EPS Market?
Key companies in the market include JTEKT Corporation, Infineon Technologies, NSK Ltd, Mando Corporation, Mitsubishi Electric Corporation*List Not Exhaustive 6 3 *List Not Exhaustiv, Robert Bosch GmbH, ATS Automation Tooling Systems Inc, Delphi Automotive Systems, Thyssenkrupp Presta AG, ZF Friedrichshafen AG.
3. What are the main segments of the MEA Automotive EPS Market?
The market segments include Component Type, Vehicle Type.
4. Can you provide details about the market size?
The market size is estimated to be USD XX Million as of 2022.
5. What are some drivers contributing to market growth?
Rise in demand for Luxury Cars Across the Country.
6. What are the notable trends driving market growth?
ECU is the Fastest-Growing Component.
7. Are there any restraints impacting market growth?
High Cost Associated with the Product.
8. Can you provide examples of recent developments in the market?
N/A
9. What pricing options are available for accessing the report?
Pricing options include single-user, multi-user, and enterprise licenses priced at USD 4750, USD 4950, and USD 6800 respectively.
10. Is the market size provided in terms of value or volume?
The market size is provided in terms of value, measured in Million.
11. Are there any specific market keywords associated with the report?
Yes, the market keyword associated with the report is "MEA Automotive EPS Market," which aids in identifying and referencing the specific market segment covered.
12. How do I determine which pricing option suits my needs best?
The pricing options vary based on user requirements and access needs. Individual users may opt for single-user licenses, while businesses requiring broader access may choose multi-user or enterprise licenses for cost-effective access to the report.
13. Are there any additional resources or data provided in the MEA Automotive EPS Market report?
While the report offers comprehensive insights, it's advisable to review the specific contents or supplementary materials provided to ascertain if additional resources or data are available.
14. How can I stay updated on further developments or reports in the MEA Automotive EPS Market?
To stay informed about further developments, trends, and reports in the MEA Automotive EPS Market, consider subscribing to industry newsletters, following relevant companies and organizations, or regularly checking reputable industry news sources and publications.
Methodology
Step 1 - Identification of Relevant Samples Size from Population Database


Step 2 - Approaches for Defining Global Market Size (Value, Volume* & Price*)

Note*: In applicable scenarios
Step 3 - Data Sources
Primary Research
- Web Analytics
- Survey Reports
- Research Institute
- Latest Research Reports
- Opinion Leaders
Secondary Research
- Annual Reports
- White Paper
- Latest Press Release
- Industry Association
- Paid Database
- Investor Presentations

Step 4 - Data Triangulation
Involves using different sources of information in order to increase the validity of a study
These sources are likely to be stakeholders in a program - participants, other researchers, program staff, other community members, and so on.
Then we put all data in single framework & apply various statistical tools to find out the dynamic on the market.
During the analysis stage, feedback from the stakeholder groups would be compared to determine areas of agreement as well as areas of divergence
