

Key Insights
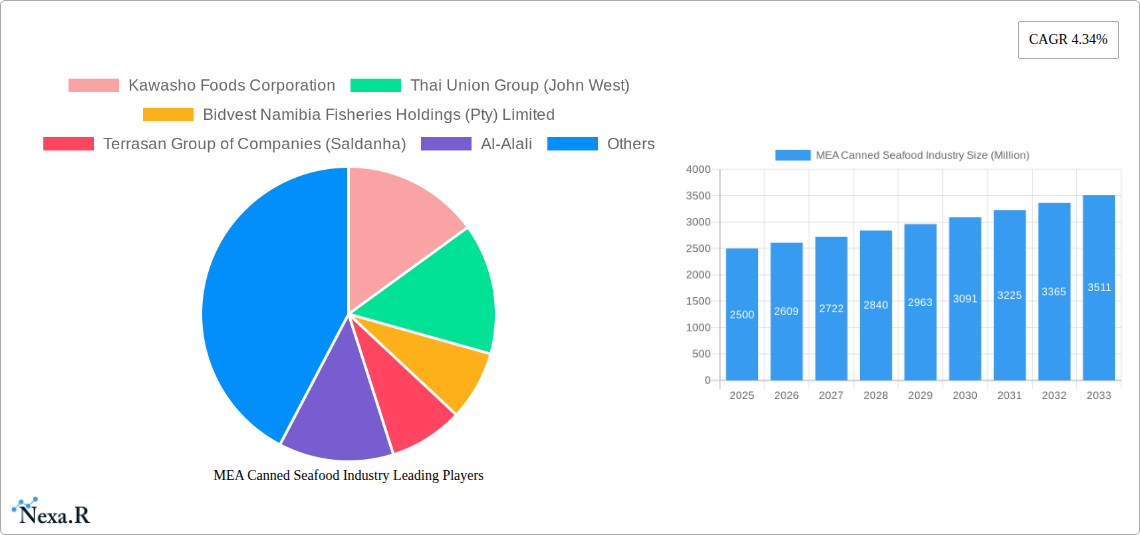
The MEA canned seafood market, encompassing countries like the United Arab Emirates, Saudi Arabia, and South Africa, presents a dynamic landscape with significant growth potential. Driven by increasing consumer demand for convenient and protein-rich food options, coupled with rising disposable incomes and changing dietary habits across the region, the market is projected to exhibit a robust Compound Annual Growth Rate (CAGR) of 4.34% from 2025 to 2033. The market is segmented by distribution channel (supermarkets/hypermarkets, convenience stores, online retailers, others) and product type (canned fish, canned shrimp, canned prawns, others). Supermarkets and hypermarkets currently dominate distribution, but online retailers are experiencing rapid growth, fueled by increased internet penetration and e-commerce adoption. Canned tuna and shrimp are popular choices, reflecting consumer preferences and cultural culinary practices. While the market faces challenges such as fluctuating raw material prices and potential supply chain disruptions, the overall growth trajectory remains positive. The presence of established international players alongside regional brands contributes to market competitiveness, driving innovation and product diversification.
Growth is expected to be particularly strong in countries with expanding populations and rising middle classes, such as Saudi Arabia and the UAE. Factors such as increased health awareness and the growing popularity of seafood as a healthy protein source further stimulate market expansion. However, potential restraints include stringent food safety regulations, which necessitate investments in compliance and quality control measures. Furthermore, competition among various brands will likely intensify, necessitating strategic pricing and marketing strategies. The market is poised for further consolidation, with larger players potentially acquiring smaller, regional brands to achieve greater market share and distribution reach. The forecast period of 2025-2033 presents opportunities for businesses to capitalize on the growing demand for convenient and nutritious canned seafood products across the MEA region.
MEA Canned Seafood Industry: Market Analysis & Forecast 2019-2033
This comprehensive report provides an in-depth analysis of the Middle East and Africa (MEA) canned seafood industry, encompassing market dynamics, growth trends, competitive landscape, and future outlook. The study period covers 2019-2033, with a base year of 2025 and a forecast period of 2025-2033. The report leverages extensive data analysis to offer actionable insights for industry professionals, investors, and stakeholders. This report examines the parent market of MEA Seafood Industry and its child market, the MEA Canned Seafood Industry, offering granular insights into market segments and key players. Expected market size values are presented in million units.
MEA Canned Seafood Industry Market Dynamics & Structure
The MEA canned seafood market is characterized by a moderately concentrated landscape, with several key players vying for market share. Technological innovation, primarily focused on improved canning techniques, sustainable sourcing, and extended shelf life, is a key growth driver. Stringent regulatory frameworks concerning food safety and labeling influence industry practices. Competitive substitutes, such as fresh and frozen seafood, pose a challenge, while consumer preferences toward health and convenience are shaping demand. Mergers and acquisitions (M&A) activity is contributing to market consolidation, with notable deals recorded in recent years.
- Market Concentration: Moderately concentrated, with top 5 players holding xx% market share (2024).
- Technological Innovation: Focus on sustainable practices, extended shelf life, and improved canning efficiency.
- Regulatory Framework: Stringent food safety and labeling regulations impacting operations.
- Competitive Substitutes: Fresh, frozen, and other preserved seafood products.
- End-User Demographics: Growing middle class, changing dietary habits, and increasing urbanization influence demand.
- M&A Trends: xx major M&A deals recorded between 2019-2024, driving consolidation.
MEA Canned Seafood Industry Growth Trends & Insights
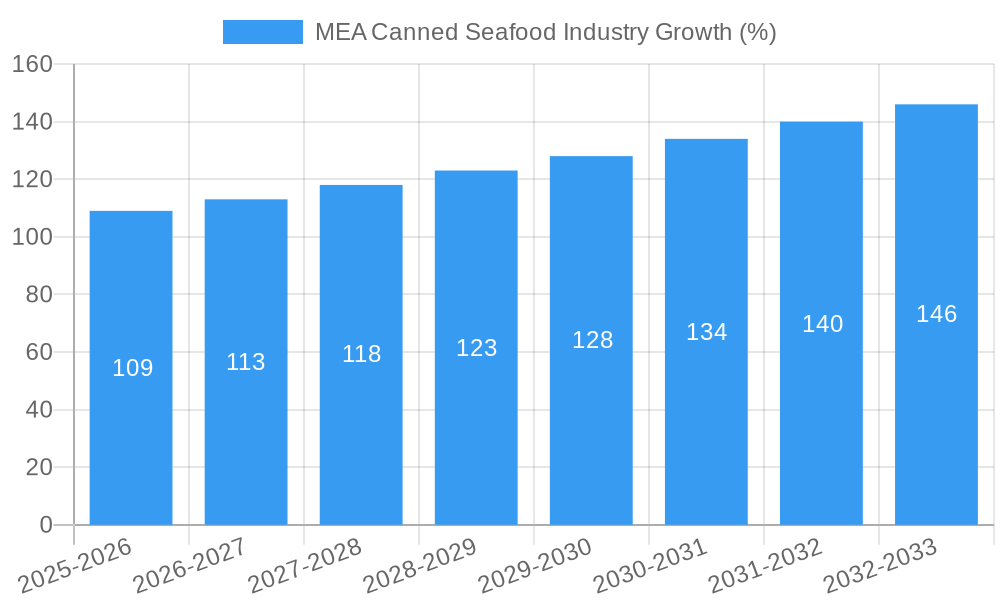
The MEA canned seafood market is experiencing steady growth, driven by factors such as rising disposable incomes, increasing urbanization, and changing consumer preferences. The market size is projected to reach xx million units by 2025, growing at a CAGR of xx% during the forecast period (2025-2033). This growth is fuelled by the expanding popularity of convenient and shelf-stable seafood options, particularly in urban areas. Technological advancements in processing and packaging are also enhancing product quality and shelf life, further boosting demand. Consumer behavior shifts towards healthier dietary choices and increased awareness of sustainable seafood practices are influencing market dynamics. The adoption rate of canned seafood is increasing steadily across various segments, particularly among younger demographics.
Dominant Regions, Countries, or Segments in MEA Canned Seafood Industry
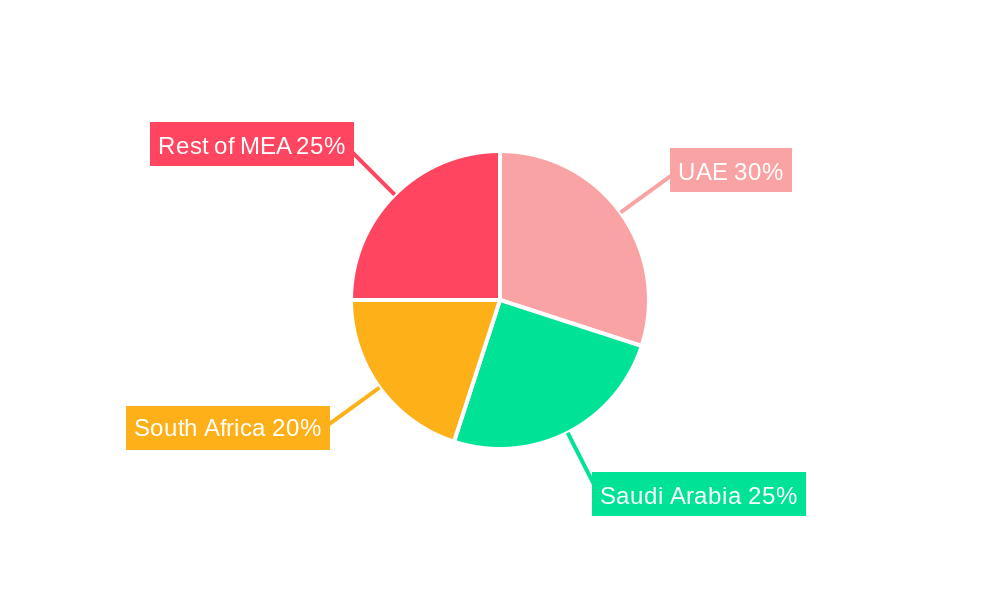
The canned seafood market in the MEA region is geographically diverse. However, [Specific country/region, e.g., the UAE and Saudi Arabia] currently dominate, driven by factors such as high seafood consumption rates, strong retail infrastructure, and substantial investments in the food processing sector. The supermarkets/hypermarkets channel remains the largest distribution segment, capturing xx% of the market share, followed by convenience stores with xx%.
- Key Drivers (UAE & Saudi Arabia): High disposable income, large expat population, robust retail infrastructure, government initiatives supporting the food industry.
- Canned Fish Segment Dominance: This segment holds the largest market share (xx%) due to widespread acceptance and affordability.
- Online Retail Growth: Growing penetration of online grocery platforms is expanding access to canned seafood in less developed areas.
- Growth Potential: Untapped potential in sub-Saharan Africa and less developed nations drives future growth in less developed regions of MEA.
MEA Canned Seafood Industry Product Landscape
The MEA canned seafood market offers a wide variety of products, including canned fish (tuna, mackerel, sardines), canned shrimp, canned prawns, and other types (e.g., mussels, crab). Recent product innovations focus on enhanced flavor profiles, convenient packaging, and sustainable sourcing. Value-added products, such as flavored or ready-to-eat canned seafood, are gaining popularity. Technological advancements in canning processes and packaging materials contribute to extended shelf life and superior product quality. Key selling propositions are convenience, affordability, and extended shelf life.
Key Drivers, Barriers & Challenges in MEA Canned Seafood Industry
Key Drivers: Rising disposable incomes, increasing urbanization, growing preference for convenient food options, and health consciousness fuel market expansion. Government support for the food processing sector and expanding retail infrastructure also play a crucial role.
Challenges & Restraints: Fluctuations in raw material prices, supply chain disruptions, stringent regulatory compliance requirements, competition from fresh/frozen seafood, and the adoption of sustainable fishing practices remain challenges. The impact of these restraints on market growth is estimated to be xx% (2025).
Emerging Opportunities in MEA Canned Seafood Industry
Emerging opportunities exist in tapping into untapped markets in sub-Saharan Africa, expanding into value-added products like ready-to-eat meals, and focusing on sustainable and ethically sourced seafood to cater to growing health consciousness. Further opportunities exist in leveraging e-commerce platforms to improve market access and reach a wider consumer base.
Growth Accelerators in the MEA Canned Seafood Industry
Long-term growth in the MEA canned seafood industry will be propelled by technological advancements in processing and packaging, strategic partnerships to secure sustainable supply chains, and expansion into new markets and product segments. Government support for the industry and initiatives promoting sustainable fishing practices will further accelerate growth.
Key Players Shaping the MEA Canned Seafood Industry Market
- Kawasho Foods Corporation
- Thai Union Group (John West) Thai Union Group
- Bidvest Namibia Fisheries Holdings (Pty) Limited
- Terrasan Group of Companies (Saldanha)
- Al-Alali
- Shrimp Nation
- Oceana Group Limited Oceana Group
- Bolton Group B V
- Trident Seafood Corporation
- American Tuna Inc
Notable Milestones in MEA Canned Seafood Industry Sector
- November 2022: Thai Union Group's acquisition of a 50% stake in Aegir Seafood expanded its product portfolio and strengthened its market position.
- April 2022: Shrimp Nation's UAE expansion signifies growing demand for high-quality seafood in the region.
- August 2021: Bolton Group B.V.'s acquisition of Wild Planet Foods boosted its sustainable seafood offerings and global presence.
In-Depth MEA Canned Seafood Industry Market Outlook
The MEA canned seafood market presents significant long-term growth potential. Continued urbanization, rising disposable incomes, and the increasing demand for convenient and healthy food options will drive market expansion. Strategic partnerships focusing on sustainable sourcing and technological innovation in processing and packaging will further enhance market competitiveness. Opportunities exist in exploring new markets, developing value-added products, and leveraging digital platforms to reach a wider consumer base. The market's future is bright, offering considerable opportunities for businesses to capitalize on the growing demand for canned seafood in the region.
MEA Canned Seafood Industry Segmentation
-
1. Type
-
1.1. Canned Fish
- 1.1.1. Tuna
- 1.1.2. Salmon
- 1.1.3. Sardines
- 1.1.4. Mackrel
- 1.2. Canned Shrimp
- 1.3. Canned Prawns
- 1.4. Other Types
-
1.1. Canned Fish
-
2. Distribution Channel
- 2.1. Supermarkets/Hypermarkets
- 2.2. Convenience Stores
- 2.3. Online Retailers
- 2.4. Other Distruibution Channels
-
3. Geography
- 3.1. United Arab Emirates
- 3.2. South Africa
- 3.3. Rest of the Middle East and Africa
MEA Canned Seafood Industry Segmentation By Geography
- 1. United Arab Emirates
- 2. South Africa
- 3. Rest of the Middle East and Africa
MEA Canned Seafood Industry REPORT HIGHLIGHTS
| Aspects | Details |
|---|---|
| Study Period | 2019-2033 |
| Base Year | 2024 |
| Estimated Year | 2025 |
| Forecast Period | 2025-2033 |
| Historical Period | 2019-2024 |
| Growth Rate | CAGR of 4.34% from 2019-2033 |
| Segmentation |
|
Table of Contents
- 1. Introduction
- 1.1. Research Scope
- 1.2. Market Segmentation
- 1.3. Research Methodology
- 1.4. Definitions and Assumptions
- 2. Executive Summary
- 2.1. Introduction
- 3. Market Dynamics
- 3.1. Introduction
- 3.2. Market Drivers
- 3.2.1. Increasing Consumer Demand for Convenient Food such as Canned seafood
- 3.3. Market Restrains
- 3.3.1. Many consumers perceive fresh seafood as healthier compared to canned options
- 3.4. Market Trends
- 3.4.1. Growing Popularity For Seafood Among Meat Products
- 4. Market Factor Analysis
- 4.1. Porters Five Forces
- 4.2. Supply/Value Chain
- 4.3. PESTEL analysis
- 4.4. Market Entropy
- 4.5. Patent/Trademark Analysis
- 5. Global MEA Canned Seafood Industry Analysis, Insights and Forecast, 2019-2031
- 5.1. Market Analysis, Insights and Forecast - by Type
- 5.1.1. Canned Fish
- 5.1.1.1. Tuna
- 5.1.1.2. Salmon
- 5.1.1.3. Sardines
- 5.1.1.4. Mackrel
- 5.1.2. Canned Shrimp
- 5.1.3. Canned Prawns
- 5.1.4. Other Types
- 5.1.1. Canned Fish
- 5.2. Market Analysis, Insights and Forecast - by Distribution Channel
- 5.2.1. Supermarkets/Hypermarkets
- 5.2.2. Convenience Stores
- 5.2.3. Online Retailers
- 5.2.4. Other Distruibution Channels
- 5.3. Market Analysis, Insights and Forecast - by Geography
- 5.3.1. United Arab Emirates
- 5.3.2. South Africa
- 5.3.3. Rest of the Middle East and Africa
- 5.4. Market Analysis, Insights and Forecast - by Region
- 5.4.1. United Arab Emirates
- 5.4.2. South Africa
- 5.4.3. Rest of the Middle East and Africa
- 5.1. Market Analysis, Insights and Forecast - by Type
- 6. United Arab Emirates MEA Canned Seafood Industry Analysis, Insights and Forecast, 2019-2031
- 6.1. Market Analysis, Insights and Forecast - by Type
- 6.1.1. Canned Fish
- 6.1.1.1. Tuna
- 6.1.1.2. Salmon
- 6.1.1.3. Sardines
- 6.1.1.4. Mackrel
- 6.1.2. Canned Shrimp
- 6.1.3. Canned Prawns
- 6.1.4. Other Types
- 6.1.1. Canned Fish
- 6.2. Market Analysis, Insights and Forecast - by Distribution Channel
- 6.2.1. Supermarkets/Hypermarkets
- 6.2.2. Convenience Stores
- 6.2.3. Online Retailers
- 6.2.4. Other Distruibution Channels
- 6.3. Market Analysis, Insights and Forecast - by Geography
- 6.3.1. United Arab Emirates
- 6.3.2. South Africa
- 6.3.3. Rest of the Middle East and Africa
- 6.1. Market Analysis, Insights and Forecast - by Type
- 7. South Africa MEA Canned Seafood Industry Analysis, Insights and Forecast, 2019-2031
- 7.1. Market Analysis, Insights and Forecast - by Type
- 7.1.1. Canned Fish
- 7.1.1.1. Tuna
- 7.1.1.2. Salmon
- 7.1.1.3. Sardines
- 7.1.1.4. Mackrel
- 7.1.2. Canned Shrimp
- 7.1.3. Canned Prawns
- 7.1.4. Other Types
- 7.1.1. Canned Fish
- 7.2. Market Analysis, Insights and Forecast - by Distribution Channel
- 7.2.1. Supermarkets/Hypermarkets
- 7.2.2. Convenience Stores
- 7.2.3. Online Retailers
- 7.2.4. Other Distruibution Channels
- 7.3. Market Analysis, Insights and Forecast - by Geography
- 7.3.1. United Arab Emirates
- 7.3.2. South Africa
- 7.3.3. Rest of the Middle East and Africa
- 7.1. Market Analysis, Insights and Forecast - by Type
- 8. Rest of the Middle East and Africa MEA Canned Seafood Industry Analysis, Insights and Forecast, 2019-2031
- 8.1. Market Analysis, Insights and Forecast - by Type
- 8.1.1. Canned Fish
- 8.1.1.1. Tuna
- 8.1.1.2. Salmon
- 8.1.1.3. Sardines
- 8.1.1.4. Mackrel
- 8.1.2. Canned Shrimp
- 8.1.3. Canned Prawns
- 8.1.4. Other Types
- 8.1.1. Canned Fish
- 8.2. Market Analysis, Insights and Forecast - by Distribution Channel
- 8.2.1. Supermarkets/Hypermarkets
- 8.2.2. Convenience Stores
- 8.2.3. Online Retailers
- 8.2.4. Other Distruibution Channels
- 8.3. Market Analysis, Insights and Forecast - by Geography
- 8.3.1. United Arab Emirates
- 8.3.2. South Africa
- 8.3.3. Rest of the Middle East and Africa
- 8.1. Market Analysis, Insights and Forecast - by Type
- 9. United Arab Emirates MEA Canned Seafood Industry Analysis, Insights and Forecast, 2019-2031
- 10. Saudi Arabia MEA Canned Seafood Industry Analysis, Insights and Forecast, 2019-2031
- 11. South Africa MEA Canned Seafood Industry Analysis, Insights and Forecast, 2019-2031
- 12. Rest of Middle East and Africa MEA Canned Seafood Industry Analysis, Insights and Forecast, 2019-2031
- 13. Competitive Analysis
- 13.1. Global Market Share Analysis 2024
- 13.2. Company Profiles
- 13.2.1 Kawasho Foods Corporation
- 13.2.1.1. Overview
- 13.2.1.2. Products
- 13.2.1.3. SWOT Analysis
- 13.2.1.4. Recent Developments
- 13.2.1.5. Financials (Based on Availability)
- 13.2.2 Thai Union Group (John West)
- 13.2.2.1. Overview
- 13.2.2.2. Products
- 13.2.2.3. SWOT Analysis
- 13.2.2.4. Recent Developments
- 13.2.2.5. Financials (Based on Availability)
- 13.2.3 Bidvest Namibia Fisheries Holdings (Pty) Limited
- 13.2.3.1. Overview
- 13.2.3.2. Products
- 13.2.3.3. SWOT Analysis
- 13.2.3.4. Recent Developments
- 13.2.3.5. Financials (Based on Availability)
- 13.2.4 Terrasan Group of Companies (Saldanha)
- 13.2.4.1. Overview
- 13.2.4.2. Products
- 13.2.4.3. SWOT Analysis
- 13.2.4.4. Recent Developments
- 13.2.4.5. Financials (Based on Availability)
- 13.2.5 Al-Alali
- 13.2.5.1. Overview
- 13.2.5.2. Products
- 13.2.5.3. SWOT Analysis
- 13.2.5.4. Recent Developments
- 13.2.5.5. Financials (Based on Availability)
- 13.2.6 Shrimp Nation
- 13.2.6.1. Overview
- 13.2.6.2. Products
- 13.2.6.3. SWOT Analysis
- 13.2.6.4. Recent Developments
- 13.2.6.5. Financials (Based on Availability)
- 13.2.7 Oceana Group Limited
- 13.2.7.1. Overview
- 13.2.7.2. Products
- 13.2.7.3. SWOT Analysis
- 13.2.7.4. Recent Developments
- 13.2.7.5. Financials (Based on Availability)
- 13.2.8 Bolton Group B V
- 13.2.8.1. Overview
- 13.2.8.2. Products
- 13.2.8.3. SWOT Analysis
- 13.2.8.4. Recent Developments
- 13.2.8.5. Financials (Based on Availability)
- 13.2.9 Trident Seafood Corporation
- 13.2.9.1. Overview
- 13.2.9.2. Products
- 13.2.9.3. SWOT Analysis
- 13.2.9.4. Recent Developments
- 13.2.9.5. Financials (Based on Availability)
- 13.2.10 American Tuna Inc
- 13.2.10.1. Overview
- 13.2.10.2. Products
- 13.2.10.3. SWOT Analysis
- 13.2.10.4. Recent Developments
- 13.2.10.5. Financials (Based on Availability)
- 13.2.1 Kawasho Foods Corporation
List of Figures
- Figure 1: Global MEA Canned Seafood Industry Revenue Breakdown (Million, %) by Region 2024 & 2032
- Figure 2: Global MEA Canned Seafood Industry Volume Breakdown (K Tons, %) by Region 2024 & 2032
- Figure 3: MEA MEA Canned Seafood Industry Revenue (Million), by Country 2024 & 2032
- Figure 4: MEA MEA Canned Seafood Industry Volume (K Tons), by Country 2024 & 2032
- Figure 5: MEA MEA Canned Seafood Industry Revenue Share (%), by Country 2024 & 2032
- Figure 6: MEA MEA Canned Seafood Industry Volume Share (%), by Country 2024 & 2032
- Figure 7: United Arab Emirates MEA Canned Seafood Industry Revenue (Million), by Type 2024 & 2032
- Figure 8: United Arab Emirates MEA Canned Seafood Industry Volume (K Tons), by Type 2024 & 2032
- Figure 9: United Arab Emirates MEA Canned Seafood Industry Revenue Share (%), by Type 2024 & 2032
- Figure 10: United Arab Emirates MEA Canned Seafood Industry Volume Share (%), by Type 2024 & 2032
- Figure 11: United Arab Emirates MEA Canned Seafood Industry Revenue (Million), by Distribution Channel 2024 & 2032
- Figure 12: United Arab Emirates MEA Canned Seafood Industry Volume (K Tons), by Distribution Channel 2024 & 2032
- Figure 13: United Arab Emirates MEA Canned Seafood Industry Revenue Share (%), by Distribution Channel 2024 & 2032
- Figure 14: United Arab Emirates MEA Canned Seafood Industry Volume Share (%), by Distribution Channel 2024 & 2032
- Figure 15: United Arab Emirates MEA Canned Seafood Industry Revenue (Million), by Geography 2024 & 2032
- Figure 16: United Arab Emirates MEA Canned Seafood Industry Volume (K Tons), by Geography 2024 & 2032
- Figure 17: United Arab Emirates MEA Canned Seafood Industry Revenue Share (%), by Geography 2024 & 2032
- Figure 18: United Arab Emirates MEA Canned Seafood Industry Volume Share (%), by Geography 2024 & 2032
- Figure 19: United Arab Emirates MEA Canned Seafood Industry Revenue (Million), by Country 2024 & 2032
- Figure 20: United Arab Emirates MEA Canned Seafood Industry Volume (K Tons), by Country 2024 & 2032
- Figure 21: United Arab Emirates MEA Canned Seafood Industry Revenue Share (%), by Country 2024 & 2032
- Figure 22: United Arab Emirates MEA Canned Seafood Industry Volume Share (%), by Country 2024 & 2032
- Figure 23: South Africa MEA Canned Seafood Industry Revenue (Million), by Type 2024 & 2032
- Figure 24: South Africa MEA Canned Seafood Industry Volume (K Tons), by Type 2024 & 2032
- Figure 25: South Africa MEA Canned Seafood Industry Revenue Share (%), by Type 2024 & 2032
- Figure 26: South Africa MEA Canned Seafood Industry Volume Share (%), by Type 2024 & 2032
- Figure 27: South Africa MEA Canned Seafood Industry Revenue (Million), by Distribution Channel 2024 & 2032
- Figure 28: South Africa MEA Canned Seafood Industry Volume (K Tons), by Distribution Channel 2024 & 2032
- Figure 29: South Africa MEA Canned Seafood Industry Revenue Share (%), by Distribution Channel 2024 & 2032
- Figure 30: South Africa MEA Canned Seafood Industry Volume Share (%), by Distribution Channel 2024 & 2032
- Figure 31: South Africa MEA Canned Seafood Industry Revenue (Million), by Geography 2024 & 2032
- Figure 32: South Africa MEA Canned Seafood Industry Volume (K Tons), by Geography 2024 & 2032
- Figure 33: South Africa MEA Canned Seafood Industry Revenue Share (%), by Geography 2024 & 2032
- Figure 34: South Africa MEA Canned Seafood Industry Volume Share (%), by Geography 2024 & 2032
- Figure 35: South Africa MEA Canned Seafood Industry Revenue (Million), by Country 2024 & 2032
- Figure 36: South Africa MEA Canned Seafood Industry Volume (K Tons), by Country 2024 & 2032
- Figure 37: South Africa MEA Canned Seafood Industry Revenue Share (%), by Country 2024 & 2032
- Figure 38: South Africa MEA Canned Seafood Industry Volume Share (%), by Country 2024 & 2032
- Figure 39: Rest of the Middle East and Africa MEA Canned Seafood Industry Revenue (Million), by Type 2024 & 2032
- Figure 40: Rest of the Middle East and Africa MEA Canned Seafood Industry Volume (K Tons), by Type 2024 & 2032
- Figure 41: Rest of the Middle East and Africa MEA Canned Seafood Industry Revenue Share (%), by Type 2024 & 2032
- Figure 42: Rest of the Middle East and Africa MEA Canned Seafood Industry Volume Share (%), by Type 2024 & 2032
- Figure 43: Rest of the Middle East and Africa MEA Canned Seafood Industry Revenue (Million), by Distribution Channel 2024 & 2032
- Figure 44: Rest of the Middle East and Africa MEA Canned Seafood Industry Volume (K Tons), by Distribution Channel 2024 & 2032
- Figure 45: Rest of the Middle East and Africa MEA Canned Seafood Industry Revenue Share (%), by Distribution Channel 2024 & 2032
- Figure 46: Rest of the Middle East and Africa MEA Canned Seafood Industry Volume Share (%), by Distribution Channel 2024 & 2032
- Figure 47: Rest of the Middle East and Africa MEA Canned Seafood Industry Revenue (Million), by Geography 2024 & 2032
- Figure 48: Rest of the Middle East and Africa MEA Canned Seafood Industry Volume (K Tons), by Geography 2024 & 2032
- Figure 49: Rest of the Middle East and Africa MEA Canned Seafood Industry Revenue Share (%), by Geography 2024 & 2032
- Figure 50: Rest of the Middle East and Africa MEA Canned Seafood Industry Volume Share (%), by Geography 2024 & 2032
- Figure 51: Rest of the Middle East and Africa MEA Canned Seafood Industry Revenue (Million), by Country 2024 & 2032
- Figure 52: Rest of the Middle East and Africa MEA Canned Seafood Industry Volume (K Tons), by Country 2024 & 2032
- Figure 53: Rest of the Middle East and Africa MEA Canned Seafood Industry Revenue Share (%), by Country 2024 & 2032
- Figure 54: Rest of the Middle East and Africa MEA Canned Seafood Industry Volume Share (%), by Country 2024 & 2032
List of Tables
- Table 1: Global MEA Canned Seafood Industry Revenue Million Forecast, by Region 2019 & 2032
- Table 2: Global MEA Canned Seafood Industry Volume K Tons Forecast, by Region 2019 & 2032
- Table 3: Global MEA Canned Seafood Industry Revenue Million Forecast, by Type 2019 & 2032
- Table 4: Global MEA Canned Seafood Industry Volume K Tons Forecast, by Type 2019 & 2032
- Table 5: Global MEA Canned Seafood Industry Revenue Million Forecast, by Distribution Channel 2019 & 2032
- Table 6: Global MEA Canned Seafood Industry Volume K Tons Forecast, by Distribution Channel 2019 & 2032
- Table 7: Global MEA Canned Seafood Industry Revenue Million Forecast, by Geography 2019 & 2032
- Table 8: Global MEA Canned Seafood Industry Volume K Tons Forecast, by Geography 2019 & 2032
- Table 9: Global MEA Canned Seafood Industry Revenue Million Forecast, by Region 2019 & 2032
- Table 10: Global MEA Canned Seafood Industry Volume K Tons Forecast, by Region 2019 & 2032
- Table 11: Global MEA Canned Seafood Industry Revenue Million Forecast, by Country 2019 & 2032
- Table 12: Global MEA Canned Seafood Industry Volume K Tons Forecast, by Country 2019 & 2032
- Table 13: United Arab Emirates MEA Canned Seafood Industry Revenue (Million) Forecast, by Application 2019 & 2032
- Table 14: United Arab Emirates MEA Canned Seafood Industry Volume (K Tons) Forecast, by Application 2019 & 2032
- Table 15: Saudi Arabia MEA Canned Seafood Industry Revenue (Million) Forecast, by Application 2019 & 2032
- Table 16: Saudi Arabia MEA Canned Seafood Industry Volume (K Tons) Forecast, by Application 2019 & 2032
- Table 17: South Africa MEA Canned Seafood Industry Revenue (Million) Forecast, by Application 2019 & 2032
- Table 18: South Africa MEA Canned Seafood Industry Volume (K Tons) Forecast, by Application 2019 & 2032
- Table 19: Rest of Middle East and Africa MEA Canned Seafood Industry Revenue (Million) Forecast, by Application 2019 & 2032
- Table 20: Rest of Middle East and Africa MEA Canned Seafood Industry Volume (K Tons) Forecast, by Application 2019 & 2032
- Table 21: Global MEA Canned Seafood Industry Revenue Million Forecast, by Type 2019 & 2032
- Table 22: Global MEA Canned Seafood Industry Volume K Tons Forecast, by Type 2019 & 2032
- Table 23: Global MEA Canned Seafood Industry Revenue Million Forecast, by Distribution Channel 2019 & 2032
- Table 24: Global MEA Canned Seafood Industry Volume K Tons Forecast, by Distribution Channel 2019 & 2032
- Table 25: Global MEA Canned Seafood Industry Revenue Million Forecast, by Geography 2019 & 2032
- Table 26: Global MEA Canned Seafood Industry Volume K Tons Forecast, by Geography 2019 & 2032
- Table 27: Global MEA Canned Seafood Industry Revenue Million Forecast, by Country 2019 & 2032
- Table 28: Global MEA Canned Seafood Industry Volume K Tons Forecast, by Country 2019 & 2032
- Table 29: Global MEA Canned Seafood Industry Revenue Million Forecast, by Type 2019 & 2032
- Table 30: Global MEA Canned Seafood Industry Volume K Tons Forecast, by Type 2019 & 2032
- Table 31: Global MEA Canned Seafood Industry Revenue Million Forecast, by Distribution Channel 2019 & 2032
- Table 32: Global MEA Canned Seafood Industry Volume K Tons Forecast, by Distribution Channel 2019 & 2032
- Table 33: Global MEA Canned Seafood Industry Revenue Million Forecast, by Geography 2019 & 2032
- Table 34: Global MEA Canned Seafood Industry Volume K Tons Forecast, by Geography 2019 & 2032
- Table 35: Global MEA Canned Seafood Industry Revenue Million Forecast, by Country 2019 & 2032
- Table 36: Global MEA Canned Seafood Industry Volume K Tons Forecast, by Country 2019 & 2032
- Table 37: Global MEA Canned Seafood Industry Revenue Million Forecast, by Type 2019 & 2032
- Table 38: Global MEA Canned Seafood Industry Volume K Tons Forecast, by Type 2019 & 2032
- Table 39: Global MEA Canned Seafood Industry Revenue Million Forecast, by Distribution Channel 2019 & 2032
- Table 40: Global MEA Canned Seafood Industry Volume K Tons Forecast, by Distribution Channel 2019 & 2032
- Table 41: Global MEA Canned Seafood Industry Revenue Million Forecast, by Geography 2019 & 2032
- Table 42: Global MEA Canned Seafood Industry Volume K Tons Forecast, by Geography 2019 & 2032
- Table 43: Global MEA Canned Seafood Industry Revenue Million Forecast, by Country 2019 & 2032
- Table 44: Global MEA Canned Seafood Industry Volume K Tons Forecast, by Country 2019 & 2032
Frequently Asked Questions
1. What is the projected Compound Annual Growth Rate (CAGR) of the MEA Canned Seafood Industry?
The projected CAGR is approximately 4.34%.
2. Which companies are prominent players in the MEA Canned Seafood Industry?
Key companies in the market include Kawasho Foods Corporation, Thai Union Group (John West), Bidvest Namibia Fisheries Holdings (Pty) Limited, Terrasan Group of Companies (Saldanha), Al-Alali, Shrimp Nation, Oceana Group Limited, Bolton Group B V, Trident Seafood Corporation, American Tuna Inc.
3. What are the main segments of the MEA Canned Seafood Industry?
The market segments include Type, Distribution Channel, Geography.
4. Can you provide details about the market size?
The market size is estimated to be USD XX Million as of 2022.
5. What are some drivers contributing to market growth?
Increasing Consumer Demand for Convenient Food such as Canned seafood.
6. What are the notable trends driving market growth?
Growing Popularity For Seafood Among Meat Products.
7. Are there any restraints impacting market growth?
Many consumers perceive fresh seafood as healthier compared to canned options.
8. Can you provide examples of recent developments in the market?
November 2022: Thai Union Group converted its loan-based strategic investment in Aegir Seafood into a 50% shareholding, further strengthening the successful business relationship between the two companies. Since Thai Union's initial investment in 2019, Aegir Seafood has made a substantial contribution to the growth of Thai Union's brands and private label business, particularly for King Oscar and Rügen Fisch. This acquisition has allowed Thai Union Group to expand its product portfolio to include high-quality cod liver, which is a premium product that complements its existing range of seafood products.
9. What pricing options are available for accessing the report?
Pricing options include single-user, multi-user, and enterprise licenses priced at USD 4750, USD 5250, and USD 8750 respectively.
10. Is the market size provided in terms of value or volume?
The market size is provided in terms of value, measured in Million and volume, measured in K Tons.
11. Are there any specific market keywords associated with the report?
Yes, the market keyword associated with the report is "MEA Canned Seafood Industry," which aids in identifying and referencing the specific market segment covered.
12. How do I determine which pricing option suits my needs best?
The pricing options vary based on user requirements and access needs. Individual users may opt for single-user licenses, while businesses requiring broader access may choose multi-user or enterprise licenses for cost-effective access to the report.
13. Are there any additional resources or data provided in the MEA Canned Seafood Industry report?
While the report offers comprehensive insights, it's advisable to review the specific contents or supplementary materials provided to ascertain if additional resources or data are available.
14. How can I stay updated on further developments or reports in the MEA Canned Seafood Industry?
To stay informed about further developments, trends, and reports in the MEA Canned Seafood Industry, consider subscribing to industry newsletters, following relevant companies and organizations, or regularly checking reputable industry news sources and publications.
Methodology
Step 1 - Identification of Relevant Samples Size from Population Database


Step 2 - Approaches for Defining Global Market Size (Value, Volume* & Price*)

Note*: In applicable scenarios
Step 3 - Data Sources
Primary Research
- Web Analytics
- Survey Reports
- Research Institute
- Latest Research Reports
- Opinion Leaders
Secondary Research
- Annual Reports
- White Paper
- Latest Press Release
- Industry Association
- Paid Database
- Investor Presentations

Step 4 - Data Triangulation
Involves using different sources of information in order to increase the validity of a study
These sources are likely to be stakeholders in a program - participants, other researchers, program staff, other community members, and so on.
Then we put all data in single framework & apply various statistical tools to find out the dynamic on the market.
During the analysis stage, feedback from the stakeholder groups would be compared to determine areas of agreement as well as areas of divergence
