

Key Insights
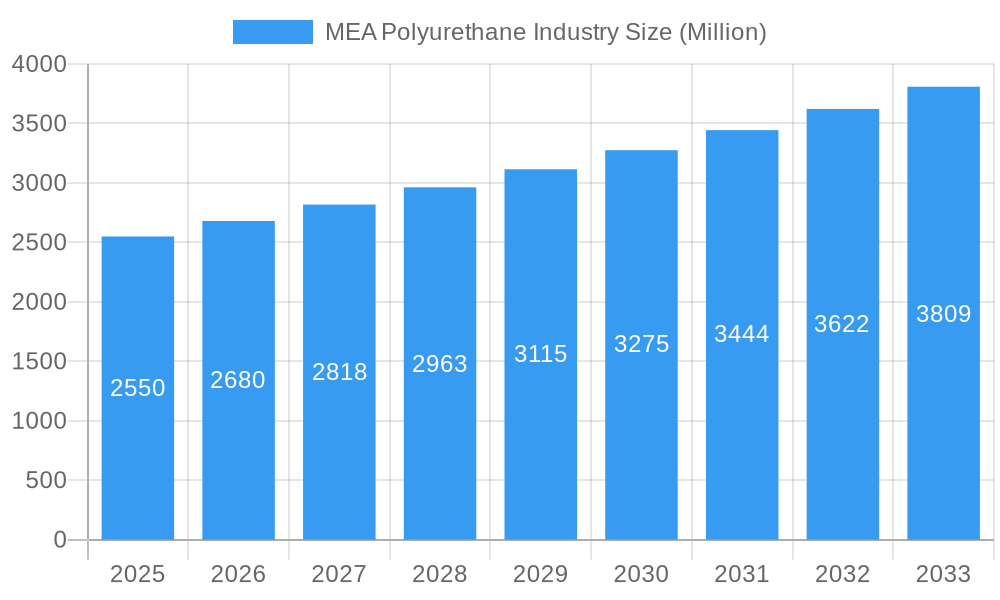
The Middle East and Africa (MEA) Polyurethane Industry is poised for significant expansion, with the market valued at approximately $2.55 billion in 2025 and projected to grow at a Compound Annual Growth Rate (CAGR) of 5.10% through 2033. This robust growth is primarily driven by escalating demand across key end-user industries such as building and construction, furniture and interiors, automotive, and packaging, all of which are experiencing substantial development in the region. Increased urbanization, infrastructure development projects, and a rising disposable income are fueling the adoption of polyurethane in diverse applications like rigid and flexible foams for insulation and cushioning, coatings for protective and aesthetic purposes, adhesives and sealants for construction and manufacturing, and elastomers for durable components. The region's ongoing economic diversification initiatives and a focus on improving living standards are further contributing to this upward trajectory, making MEA a burgeoning market for polyurethane solutions.
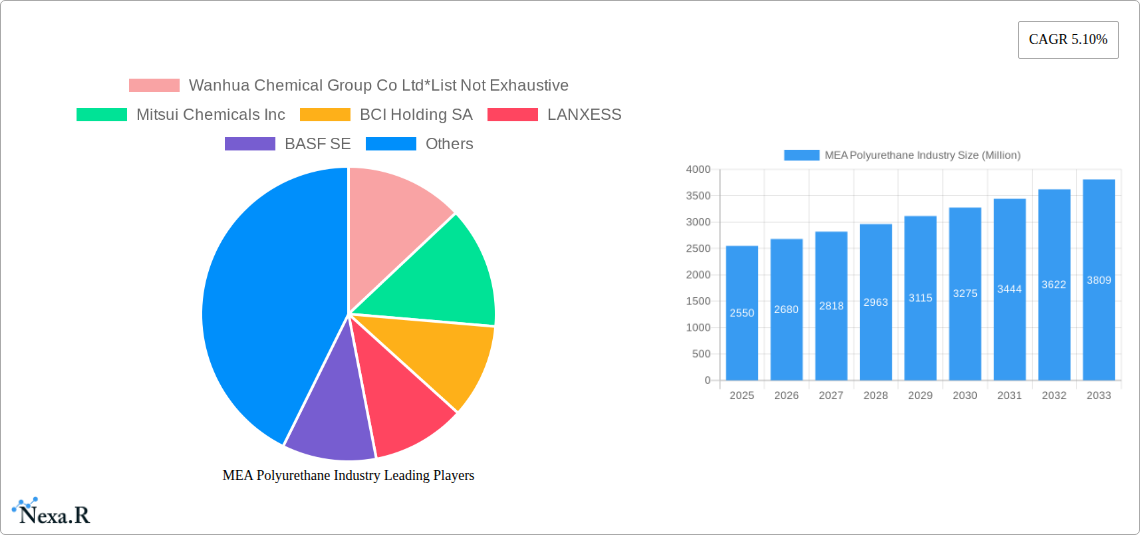
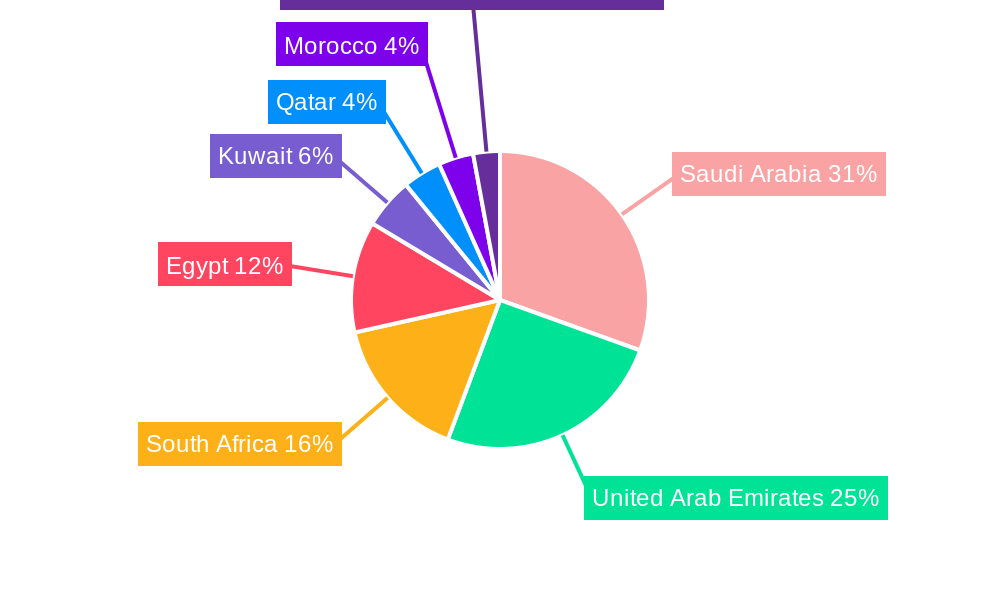
MEA Polyurethane Industry Market Size (In Billion)
The market's expansion is further bolstered by emerging trends such as the growing preference for energy-efficient building materials, where rigid polyurethane foams play a crucial role in insulation, and the increasing use of lightweight yet durable materials in the automotive sector. While the market presents immense opportunities, certain restraints, including fluctuating raw material prices and the availability of skilled labor for advanced application techniques, need strategic management. Leading global players and regional manufacturers are actively investing in expanding their production capacities and product portfolios to cater to the evolving needs of the MEA market. Key geographical markets like Saudi Arabia and the United Arab Emirates, with their ambitious infrastructure projects and booming real estate sectors, are expected to be major growth engines, followed by South Africa and Egypt, indicating a dynamic and promising outlook for the MEA polyurethane industry.
MEA Polyurethane Industry Company Market Share
Report Title: MEA Polyurethane Industry: Market Dynamics, Growth Trends, and Future Outlook (2019-2033)
This comprehensive report offers an in-depth analysis of the Middle East and Africa (MEA) Polyurethane Industry, providing strategic insights and actionable intelligence for stakeholders. Covering a study period from 2019 to 2033, with a base year of 2025, this report meticulously examines market dynamics, growth drivers, competitive landscapes, and future opportunities within this rapidly evolving sector.
MEA Polyurethane Industry Market Dynamics & Structure
The MEA Polyurethane industry is characterized by a dynamic interplay of factors shaping its structure and competitive landscape. Market concentration is influenced by the presence of global giants alongside regional players, with key companies like Wanhua Chemical Group Co Ltd, Mitsui Chemicals Inc, BCI Holding SA, LANXESS, BASF SE, Huntsman International LLC, Kuwait Polyurethane Industries W L L, Dow, Covestro AG, and Perfect Rubber actively participating. Technological innovation is a significant driver, with continuous advancements in polyurethane chemistry leading to enhanced material properties and novel applications. Regulatory frameworks, while evolving, are increasingly focused on sustainability and environmental compliance, impacting product development and manufacturing processes. Competitive product substitutes, such as epoxies and silicones, present challenges, yet the versatility and cost-effectiveness of polyurethanes maintain their market dominance. End-user demographics are diverse, with significant demand stemming from construction, automotive, and furniture sectors. Merger and acquisition (M&A) trends, though not extensively documented in the region, are anticipated to play a role in consolidating market share and fostering innovation.
- Market Concentration: A blend of global multinational corporations and emerging regional manufacturers.
- Technological Innovation: Driven by demand for higher performance, durability, and sustainability in polyurethane materials.
- Regulatory Influence: Growing emphasis on environmental regulations and product safety standards.
- Competitive Landscape: Polyurethanes compete with alternative materials based on performance and cost-benefit analysis.
- End-User Demand: Robust growth projected from construction, automotive, and consumer goods sectors.
- M&A Activity: Potential for strategic consolidation and market entry through acquisitions.
MEA Polyurethane Industry Growth Trends & Insights
The MEA Polyurethane Industry is poised for substantial growth, driven by increasing urbanization, infrastructure development, and a rising middle class across the region. The market size is projected to expand significantly, with a robust Compound Annual Growth Rate (CAGR) expected throughout the forecast period. Adoption rates for various polyurethane applications, particularly in the building and construction and automotive sectors, are escalating due to their excellent insulation properties, lightweight nature, and durability. Technological disruptions, such as the development of bio-based polyurethanes and advanced recycling processes, are not only addressing environmental concerns but also opening up new market avenues. Consumer behavior shifts towards more sustainable and high-performance products are further fueling demand for innovative polyurethane solutions. The estimated market size for the base year 2025 is XX million units, with significant growth anticipated in the coming years.
- Market Size Evolution: Consistent upward trajectory driven by economic growth and industrial expansion.
- Adoption Rates: High and increasing adoption in key end-user industries due to superior properties.
- Technological Disruptions: Innovations in material science and sustainable production methods are key enablers.
- Consumer Behavior Shifts: Growing preference for durable, energy-efficient, and eco-friendly products.
- CAGR Projections: Indicating a strong and sustained growth momentum for the MEA polyurethane market.
- Market Penetration: Deepening penetration across various applications and geographies within the MEA region.
Dominant Regions, Countries, or Segments in MEA Polyurethane Industry
The MEA Polyurethane Industry's dominance is multifaceted, with specific regions, countries, and application segments leading the growth trajectory. Building and Construction stands out as a primary driver, fueled by extensive infrastructure projects, a burgeoning real estate sector, and increasing awareness of energy efficiency in buildings. Countries like Saudi Arabia and the United Arab Emirates are at the forefront, investing heavily in megaprojects that necessitate large volumes of rigid foams for insulation and coatings for protection and aesthetics. Egypt also presents significant growth potential due to its expanding population and ongoing urban development initiatives.
Within the application segments, Foams, particularly Rigid Foam, are experiencing immense demand. This is directly linked to the building and construction sector's need for effective thermal insulation, contributing to energy savings and enhanced living comfort. Flexible Foam also plays a crucial role, driven by the furniture and interiors and automotive industries for seating and comfort applications. The Automotive sector, although a smaller contributor currently compared to construction, is showing promising growth, with polyurethanes used in interiors, seating, and lightweight components. Adhesives and Sealants are also vital, supporting various construction and manufacturing processes across the region.
- Dominant Geography: Saudi Arabia and the United Arab Emirates, propelled by massive infrastructure investments and urban development.
- Key Application Segment: Rigid Foam, driven by stringent energy efficiency standards and new construction projects.
- Emerging Geography: Egypt, with its large population and ongoing urban renewal programs.
- Growth Drivers in Construction: Government initiatives, urban expansion, and demand for sustainable building materials.
- Automotive Sector Growth: Increasing vehicle production and focus on lightweighting and interior comfort.
- Market Share Potential: Significant share captured by insulation and structural applications within the building sector.
MEA Polyurethane Industry Product Landscape
The MEA Polyurethane Industry's product landscape is characterized by continuous innovation and a diverse range of applications. Polyurethanes are engineered to deliver exceptional performance, including superior insulation, durability, flexibility, and chemical resistance. Key product innovations focus on enhancing sustainability, such as the development of bio-based polyols and waterborne polyurethane dispersions (PUDs), aligning with global environmental trends. Applications span across critical sectors, from high-performance coatings for protective surfaces to lightweight elastomers for automotive components and versatile foams for furniture and insulation. The unique selling propositions lie in their tailor-made properties, allowing them to meet specific performance requirements across various demanding applications.
Key Drivers, Barriers & Challenges in MEA Polyurethane Industry
Key Drivers:
- Infrastructure Development: Massive government investments in construction and infrastructure projects across the MEA region.
- Urbanization & Population Growth: Increasing demand for housing, commercial spaces, and improved living standards.
- Energy Efficiency Mandates: Growing focus on energy conservation in buildings driving demand for insulation materials like rigid polyurethane foam.
- Automotive Sector Expansion: Rising vehicle production and a trend towards lighter, more fuel-efficient vehicles.
- Technological Advancements: Continuous innovation in polyurethane formulations offering improved performance and sustainability.
Barriers & Challenges:
- Raw Material Price Volatility: Fluctuations in the prices of key raw materials like crude oil derivatives can impact profitability.
- Skilled Labor Shortage: Limited availability of skilled labor for specialized polyurethane application and manufacturing processes in certain areas.
- Environmental Regulations: Evolving and sometimes stringent environmental regulations can necessitate significant investment in compliance and process upgrades.
- Competition from Substitutes: Presence of alternative materials like EPS, XPS, and mineral wool in specific applications.
- Logistical Complexities: Geographical vastness and logistical challenges in certain parts of the MEA region can impact supply chain efficiency.
Emerging Opportunities in MEA Polyurethane Industry
Emerging opportunities in the MEA Polyurethane Industry are ripe for exploitation, driven by a confluence of technological innovation and evolving market needs. The growing emphasis on sustainable construction and green building practices presents a significant avenue for eco-friendly polyurethane products, including bio-based formulations and those enabling better energy efficiency. The burgeoning renewable energy sector, particularly solar power, will see increased demand for polyurethanes in component manufacturing and protective coatings. Furthermore, the development of advanced composite materials using polyurethanes for lightweighting in automotive and aerospace applications offers considerable growth potential. Untapped markets within sub-Saharan Africa, with their rapidly developing economies and infrastructure needs, represent a substantial frontier for market expansion.
- Sustainable Polyurethane Solutions: Development and adoption of bio-based and recyclable polyurethane materials.
- Renewable Energy Sector Integration: Polyurethanes in components for solar panels, wind turbines, and associated infrastructure.
- Advanced Composites: Lightweighting solutions for automotive, aerospace, and construction.
- Untapped Sub-Saharan African Markets: Expanding reach into emerging economies with high growth potential.
- Smart Building Technologies: Polyurethanes in insulation and sealing solutions for advanced building systems.
Growth Accelerators in the MEA Polyurethane Industry Industry
Long-term growth in the MEA Polyurethane Industry will be significantly accelerated by strategic advancements and market adaptations. The continuous pursuit of higher-performance polyurethanes with enhanced durability, thermal insulation, and fire retardancy will remain a core accelerator. Strategic partnerships between raw material suppliers, manufacturers, and end-users will foster innovation and optimize supply chains, ensuring greater market responsiveness. Furthermore, government initiatives promoting domestic manufacturing and investments in R&D will provide a conducive environment for the industry's expansion. The increasing focus on circular economy principles, leading to the development of effective recycling technologies for polyurethane waste, will not only address environmental concerns but also create new revenue streams and enhance resource efficiency.
Key Players Shaping the MEA Polyurethane Industry Market
- Wanhua Chemical Group Co Ltd
- Mitsui Chemicals Inc
- BCI Holding SA
- LANXESS
- BASF SE
- Huntsman International LLC
- Kuwait Polyurethane Industries W L L
- Dow
- Covestro AG
- Perfect Rubber
Notable Milestones in MEA Polyurethane Industry Sector
- February 2022: BASF SE and NEVEON collaborated on mattress recycling. BASF developed a wet chemical recycling process for used mattresses made of polyurethane, enabling the creation of new beds using alternative polyurethane materials.
- January 2022: Saudi Aramco awarded a contract worth AED 8.2 billion (USD 2.23 billion) to Abu Dhabi's National Petroleum Construction Company (NPCC) for two packages in the Zuluf Offshore Field. The project was expected to be executed over three years.
In-Depth MEA Polyurethane Industry Market Outlook
The MEA Polyurethane Industry is on an upward trajectory, with its future market potential driven by a robust combination of factors. Growth accelerators such as increasing infrastructure development, a rising population, and a growing emphasis on energy efficiency will continue to fuel demand. Strategic opportunities lie in embracing sustainable polyurethane solutions, integrating into the burgeoning renewable energy sector, and developing advanced composite materials. The industry's ability to innovate and adapt to evolving regulatory landscapes and consumer preferences will be paramount in securing sustained growth. The projected market expansion signifies a promising outlook for stakeholders investing in this dynamic and essential sector of the global economy.
MEA Polyurethane Industry Segmentation
-
1. Application
-
1.1. Foams
- 1.1.1. Rigid Foam
- 1.1.2. Flexible Foam
- 1.2. Coatings
- 1.3. Adhesives and Sealants
- 1.4. Elastomers
- 1.5. Other Applications
-
1.1. Foams
-
2. End-user Industry
- 2.1. Furniture and Interiors
- 2.2. Building and Construction
- 2.3. Electronics and Appliances
- 2.4. Automotive
- 2.5. Footwear
- 2.6. Packaging
- 2.7. Other End-user Industries
-
3. Geography
- 3.1. Saudi Arabia
- 3.2. United Arab Emirates
- 3.3. South Africa
- 3.4. Egypt
- 3.5. Kuwait
- 3.6. Qatar
- 3.7. Morocco
- 3.8. Rest of Middle-East and Africa
MEA Polyurethane Industry Segmentation By Geography
- 1. Saudi Arabia
- 2. United Arab Emirates
- 3. South Africa
- 4. Egypt
- 5. Kuwait
- 6. Qatar
- 7. Morocco
- 8. Rest of Middle East and Africa
MEA Polyurethane Industry Regional Market Share
Geographic Coverage of MEA Polyurethane Industry
MEA Polyurethane Industry REPORT HIGHLIGHTS
| Aspects | Details |
|---|---|
| Study Period | 2020-2034 |
| Base Year | 2025 |
| Estimated Year | 2026 |
| Forecast Period | 2026-2034 |
| Historical Period | 2020-2025 |
| Growth Rate | CAGR of 5.10% from 2020-2034 |
| Segmentation |
|
Table of Contents
- 1. Introduction
- 1.1. Research Scope
- 1.2. Market Segmentation
- 1.3. Research Objective
- 1.4. Definitions and Assumptions
- 2. Executive Summary
- 2.1. Market Snapshot
- 3. Market Dynamics
- 3.1. Market Drivers
- 3.2. Market Restrains
- 3.3. Market Trends
- 3.4. Market Opportunities
- 4. Market Factor Analysis
- 4.1. Porters Five Forces
- 4.1.1. Bargaining Power of Suppliers
- 4.1.2. Bargaining Power of Buyers
- 4.1.3. Threat of New Entrants
- 4.1.4. Threat of Substitutes
- 4.1.5. Competitive Rivalry
- 4.2. PESTEL analysis
- 4.3. BCG Analysis
- 4.3.1. Stars (High Growth, High Market Share)
- 4.3.2. Cash Cows (Low Growth, High Market Share)
- 4.3.3. Question Mark (High Growth, Low Market Share)
- 4.3.4. Dogs (Low Growth, Low Market Share)
- 4.4. Ansoff Matrix Analysis
- 4.5. Supply Chain Analysis
- 4.6. Regulatory Landscape
- 4.7. Current Market Potential and Opportunity Assessment (TAM–SAM–SOM Framework)
- 4.8. NRP Analyst Note
- 4.1. Porters Five Forces
- 5. Market Analysis, Insights and Forecast 2021-2033
- 5.1. Market Analysis, Insights and Forecast - by Application
- 5.1.1. Foams
- 5.1.1.1. Rigid Foam
- 5.1.1.2. Flexible Foam
- 5.1.2. Coatings
- 5.1.3. Adhesives and Sealants
- 5.1.4. Elastomers
- 5.1.5. Other Applications
- 5.1.1. Foams
- 5.2. Market Analysis, Insights and Forecast - by End-user Industry
- 5.2.1. Furniture and Interiors
- 5.2.2. Building and Construction
- 5.2.3. Electronics and Appliances
- 5.2.4. Automotive
- 5.2.5. Footwear
- 5.2.6. Packaging
- 5.2.7. Other End-user Industries
- 5.3. Market Analysis, Insights and Forecast - by Geography
- 5.3.1. Saudi Arabia
- 5.3.2. United Arab Emirates
- 5.3.3. South Africa
- 5.3.4. Egypt
- 5.3.5. Kuwait
- 5.3.6. Qatar
- 5.3.7. Morocco
- 5.3.8. Rest of Middle-East and Africa
- 5.4. Market Analysis, Insights and Forecast - by Region
- 5.4.1. Saudi Arabia
- 5.4.2. United Arab Emirates
- 5.4.3. South Africa
- 5.4.4. Egypt
- 5.4.5. Kuwait
- 5.4.6. Qatar
- 5.4.7. Morocco
- 5.4.8. Rest of Middle East and Africa
- 5.1. Market Analysis, Insights and Forecast - by Application
- 6. Global MEA Polyurethane Industry Analysis, Insights and Forecast, 2021-2033
- 6.1. Market Analysis, Insights and Forecast - by Application
- 6.1.1. Foams
- 6.1.1.1. Rigid Foam
- 6.1.1.2. Flexible Foam
- 6.1.2. Coatings
- 6.1.3. Adhesives and Sealants
- 6.1.4. Elastomers
- 6.1.5. Other Applications
- 6.1.1. Foams
- 6.2. Market Analysis, Insights and Forecast - by End-user Industry
- 6.2.1. Furniture and Interiors
- 6.2.2. Building and Construction
- 6.2.3. Electronics and Appliances
- 6.2.4. Automotive
- 6.2.5. Footwear
- 6.2.6. Packaging
- 6.2.7. Other End-user Industries
- 6.3. Market Analysis, Insights and Forecast - by Geography
- 6.3.1. Saudi Arabia
- 6.3.2. United Arab Emirates
- 6.3.3. South Africa
- 6.3.4. Egypt
- 6.3.5. Kuwait
- 6.3.6. Qatar
- 6.3.7. Morocco
- 6.3.8. Rest of Middle-East and Africa
- 6.1. Market Analysis, Insights and Forecast - by Application
- 7. Saudi Arabia MEA Polyurethane Industry Analysis, Insights and Forecast, 2020-2032
- 7.1. Market Analysis, Insights and Forecast - by Application
- 7.1.1. Foams
- 7.1.1.1. Rigid Foam
- 7.1.1.2. Flexible Foam
- 7.1.2. Coatings
- 7.1.3. Adhesives and Sealants
- 7.1.4. Elastomers
- 7.1.5. Other Applications
- 7.1.1. Foams
- 7.2. Market Analysis, Insights and Forecast - by End-user Industry
- 7.2.1. Furniture and Interiors
- 7.2.2. Building and Construction
- 7.2.3. Electronics and Appliances
- 7.2.4. Automotive
- 7.2.5. Footwear
- 7.2.6. Packaging
- 7.2.7. Other End-user Industries
- 7.3. Market Analysis, Insights and Forecast - by Geography
- 7.3.1. Saudi Arabia
- 7.3.2. United Arab Emirates
- 7.3.3. South Africa
- 7.3.4. Egypt
- 7.3.5. Kuwait
- 7.3.6. Qatar
- 7.3.7. Morocco
- 7.3.8. Rest of Middle-East and Africa
- 7.1. Market Analysis, Insights and Forecast - by Application
- 8. United Arab Emirates MEA Polyurethane Industry Analysis, Insights and Forecast, 2020-2032
- 8.1. Market Analysis, Insights and Forecast - by Application
- 8.1.1. Foams
- 8.1.1.1. Rigid Foam
- 8.1.1.2. Flexible Foam
- 8.1.2. Coatings
- 8.1.3. Adhesives and Sealants
- 8.1.4. Elastomers
- 8.1.5. Other Applications
- 8.1.1. Foams
- 8.2. Market Analysis, Insights and Forecast - by End-user Industry
- 8.2.1. Furniture and Interiors
- 8.2.2. Building and Construction
- 8.2.3. Electronics and Appliances
- 8.2.4. Automotive
- 8.2.5. Footwear
- 8.2.6. Packaging
- 8.2.7. Other End-user Industries
- 8.3. Market Analysis, Insights and Forecast - by Geography
- 8.3.1. Saudi Arabia
- 8.3.2. United Arab Emirates
- 8.3.3. South Africa
- 8.3.4. Egypt
- 8.3.5. Kuwait
- 8.3.6. Qatar
- 8.3.7. Morocco
- 8.3.8. Rest of Middle-East and Africa
- 8.1. Market Analysis, Insights and Forecast - by Application
- 9. South Africa MEA Polyurethane Industry Analysis, Insights and Forecast, 2020-2032
- 9.1. Market Analysis, Insights and Forecast - by Application
- 9.1.1. Foams
- 9.1.1.1. Rigid Foam
- 9.1.1.2. Flexible Foam
- 9.1.2. Coatings
- 9.1.3. Adhesives and Sealants
- 9.1.4. Elastomers
- 9.1.5. Other Applications
- 9.1.1. Foams
- 9.2. Market Analysis, Insights and Forecast - by End-user Industry
- 9.2.1. Furniture and Interiors
- 9.2.2. Building and Construction
- 9.2.3. Electronics and Appliances
- 9.2.4. Automotive
- 9.2.5. Footwear
- 9.2.6. Packaging
- 9.2.7. Other End-user Industries
- 9.3. Market Analysis, Insights and Forecast - by Geography
- 9.3.1. Saudi Arabia
- 9.3.2. United Arab Emirates
- 9.3.3. South Africa
- 9.3.4. Egypt
- 9.3.5. Kuwait
- 9.3.6. Qatar
- 9.3.7. Morocco
- 9.3.8. Rest of Middle-East and Africa
- 9.1. Market Analysis, Insights and Forecast - by Application
- 10. Egypt MEA Polyurethane Industry Analysis, Insights and Forecast, 2020-2032
- 10.1. Market Analysis, Insights and Forecast - by Application
- 10.1.1. Foams
- 10.1.1.1. Rigid Foam
- 10.1.1.2. Flexible Foam
- 10.1.2. Coatings
- 10.1.3. Adhesives and Sealants
- 10.1.4. Elastomers
- 10.1.5. Other Applications
- 10.1.1. Foams
- 10.2. Market Analysis, Insights and Forecast - by End-user Industry
- 10.2.1. Furniture and Interiors
- 10.2.2. Building and Construction
- 10.2.3. Electronics and Appliances
- 10.2.4. Automotive
- 10.2.5. Footwear
- 10.2.6. Packaging
- 10.2.7. Other End-user Industries
- 10.3. Market Analysis, Insights and Forecast - by Geography
- 10.3.1. Saudi Arabia
- 10.3.2. United Arab Emirates
- 10.3.3. South Africa
- 10.3.4. Egypt
- 10.3.5. Kuwait
- 10.3.6. Qatar
- 10.3.7. Morocco
- 10.3.8. Rest of Middle-East and Africa
- 10.1. Market Analysis, Insights and Forecast - by Application
- 11. Kuwait MEA Polyurethane Industry Analysis, Insights and Forecast, 2020-2032
- 11.1. Market Analysis, Insights and Forecast - by Application
- 11.1.1. Foams
- 11.1.1.1. Rigid Foam
- 11.1.1.2. Flexible Foam
- 11.1.2. Coatings
- 11.1.3. Adhesives and Sealants
- 11.1.4. Elastomers
- 11.1.5. Other Applications
- 11.1.1. Foams
- 11.2. Market Analysis, Insights and Forecast - by End-user Industry
- 11.2.1. Furniture and Interiors
- 11.2.2. Building and Construction
- 11.2.3. Electronics and Appliances
- 11.2.4. Automotive
- 11.2.5. Footwear
- 11.2.6. Packaging
- 11.2.7. Other End-user Industries
- 11.3. Market Analysis, Insights and Forecast - by Geography
- 11.3.1. Saudi Arabia
- 11.3.2. United Arab Emirates
- 11.3.3. South Africa
- 11.3.4. Egypt
- 11.3.5. Kuwait
- 11.3.6. Qatar
- 11.3.7. Morocco
- 11.3.8. Rest of Middle-East and Africa
- 11.1. Market Analysis, Insights and Forecast - by Application
- 12. Qatar MEA Polyurethane Industry Analysis, Insights and Forecast, 2020-2032
- 12.1. Market Analysis, Insights and Forecast - by Application
- 12.1.1. Foams
- 12.1.1.1. Rigid Foam
- 12.1.1.2. Flexible Foam
- 12.1.2. Coatings
- 12.1.3. Adhesives and Sealants
- 12.1.4. Elastomers
- 12.1.5. Other Applications
- 12.1.1. Foams
- 12.2. Market Analysis, Insights and Forecast - by End-user Industry
- 12.2.1. Furniture and Interiors
- 12.2.2. Building and Construction
- 12.2.3. Electronics and Appliances
- 12.2.4. Automotive
- 12.2.5. Footwear
- 12.2.6. Packaging
- 12.2.7. Other End-user Industries
- 12.3. Market Analysis, Insights and Forecast - by Geography
- 12.3.1. Saudi Arabia
- 12.3.2. United Arab Emirates
- 12.3.3. South Africa
- 12.3.4. Egypt
- 12.3.5. Kuwait
- 12.3.6. Qatar
- 12.3.7. Morocco
- 12.3.8. Rest of Middle-East and Africa
- 12.1. Market Analysis, Insights and Forecast - by Application
- 13. Morocco MEA Polyurethane Industry Analysis, Insights and Forecast, 2020-2032
- 13.1. Market Analysis, Insights and Forecast - by Application
- 13.1.1. Foams
- 13.1.1.1. Rigid Foam
- 13.1.1.2. Flexible Foam
- 13.1.2. Coatings
- 13.1.3. Adhesives and Sealants
- 13.1.4. Elastomers
- 13.1.5. Other Applications
- 13.1.1. Foams
- 13.2. Market Analysis, Insights and Forecast - by End-user Industry
- 13.2.1. Furniture and Interiors
- 13.2.2. Building and Construction
- 13.2.3. Electronics and Appliances
- 13.2.4. Automotive
- 13.2.5. Footwear
- 13.2.6. Packaging
- 13.2.7. Other End-user Industries
- 13.3. Market Analysis, Insights and Forecast - by Geography
- 13.3.1. Saudi Arabia
- 13.3.2. United Arab Emirates
- 13.3.3. South Africa
- 13.3.4. Egypt
- 13.3.5. Kuwait
- 13.3.6. Qatar
- 13.3.7. Morocco
- 13.3.8. Rest of Middle-East and Africa
- 13.1. Market Analysis, Insights and Forecast - by Application
- 14. Rest of Middle East and Africa MEA Polyurethane Industry Analysis, Insights and Forecast, 2020-2032
- 14.1. Market Analysis, Insights and Forecast - by Application
- 14.1.1. Foams
- 14.1.1.1. Rigid Foam
- 14.1.1.2. Flexible Foam
- 14.1.2. Coatings
- 14.1.3. Adhesives and Sealants
- 14.1.4. Elastomers
- 14.1.5. Other Applications
- 14.1.1. Foams
- 14.2. Market Analysis, Insights and Forecast - by End-user Industry
- 14.2.1. Furniture and Interiors
- 14.2.2. Building and Construction
- 14.2.3. Electronics and Appliances
- 14.2.4. Automotive
- 14.2.5. Footwear
- 14.2.6. Packaging
- 14.2.7. Other End-user Industries
- 14.3. Market Analysis, Insights and Forecast - by Geography
- 14.3.1. Saudi Arabia
- 14.3.2. United Arab Emirates
- 14.3.3. South Africa
- 14.3.4. Egypt
- 14.3.5. Kuwait
- 14.3.6. Qatar
- 14.3.7. Morocco
- 14.3.8. Rest of Middle-East and Africa
- 14.1. Market Analysis, Insights and Forecast - by Application
- 15. Competitive Analysis
- 15.1. Company Profiles
- 15.1.1 Wanhua Chemical Group Co Ltd*List Not Exhaustive
- 15.1.1.1. Company Overview
- 15.1.1.2. Products
- 15.1.1.3. Company Financials
- 15.1.1.4. SWOT Analysis
- 15.1.2 Mitsui Chemicals Inc
- 15.1.2.1. Company Overview
- 15.1.2.2. Products
- 15.1.2.3. Company Financials
- 15.1.2.4. SWOT Analysis
- 15.1.3 BCI Holding SA
- 15.1.3.1. Company Overview
- 15.1.3.2. Products
- 15.1.3.3. Company Financials
- 15.1.3.4. SWOT Analysis
- 15.1.4 LANXESS
- 15.1.4.1. Company Overview
- 15.1.4.2. Products
- 15.1.4.3. Company Financials
- 15.1.4.4. SWOT Analysis
- 15.1.5 BASF SE
- 15.1.5.1. Company Overview
- 15.1.5.2. Products
- 15.1.5.3. Company Financials
- 15.1.5.4. SWOT Analysis
- 15.1.6 Huntsman International LLC
- 15.1.6.1. Company Overview
- 15.1.6.2. Products
- 15.1.6.3. Company Financials
- 15.1.6.4. SWOT Analysis
- 15.1.7 Kuwait Polyurethane Industries W L L
- 15.1.7.1. Company Overview
- 15.1.7.2. Products
- 15.1.7.3. Company Financials
- 15.1.7.4. SWOT Analysis
- 15.1.8 Dow
- 15.1.8.1. Company Overview
- 15.1.8.2. Products
- 15.1.8.3. Company Financials
- 15.1.8.4. SWOT Analysis
- 15.1.9 Covestro AG
- 15.1.9.1. Company Overview
- 15.1.9.2. Products
- 15.1.9.3. Company Financials
- 15.1.9.4. SWOT Analysis
- 15.1.10 Perfect Rubber
- 15.1.10.1. Company Overview
- 15.1.10.2. Products
- 15.1.10.3. Company Financials
- 15.1.10.4. SWOT Analysis
- 15.1.1 Wanhua Chemical Group Co Ltd*List Not Exhaustive
- 15.2. Market Entropy
- 15.2.1 Company's Key Areas Served
- 15.2.2 Recent Developments
- 15.3. Company Market Share Analysis 2025
- 15.3.1 Top 5 Companies Market Share Analysis
- 15.3.2 Top 3 Companies Market Share Analysis
- 15.4. List of Potential Customers
- 16. Research Methodology
List of Figures
- Figure 1: Global MEA Polyurethane Industry Revenue Breakdown (Million, %) by Region 2025 & 2033
- Figure 2: Saudi Arabia MEA Polyurethane Industry Revenue (Million), by Application 2025 & 2033
- Figure 3: Saudi Arabia MEA Polyurethane Industry Revenue Share (%), by Application 2025 & 2033
- Figure 4: Saudi Arabia MEA Polyurethane Industry Revenue (Million), by End-user Industry 2025 & 2033
- Figure 5: Saudi Arabia MEA Polyurethane Industry Revenue Share (%), by End-user Industry 2025 & 2033
- Figure 6: Saudi Arabia MEA Polyurethane Industry Revenue (Million), by Geography 2025 & 2033
- Figure 7: Saudi Arabia MEA Polyurethane Industry Revenue Share (%), by Geography 2025 & 2033
- Figure 8: Saudi Arabia MEA Polyurethane Industry Revenue (Million), by Country 2025 & 2033
- Figure 9: Saudi Arabia MEA Polyurethane Industry Revenue Share (%), by Country 2025 & 2033
- Figure 10: United Arab Emirates MEA Polyurethane Industry Revenue (Million), by Application 2025 & 2033
- Figure 11: United Arab Emirates MEA Polyurethane Industry Revenue Share (%), by Application 2025 & 2033
- Figure 12: United Arab Emirates MEA Polyurethane Industry Revenue (Million), by End-user Industry 2025 & 2033
- Figure 13: United Arab Emirates MEA Polyurethane Industry Revenue Share (%), by End-user Industry 2025 & 2033
- Figure 14: United Arab Emirates MEA Polyurethane Industry Revenue (Million), by Geography 2025 & 2033
- Figure 15: United Arab Emirates MEA Polyurethane Industry Revenue Share (%), by Geography 2025 & 2033
- Figure 16: United Arab Emirates MEA Polyurethane Industry Revenue (Million), by Country 2025 & 2033
- Figure 17: United Arab Emirates MEA Polyurethane Industry Revenue Share (%), by Country 2025 & 2033
- Figure 18: South Africa MEA Polyurethane Industry Revenue (Million), by Application 2025 & 2033
- Figure 19: South Africa MEA Polyurethane Industry Revenue Share (%), by Application 2025 & 2033
- Figure 20: South Africa MEA Polyurethane Industry Revenue (Million), by End-user Industry 2025 & 2033
- Figure 21: South Africa MEA Polyurethane Industry Revenue Share (%), by End-user Industry 2025 & 2033
- Figure 22: South Africa MEA Polyurethane Industry Revenue (Million), by Geography 2025 & 2033
- Figure 23: South Africa MEA Polyurethane Industry Revenue Share (%), by Geography 2025 & 2033
- Figure 24: South Africa MEA Polyurethane Industry Revenue (Million), by Country 2025 & 2033
- Figure 25: South Africa MEA Polyurethane Industry Revenue Share (%), by Country 2025 & 2033
- Figure 26: Egypt MEA Polyurethane Industry Revenue (Million), by Application 2025 & 2033
- Figure 27: Egypt MEA Polyurethane Industry Revenue Share (%), by Application 2025 & 2033
- Figure 28: Egypt MEA Polyurethane Industry Revenue (Million), by End-user Industry 2025 & 2033
- Figure 29: Egypt MEA Polyurethane Industry Revenue Share (%), by End-user Industry 2025 & 2033
- Figure 30: Egypt MEA Polyurethane Industry Revenue (Million), by Geography 2025 & 2033
- Figure 31: Egypt MEA Polyurethane Industry Revenue Share (%), by Geography 2025 & 2033
- Figure 32: Egypt MEA Polyurethane Industry Revenue (Million), by Country 2025 & 2033
- Figure 33: Egypt MEA Polyurethane Industry Revenue Share (%), by Country 2025 & 2033
- Figure 34: Kuwait MEA Polyurethane Industry Revenue (Million), by Application 2025 & 2033
- Figure 35: Kuwait MEA Polyurethane Industry Revenue Share (%), by Application 2025 & 2033
- Figure 36: Kuwait MEA Polyurethane Industry Revenue (Million), by End-user Industry 2025 & 2033
- Figure 37: Kuwait MEA Polyurethane Industry Revenue Share (%), by End-user Industry 2025 & 2033
- Figure 38: Kuwait MEA Polyurethane Industry Revenue (Million), by Geography 2025 & 2033
- Figure 39: Kuwait MEA Polyurethane Industry Revenue Share (%), by Geography 2025 & 2033
- Figure 40: Kuwait MEA Polyurethane Industry Revenue (Million), by Country 2025 & 2033
- Figure 41: Kuwait MEA Polyurethane Industry Revenue Share (%), by Country 2025 & 2033
- Figure 42: Qatar MEA Polyurethane Industry Revenue (Million), by Application 2025 & 2033
- Figure 43: Qatar MEA Polyurethane Industry Revenue Share (%), by Application 2025 & 2033
- Figure 44: Qatar MEA Polyurethane Industry Revenue (Million), by End-user Industry 2025 & 2033
- Figure 45: Qatar MEA Polyurethane Industry Revenue Share (%), by End-user Industry 2025 & 2033
- Figure 46: Qatar MEA Polyurethane Industry Revenue (Million), by Geography 2025 & 2033
- Figure 47: Qatar MEA Polyurethane Industry Revenue Share (%), by Geography 2025 & 2033
- Figure 48: Qatar MEA Polyurethane Industry Revenue (Million), by Country 2025 & 2033
- Figure 49: Qatar MEA Polyurethane Industry Revenue Share (%), by Country 2025 & 2033
- Figure 50: Morocco MEA Polyurethane Industry Revenue (Million), by Application 2025 & 2033
- Figure 51: Morocco MEA Polyurethane Industry Revenue Share (%), by Application 2025 & 2033
- Figure 52: Morocco MEA Polyurethane Industry Revenue (Million), by End-user Industry 2025 & 2033
- Figure 53: Morocco MEA Polyurethane Industry Revenue Share (%), by End-user Industry 2025 & 2033
- Figure 54: Morocco MEA Polyurethane Industry Revenue (Million), by Geography 2025 & 2033
- Figure 55: Morocco MEA Polyurethane Industry Revenue Share (%), by Geography 2025 & 2033
- Figure 56: Morocco MEA Polyurethane Industry Revenue (Million), by Country 2025 & 2033
- Figure 57: Morocco MEA Polyurethane Industry Revenue Share (%), by Country 2025 & 2033
- Figure 58: Rest of Middle East and Africa MEA Polyurethane Industry Revenue (Million), by Application 2025 & 2033
- Figure 59: Rest of Middle East and Africa MEA Polyurethane Industry Revenue Share (%), by Application 2025 & 2033
- Figure 60: Rest of Middle East and Africa MEA Polyurethane Industry Revenue (Million), by End-user Industry 2025 & 2033
- Figure 61: Rest of Middle East and Africa MEA Polyurethane Industry Revenue Share (%), by End-user Industry 2025 & 2033
- Figure 62: Rest of Middle East and Africa MEA Polyurethane Industry Revenue (Million), by Geography 2025 & 2033
- Figure 63: Rest of Middle East and Africa MEA Polyurethane Industry Revenue Share (%), by Geography 2025 & 2033
- Figure 64: Rest of Middle East and Africa MEA Polyurethane Industry Revenue (Million), by Country 2025 & 2033
- Figure 65: Rest of Middle East and Africa MEA Polyurethane Industry Revenue Share (%), by Country 2025 & 2033
List of Tables
- Table 1: Global MEA Polyurethane Industry Revenue Million Forecast, by Application 2020 & 2033
- Table 2: Global MEA Polyurethane Industry Revenue Million Forecast, by End-user Industry 2020 & 2033
- Table 3: Global MEA Polyurethane Industry Revenue Million Forecast, by Geography 2020 & 2033
- Table 4: Global MEA Polyurethane Industry Revenue Million Forecast, by Region 2020 & 2033
- Table 5: Global MEA Polyurethane Industry Revenue Million Forecast, by Application 2020 & 2033
- Table 6: Global MEA Polyurethane Industry Revenue Million Forecast, by End-user Industry 2020 & 2033
- Table 7: Global MEA Polyurethane Industry Revenue Million Forecast, by Geography 2020 & 2033
- Table 8: Global MEA Polyurethane Industry Revenue Million Forecast, by Country 2020 & 2033
- Table 9: Global MEA Polyurethane Industry Revenue Million Forecast, by Application 2020 & 2033
- Table 10: Global MEA Polyurethane Industry Revenue Million Forecast, by End-user Industry 2020 & 2033
- Table 11: Global MEA Polyurethane Industry Revenue Million Forecast, by Geography 2020 & 2033
- Table 12: Global MEA Polyurethane Industry Revenue Million Forecast, by Country 2020 & 2033
- Table 13: Global MEA Polyurethane Industry Revenue Million Forecast, by Application 2020 & 2033
- Table 14: Global MEA Polyurethane Industry Revenue Million Forecast, by End-user Industry 2020 & 2033
- Table 15: Global MEA Polyurethane Industry Revenue Million Forecast, by Geography 2020 & 2033
- Table 16: Global MEA Polyurethane Industry Revenue Million Forecast, by Country 2020 & 2033
- Table 17: Global MEA Polyurethane Industry Revenue Million Forecast, by Application 2020 & 2033
- Table 18: Global MEA Polyurethane Industry Revenue Million Forecast, by End-user Industry 2020 & 2033
- Table 19: Global MEA Polyurethane Industry Revenue Million Forecast, by Geography 2020 & 2033
- Table 20: Global MEA Polyurethane Industry Revenue Million Forecast, by Country 2020 & 2033
- Table 21: Global MEA Polyurethane Industry Revenue Million Forecast, by Application 2020 & 2033
- Table 22: Global MEA Polyurethane Industry Revenue Million Forecast, by End-user Industry 2020 & 2033
- Table 23: Global MEA Polyurethane Industry Revenue Million Forecast, by Geography 2020 & 2033
- Table 24: Global MEA Polyurethane Industry Revenue Million Forecast, by Country 2020 & 2033
- Table 25: Global MEA Polyurethane Industry Revenue Million Forecast, by Application 2020 & 2033
- Table 26: Global MEA Polyurethane Industry Revenue Million Forecast, by End-user Industry 2020 & 2033
- Table 27: Global MEA Polyurethane Industry Revenue Million Forecast, by Geography 2020 & 2033
- Table 28: Global MEA Polyurethane Industry Revenue Million Forecast, by Country 2020 & 2033
- Table 29: Global MEA Polyurethane Industry Revenue Million Forecast, by Application 2020 & 2033
- Table 30: Global MEA Polyurethane Industry Revenue Million Forecast, by End-user Industry 2020 & 2033
- Table 31: Global MEA Polyurethane Industry Revenue Million Forecast, by Geography 2020 & 2033
- Table 32: Global MEA Polyurethane Industry Revenue Million Forecast, by Country 2020 & 2033
- Table 33: Global MEA Polyurethane Industry Revenue Million Forecast, by Application 2020 & 2033
- Table 34: Global MEA Polyurethane Industry Revenue Million Forecast, by End-user Industry 2020 & 2033
- Table 35: Global MEA Polyurethane Industry Revenue Million Forecast, by Geography 2020 & 2033
- Table 36: Global MEA Polyurethane Industry Revenue Million Forecast, by Country 2020 & 2033
Frequently Asked Questions
1. What is the projected Compound Annual Growth Rate (CAGR) of the MEA Polyurethane Industry?
The projected CAGR is approximately 5.10%.
2. Which companies are prominent players in the MEA Polyurethane Industry?
Key companies in the market include Wanhua Chemical Group Co Ltd*List Not Exhaustive, Mitsui Chemicals Inc, BCI Holding SA, LANXESS, BASF SE, Huntsman International LLC, Kuwait Polyurethane Industries W L L, Dow, Covestro AG, Perfect Rubber.
3. What are the main segments of the MEA Polyurethane Industry?
The market segments include Application, End-user Industry, Geography.
4. Can you provide details about the market size?
The market size is estimated to be USD 2.55 Million as of 2022.
5. What are some drivers contributing to market growth?
Growing Requirement of Thermal Insulation from the Electronics and Appliances Industry; Rising Demand from the Building and Construction Industry; Other Drivers.
6. What are the notable trends driving market growth?
Increasing Demand from the Building and Construction Industry.
7. Are there any restraints impacting market growth?
Volatile Raw Material Prices; Toxic Nature of Polyurethane Coatings.
8. Can you provide examples of recent developments in the market?
February 2022: BASF SE and NEVEON collaborated on mattress recycling. BASF developed a wet chemical recycling process for used mattresses made of polyurethane, enabling the creation of new beds using alternative polyurethane materials.
9. What pricing options are available for accessing the report?
Pricing options include single-user, multi-user, and enterprise licenses priced at USD 4750, USD 5250, and USD 8750 respectively.
10. Is the market size provided in terms of value or volume?
The market size is provided in terms of value, measured in Million.
11. Are there any specific market keywords associated with the report?
Yes, the market keyword associated with the report is "MEA Polyurethane Industry," which aids in identifying and referencing the specific market segment covered.
12. How do I determine which pricing option suits my needs best?
The pricing options vary based on user requirements and access needs. Individual users may opt for single-user licenses, while businesses requiring broader access may choose multi-user or enterprise licenses for cost-effective access to the report.
13. Are there any additional resources or data provided in the MEA Polyurethane Industry report?
While the report offers comprehensive insights, it's advisable to review the specific contents or supplementary materials provided to ascertain if additional resources or data are available.
14. How can I stay updated on further developments or reports in the MEA Polyurethane Industry?
To stay informed about further developments, trends, and reports in the MEA Polyurethane Industry, consider subscribing to industry newsletters, following relevant companies and organizations, or regularly checking reputable industry news sources and publications.
Methodology
Step 1 - Identification of Relevant Samples Size from Population Database


Step 2 - Approaches for Defining Global Market Size (Value, Volume* & Price*)

Note*: In applicable scenarios
Step 3 - Data Sources
Primary Research
- Web Analytics
- Survey Reports
- Research Institute
- Latest Research Reports
- Opinion Leaders
Secondary Research
- Annual Reports
- White Paper
- Latest Press Release
- Industry Association
- Paid Database
- Investor Presentations

Step 4 - Data Triangulation
Involves using different sources of information in order to increase the validity of a study
These sources are likely to be stakeholders in a program - participants, other researchers, program staff, other community members, and so on.
Then we put all data in single framework & apply various statistical tools to find out the dynamic on the market.
During the analysis stage, feedback from the stakeholder groups would be compared to determine areas of agreement as well as areas of divergence