

Key Insights
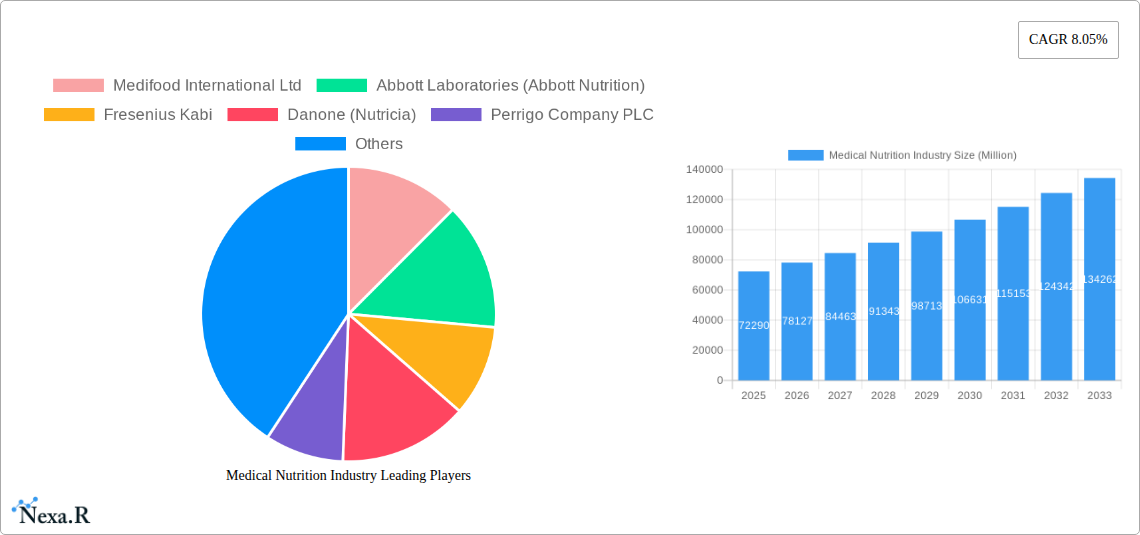
The global medical nutrition market, valued at $72.29 billion in 2025, is poised for substantial growth, exhibiting a compound annual growth rate (CAGR) of 8.05% from 2025 to 2033. This robust expansion is driven by several key factors. Rising prevalence of chronic diseases like diabetes, cancer, and gastrointestinal disorders necessitates specialized nutritional support, fueling market demand. An aging global population, with its increased susceptibility to malnutrition and age-related health issues, further contributes to market growth. Advancements in medical nutrition product formulations, offering improved palatability, efficacy, and convenience, are also significant drivers. The market is segmented by application (nutritional support for malnutrition, metabolic disorders, gastrointestinal diseases, cancer, neurological diseases, and other diseases), end-user (pediatric and adult), and route of administration (oral and enteral, parenteral). The strong presence of established players like Abbott Laboratories, Nestle Health Science, and Fresenius Kabi, coupled with the emergence of innovative companies, ensures a competitive and dynamic market landscape. Geographical distribution reveals significant market share across North America and Europe, reflecting high healthcare expenditure and awareness levels in these regions; however, Asia-Pacific is expected to witness the fastest growth due to rising disposable incomes and increasing healthcare investments.
The market's growth trajectory is influenced by several trends. A growing preference for personalized nutrition solutions tailored to individual patient needs is gaining momentum. Technological advancements in manufacturing and delivery systems, including the development of innovative product formats and improved packaging, are enhancing product appeal and efficacy. Furthermore, increasing emphasis on preventative healthcare and the adoption of integrated care models are fostering the integration of medical nutrition into broader healthcare strategies. However, market growth faces certain restraints, such as high product costs, stringent regulatory approvals, and potential reimbursement challenges in certain healthcare systems. Despite these challenges, the long-term outlook for the medical nutrition market remains positive, driven by the escalating global health burden and the continual development of innovative nutritional therapies.
This comprehensive report provides a detailed analysis of the Medical Nutrition Industry, encompassing market dynamics, growth trends, regional insights, product landscapes, and key players. With a study period spanning 2019-2033, a base year of 2025, and a forecast period of 2025-2033, this report offers invaluable insights for industry professionals, investors, and strategists. The report covers parent markets like nutritional supplements and child markets focusing on specific medical nutrition applications. Market values are presented in million units.
Medical Nutrition Industry Market Dynamics & Structure
The global medical nutrition market, valued at $xx million in 2024, is characterized by moderate concentration, with several key players holding significant market share. Technological innovation, particularly in personalized nutrition and advanced delivery systems, is a crucial growth driver. Stringent regulatory frameworks, varying across regions, influence product approvals and market access. Competitive pressures stem from both established players and emerging companies offering innovative solutions. The market also faces challenges from generic substitutes and cost-constraints. M&A activity in the sector has been relatively steady, with xx deals recorded between 2019 and 2024, primarily focused on expanding product portfolios and geographical reach.
- Market Concentration: Moderately concentrated, with top 5 players holding approximately xx% market share in 2024.
- Technological Innovation: Focus on personalized nutrition, advanced delivery systems (e.g., targeted drug delivery), and improved product efficacy.
- Regulatory Frameworks: Vary significantly across regions, impacting product approvals and market entry.
- Competitive Landscape: Intense competition among established players and emerging companies.
- M&A Activity: Consistent M&A activity, driven by portfolio expansion and market share gains. Average deal size: $xx million.
Medical Nutrition Industry Growth Trends & Insights
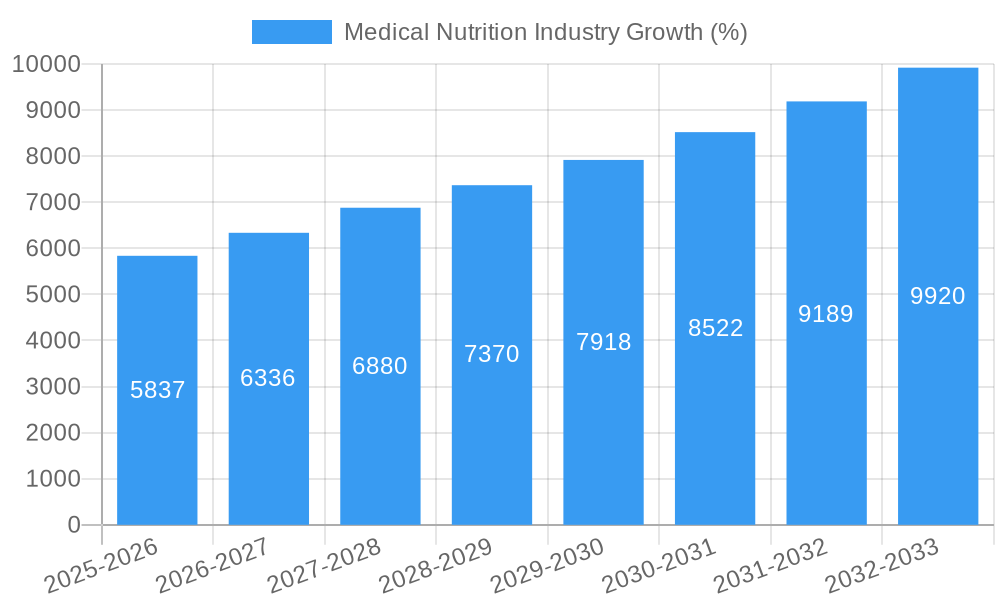
The medical nutrition market exhibits a steady growth trajectory, driven by rising prevalence of chronic diseases, aging population, and increasing healthcare expenditure. The market size is projected to reach $xx million by 2033, exhibiting a CAGR of xx% during the forecast period. Adoption rates are highest in developed regions, but growth is significant in emerging markets due to rising awareness and improved healthcare infrastructure. Technological disruptions, such as personalized nutrition solutions and telemedicine integration, are accelerating market expansion. Consumer behavior is shifting towards greater preference for convenient, palatable, and effective medical nutrition products.
- Market Size (2024): $xx million
- Market Size (2033): $xx million
- CAGR (2025-2033): xx%
- Market Penetration (2024): xx% in developed regions, xx% in emerging regions.
Dominant Regions, Countries, or Segments in Medical Nutrition Industry
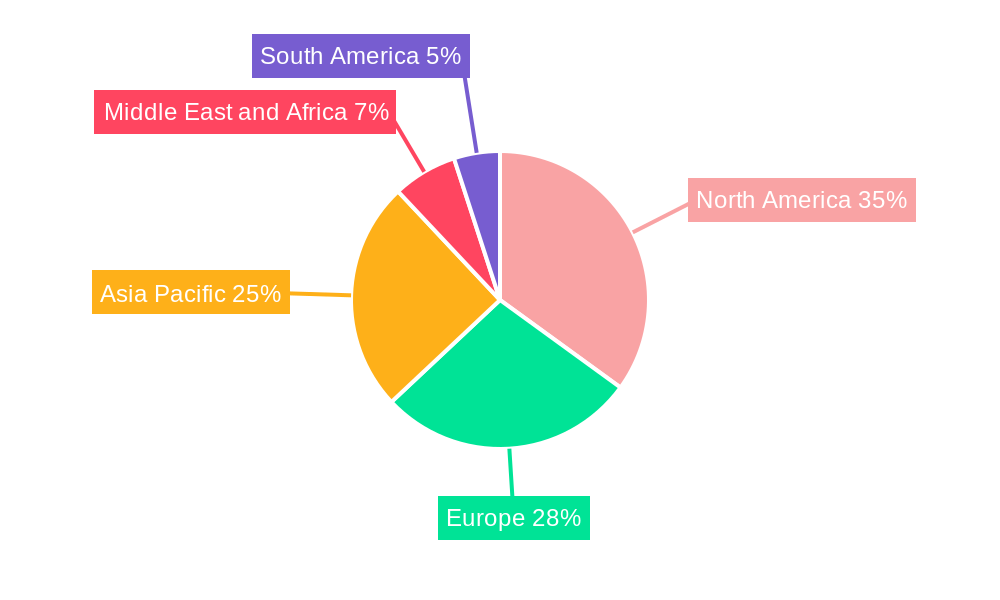
North America currently holds the largest market share in the medical nutrition industry, driven by high healthcare expenditure, advanced healthcare infrastructure, and a high prevalence of chronic diseases. Within applications, Nutritional Support for Malnutrition and Nutritional Support for Metabolic Disorders represent the largest segments, followed by Gastrointestinal diseases. The adult segment dominates the end-user market. Oral and Enteral routes of administration hold the largest market share, but Parenteral administration is experiencing rapid growth.
- Leading Region: North America
- Leading Application: Nutritional Support for Malnutrition
- Leading End-User: Adult
- Leading Route of Administration: Oral and Enteral
- Key Growth Drivers: High prevalence of chronic diseases, aging population, increasing healthcare spending, technological advancements.
Medical Nutrition Industry Product Landscape
The medical nutrition product landscape is characterized by a diverse range of products, including specialized formulas for various medical conditions, oral nutritional supplements, enteral and parenteral nutrition solutions, and disease-specific products. Recent innovations focus on improved palatability, enhanced nutrient bioavailability, personalized formulations based on genetic information, and convenient delivery systems. Key selling propositions include efficacy, safety, and convenience.
Key Drivers, Barriers & Challenges in Medical Nutrition Industry
Key Drivers:
- Rising prevalence of chronic diseases (diabetes, cancer, etc.)
- Aging global population
- Increased healthcare spending and insurance coverage
- Technological advancements in product formulation and delivery
- Growing awareness of nutritional needs in healthcare settings
Key Challenges:
- Stringent regulatory requirements and lengthy approval processes
- High cost of specialized medical nutrition products
- Supply chain disruptions due to global events
- Competition from generic and over-the-counter products
- Ensuring patient adherence and compliance with prescribed regimens
Emerging Opportunities in Medical Nutrition Industry
- Personalized nutrition solutions based on genomics and metabolomics
- Development of products addressing unmet needs in specific disease areas
- Expansion into emerging markets with growing healthcare awareness
- Development of innovative delivery systems (e.g., wearable technology)
- Integration of digital health technologies for monitoring and management
Growth Accelerators in the Medical Nutrition Industry
Long-term growth will be accelerated by strategic partnerships to expand market reach, technological breakthroughs improving product efficacy and personalization, and expansion into emerging markets with increasing disposable incomes and healthcare spending. Furthermore, a focus on developing sustainable and ethically sourced ingredients will drive market growth and consumer confidence.
Key Players Shaping the Medical Nutrition Industry Market
- Medifood International Ltd
- Abbott Laboratories (Abbott Nutrition)
- Fresenius Kabi
- Danone (Nutricia)
- Perrigo Company PLC
- Nestle Health Science
- Ajinomoto Cambrooke Inc (Nualtra Ltd)
- AYMES International Ltd
- Baxter Healthcare
- B Braun SE
- Reckitt Benckiser
Notable Milestones in Medical Nutrition Industry Sector
- April 2022: Glanbia Nutritionals launched TechVantage, a functionally optimized nutrient technology platform.
- October 2022: Hologram Sciences and Maeil Health Nutrition partnered to deliver personalized nutrition solutions to the Korean market.
In-Depth Medical Nutrition Industry Market Outlook
The medical nutrition market holds significant future potential, driven by continued technological advancements, expansion into untapped markets, and rising healthcare expenditure. Strategic partnerships and a focus on personalized nutrition will be crucial for success. The market is poised for continued growth, with opportunities for innovation and market expansion across various regions and applications.
Medical Nutrition Industry Segmentation
-
1. Route of Administration
- 1.1. Oral and Enteral
- 1.2. Parenteral
-
2. Application
- 2.1. Nutritional Support for Malnutrition
- 2.2. Nutritional Support for Metabolic Disorders
- 2.3. Nutritional Support for Gastrointestinal Diseases
- 2.4. Nutritional Support for Cancer
- 2.5. Nutritional Support in Neurological Diseases
- 2.6. Nutritional Support in Other Diseases
-
3. End User
- 3.1. Pediatric
- 3.2. Adult
Medical Nutrition Industry Segmentation By Geography
-
1. North America
- 1.1. United States
- 1.2. Canada
- 1.3. Mexico
-
2. Europe
- 2.1. Germany
- 2.2. United Kingdom
- 2.3. France
- 2.4. Italy
- 2.5. Spain
- 2.6. Rest of Europe
-
3. Asia Pacific
- 3.1. China
- 3.2. Japan
- 3.3. India
- 3.4. Australia
- 3.5. South Korea
- 3.6. Rest of Asia Pacific
-
4. Middle East and Africa
- 4.1. GCC
- 4.2. South Africa
- 4.3. Rest of Middle East and Africa
-
5. South America
- 5.1. Brazil
- 5.2. Argentina
- 5.3. Rest of South America
Medical Nutrition Industry REPORT HIGHLIGHTS
| Aspects | Details |
|---|---|
| Study Period | 2019-2033 |
| Base Year | 2024 |
| Estimated Year | 2025 |
| Forecast Period | 2025-2033 |
| Historical Period | 2019-2024 |
| Growth Rate | CAGR of 8.05% from 2019-2033 |
| Segmentation |
|
Table of Contents
- 1. Introduction
- 1.1. Research Scope
- 1.2. Market Segmentation
- 1.3. Research Methodology
- 1.4. Definitions and Assumptions
- 2. Executive Summary
- 2.1. Introduction
- 3. Market Dynamics
- 3.1. Introduction
- 3.2. Market Drivers
- 3.2.1. Increasing Prevalence of Metabolic Disorders; High Spending on Healthcare; Growing Geriatric Population
- 3.3. Market Restrains
- 3.3.1. Imprecise Perception About Clinical Nutrition; Reduction in Birth Rates
- 3.4. Market Trends
- 3.4.1. Oral and Enteral Segment is Expected to Hold a Significant Market Share Over the Forecast Period
- 4. Market Factor Analysis
- 4.1. Porters Five Forces
- 4.2. Supply/Value Chain
- 4.3. PESTEL analysis
- 4.4. Market Entropy
- 4.5. Patent/Trademark Analysis
- 5. Global Medical Nutrition Industry Analysis, Insights and Forecast, 2019-2031
- 5.1. Market Analysis, Insights and Forecast - by Route of Administration
- 5.1.1. Oral and Enteral
- 5.1.2. Parenteral
- 5.2. Market Analysis, Insights and Forecast - by Application
- 5.2.1. Nutritional Support for Malnutrition
- 5.2.2. Nutritional Support for Metabolic Disorders
- 5.2.3. Nutritional Support for Gastrointestinal Diseases
- 5.2.4. Nutritional Support for Cancer
- 5.2.5. Nutritional Support in Neurological Diseases
- 5.2.6. Nutritional Support in Other Diseases
- 5.3. Market Analysis, Insights and Forecast - by End User
- 5.3.1. Pediatric
- 5.3.2. Adult
- 5.4. Market Analysis, Insights and Forecast - by Region
- 5.4.1. North America
- 5.4.2. Europe
- 5.4.3. Asia Pacific
- 5.4.4. Middle East and Africa
- 5.4.5. South America
- 5.1. Market Analysis, Insights and Forecast - by Route of Administration
- 6. North America Medical Nutrition Industry Analysis, Insights and Forecast, 2019-2031
- 6.1. Market Analysis, Insights and Forecast - by Route of Administration
- 6.1.1. Oral and Enteral
- 6.1.2. Parenteral
- 6.2. Market Analysis, Insights and Forecast - by Application
- 6.2.1. Nutritional Support for Malnutrition
- 6.2.2. Nutritional Support for Metabolic Disorders
- 6.2.3. Nutritional Support for Gastrointestinal Diseases
- 6.2.4. Nutritional Support for Cancer
- 6.2.5. Nutritional Support in Neurological Diseases
- 6.2.6. Nutritional Support in Other Diseases
- 6.3. Market Analysis, Insights and Forecast - by End User
- 6.3.1. Pediatric
- 6.3.2. Adult
- 6.1. Market Analysis, Insights and Forecast - by Route of Administration
- 7. Europe Medical Nutrition Industry Analysis, Insights and Forecast, 2019-2031
- 7.1. Market Analysis, Insights and Forecast - by Route of Administration
- 7.1.1. Oral and Enteral
- 7.1.2. Parenteral
- 7.2. Market Analysis, Insights and Forecast - by Application
- 7.2.1. Nutritional Support for Malnutrition
- 7.2.2. Nutritional Support for Metabolic Disorders
- 7.2.3. Nutritional Support for Gastrointestinal Diseases
- 7.2.4. Nutritional Support for Cancer
- 7.2.5. Nutritional Support in Neurological Diseases
- 7.2.6. Nutritional Support in Other Diseases
- 7.3. Market Analysis, Insights and Forecast - by End User
- 7.3.1. Pediatric
- 7.3.2. Adult
- 7.1. Market Analysis, Insights and Forecast - by Route of Administration
- 8. Asia Pacific Medical Nutrition Industry Analysis, Insights and Forecast, 2019-2031
- 8.1. Market Analysis, Insights and Forecast - by Route of Administration
- 8.1.1. Oral and Enteral
- 8.1.2. Parenteral
- 8.2. Market Analysis, Insights and Forecast - by Application
- 8.2.1. Nutritional Support for Malnutrition
- 8.2.2. Nutritional Support for Metabolic Disorders
- 8.2.3. Nutritional Support for Gastrointestinal Diseases
- 8.2.4. Nutritional Support for Cancer
- 8.2.5. Nutritional Support in Neurological Diseases
- 8.2.6. Nutritional Support in Other Diseases
- 8.3. Market Analysis, Insights and Forecast - by End User
- 8.3.1. Pediatric
- 8.3.2. Adult
- 8.1. Market Analysis, Insights and Forecast - by Route of Administration
- 9. Middle East and Africa Medical Nutrition Industry Analysis, Insights and Forecast, 2019-2031
- 9.1. Market Analysis, Insights and Forecast - by Route of Administration
- 9.1.1. Oral and Enteral
- 9.1.2. Parenteral
- 9.2. Market Analysis, Insights and Forecast - by Application
- 9.2.1. Nutritional Support for Malnutrition
- 9.2.2. Nutritional Support for Metabolic Disorders
- 9.2.3. Nutritional Support for Gastrointestinal Diseases
- 9.2.4. Nutritional Support for Cancer
- 9.2.5. Nutritional Support in Neurological Diseases
- 9.2.6. Nutritional Support in Other Diseases
- 9.3. Market Analysis, Insights and Forecast - by End User
- 9.3.1. Pediatric
- 9.3.2. Adult
- 9.1. Market Analysis, Insights and Forecast - by Route of Administration
- 10. South America Medical Nutrition Industry Analysis, Insights and Forecast, 2019-2031
- 10.1. Market Analysis, Insights and Forecast - by Route of Administration
- 10.1.1. Oral and Enteral
- 10.1.2. Parenteral
- 10.2. Market Analysis, Insights and Forecast - by Application
- 10.2.1. Nutritional Support for Malnutrition
- 10.2.2. Nutritional Support for Metabolic Disorders
- 10.2.3. Nutritional Support for Gastrointestinal Diseases
- 10.2.4. Nutritional Support for Cancer
- 10.2.5. Nutritional Support in Neurological Diseases
- 10.2.6. Nutritional Support in Other Diseases
- 10.3. Market Analysis, Insights and Forecast - by End User
- 10.3.1. Pediatric
- 10.3.2. Adult
- 10.1. Market Analysis, Insights and Forecast - by Route of Administration
- 11. North America Medical Nutrition Industry Analysis, Insights and Forecast, 2019-2031
- 11.1. Market Analysis, Insights and Forecast - By Country/Sub-region
- 11.1.1. undefined
- 12. Europe Medical Nutrition Industry Analysis, Insights and Forecast, 2019-2031
- 12.1. Market Analysis, Insights and Forecast - By Country/Sub-region
- 12.1.1. undefined
- 13. Asia Pacific Medical Nutrition Industry Analysis, Insights and Forecast, 2019-2031
- 13.1. Market Analysis, Insights and Forecast - By Country/Sub-region
- 13.1.1. undefined
- 14. Middle East and Africa Medical Nutrition Industry Analysis, Insights and Forecast, 2019-2031
- 14.1. Market Analysis, Insights and Forecast - By Country/Sub-region
- 14.1.1. undefined
- 15. South America Medical Nutrition Industry Analysis, Insights and Forecast, 2019-2031
- 15.1. Market Analysis, Insights and Forecast - By Country/Sub-region
- 15.1.1. undefined
- 16. Competitive Analysis
- 16.1. Global Market Share Analysis 2024
- 16.2. Company Profiles
- 16.2.1 Medifood International Ltd
- 16.2.1.1. Overview
- 16.2.1.2. Products
- 16.2.1.3. SWOT Analysis
- 16.2.1.4. Recent Developments
- 16.2.1.5. Financials (Based on Availability)
- 16.2.2 Abbott Laboratories (Abbott Nutrition)
- 16.2.2.1. Overview
- 16.2.2.2. Products
- 16.2.2.3. SWOT Analysis
- 16.2.2.4. Recent Developments
- 16.2.2.5. Financials (Based on Availability)
- 16.2.3 Fresenius Kabi
- 16.2.3.1. Overview
- 16.2.3.2. Products
- 16.2.3.3. SWOT Analysis
- 16.2.3.4. Recent Developments
- 16.2.3.5. Financials (Based on Availability)
- 16.2.4 Danone (Nutricia)
- 16.2.4.1. Overview
- 16.2.4.2. Products
- 16.2.4.3. SWOT Analysis
- 16.2.4.4. Recent Developments
- 16.2.4.5. Financials (Based on Availability)
- 16.2.5 Perrigo Company PLC
- 16.2.5.1. Overview
- 16.2.5.2. Products
- 16.2.5.3. SWOT Analysis
- 16.2.5.4. Recent Developments
- 16.2.5.5. Financials (Based on Availability)
- 16.2.6 Nestle Health Science
- 16.2.6.1. Overview
- 16.2.6.2. Products
- 16.2.6.3. SWOT Analysis
- 16.2.6.4. Recent Developments
- 16.2.6.5. Financials (Based on Availability)
- 16.2.7 Ajinomoto Cambrooke Inc (Nualtra Ltd)
- 16.2.7.1. Overview
- 16.2.7.2. Products
- 16.2.7.3. SWOT Analysis
- 16.2.7.4. Recent Developments
- 16.2.7.5. Financials (Based on Availability)
- 16.2.8 AYMES International Ltd
- 16.2.8.1. Overview
- 16.2.8.2. Products
- 16.2.8.3. SWOT Analysis
- 16.2.8.4. Recent Developments
- 16.2.8.5. Financials (Based on Availability)
- 16.2.9 Baxter Healthcare
- 16.2.9.1. Overview
- 16.2.9.2. Products
- 16.2.9.3. SWOT Analysis
- 16.2.9.4. Recent Developments
- 16.2.9.5. Financials (Based on Availability)
- 16.2.10 B Braun SE
- 16.2.10.1. Overview
- 16.2.10.2. Products
- 16.2.10.3. SWOT Analysis
- 16.2.10.4. Recent Developments
- 16.2.10.5. Financials (Based on Availability)
- 16.2.11 Reckitt Benckiser
- 16.2.11.1. Overview
- 16.2.11.2. Products
- 16.2.11.3. SWOT Analysis
- 16.2.11.4. Recent Developments
- 16.2.11.5. Financials (Based on Availability)
- 16.2.1 Medifood International Ltd
List of Figures
- Figure 1: Global Medical Nutrition Industry Revenue Breakdown (Million, %) by Region 2024 & 2032
- Figure 2: Global Medical Nutrition Industry Volume Breakdown (K Unit, %) by Region 2024 & 2032
- Figure 3: North America Medical Nutrition Industry Revenue (Million), by Country 2024 & 2032
- Figure 4: North America Medical Nutrition Industry Volume (K Unit), by Country 2024 & 2032
- Figure 5: North America Medical Nutrition Industry Revenue Share (%), by Country 2024 & 2032
- Figure 6: North America Medical Nutrition Industry Volume Share (%), by Country 2024 & 2032
- Figure 7: Europe Medical Nutrition Industry Revenue (Million), by Country 2024 & 2032
- Figure 8: Europe Medical Nutrition Industry Volume (K Unit), by Country 2024 & 2032
- Figure 9: Europe Medical Nutrition Industry Revenue Share (%), by Country 2024 & 2032
- Figure 10: Europe Medical Nutrition Industry Volume Share (%), by Country 2024 & 2032
- Figure 11: Asia Pacific Medical Nutrition Industry Revenue (Million), by Country 2024 & 2032
- Figure 12: Asia Pacific Medical Nutrition Industry Volume (K Unit), by Country 2024 & 2032
- Figure 13: Asia Pacific Medical Nutrition Industry Revenue Share (%), by Country 2024 & 2032
- Figure 14: Asia Pacific Medical Nutrition Industry Volume Share (%), by Country 2024 & 2032
- Figure 15: Middle East and Africa Medical Nutrition Industry Revenue (Million), by Country 2024 & 2032
- Figure 16: Middle East and Africa Medical Nutrition Industry Volume (K Unit), by Country 2024 & 2032
- Figure 17: Middle East and Africa Medical Nutrition Industry Revenue Share (%), by Country 2024 & 2032
- Figure 18: Middle East and Africa Medical Nutrition Industry Volume Share (%), by Country 2024 & 2032
- Figure 19: South America Medical Nutrition Industry Revenue (Million), by Country 2024 & 2032
- Figure 20: South America Medical Nutrition Industry Volume (K Unit), by Country 2024 & 2032
- Figure 21: South America Medical Nutrition Industry Revenue Share (%), by Country 2024 & 2032
- Figure 22: South America Medical Nutrition Industry Volume Share (%), by Country 2024 & 2032
- Figure 23: North America Medical Nutrition Industry Revenue (Million), by Route of Administration 2024 & 2032
- Figure 24: North America Medical Nutrition Industry Volume (K Unit), by Route of Administration 2024 & 2032
- Figure 25: North America Medical Nutrition Industry Revenue Share (%), by Route of Administration 2024 & 2032
- Figure 26: North America Medical Nutrition Industry Volume Share (%), by Route of Administration 2024 & 2032
- Figure 27: North America Medical Nutrition Industry Revenue (Million), by Application 2024 & 2032
- Figure 28: North America Medical Nutrition Industry Volume (K Unit), by Application 2024 & 2032
- Figure 29: North America Medical Nutrition Industry Revenue Share (%), by Application 2024 & 2032
- Figure 30: North America Medical Nutrition Industry Volume Share (%), by Application 2024 & 2032
- Figure 31: North America Medical Nutrition Industry Revenue (Million), by End User 2024 & 2032
- Figure 32: North America Medical Nutrition Industry Volume (K Unit), by End User 2024 & 2032
- Figure 33: North America Medical Nutrition Industry Revenue Share (%), by End User 2024 & 2032
- Figure 34: North America Medical Nutrition Industry Volume Share (%), by End User 2024 & 2032
- Figure 35: North America Medical Nutrition Industry Revenue (Million), by Country 2024 & 2032
- Figure 36: North America Medical Nutrition Industry Volume (K Unit), by Country 2024 & 2032
- Figure 37: North America Medical Nutrition Industry Revenue Share (%), by Country 2024 & 2032
- Figure 38: North America Medical Nutrition Industry Volume Share (%), by Country 2024 & 2032
- Figure 39: Europe Medical Nutrition Industry Revenue (Million), by Route of Administration 2024 & 2032
- Figure 40: Europe Medical Nutrition Industry Volume (K Unit), by Route of Administration 2024 & 2032
- Figure 41: Europe Medical Nutrition Industry Revenue Share (%), by Route of Administration 2024 & 2032
- Figure 42: Europe Medical Nutrition Industry Volume Share (%), by Route of Administration 2024 & 2032
- Figure 43: Europe Medical Nutrition Industry Revenue (Million), by Application 2024 & 2032
- Figure 44: Europe Medical Nutrition Industry Volume (K Unit), by Application 2024 & 2032
- Figure 45: Europe Medical Nutrition Industry Revenue Share (%), by Application 2024 & 2032
- Figure 46: Europe Medical Nutrition Industry Volume Share (%), by Application 2024 & 2032
- Figure 47: Europe Medical Nutrition Industry Revenue (Million), by End User 2024 & 2032
- Figure 48: Europe Medical Nutrition Industry Volume (K Unit), by End User 2024 & 2032
- Figure 49: Europe Medical Nutrition Industry Revenue Share (%), by End User 2024 & 2032
- Figure 50: Europe Medical Nutrition Industry Volume Share (%), by End User 2024 & 2032
- Figure 51: Europe Medical Nutrition Industry Revenue (Million), by Country 2024 & 2032
- Figure 52: Europe Medical Nutrition Industry Volume (K Unit), by Country 2024 & 2032
- Figure 53: Europe Medical Nutrition Industry Revenue Share (%), by Country 2024 & 2032
- Figure 54: Europe Medical Nutrition Industry Volume Share (%), by Country 2024 & 2032
- Figure 55: Asia Pacific Medical Nutrition Industry Revenue (Million), by Route of Administration 2024 & 2032
- Figure 56: Asia Pacific Medical Nutrition Industry Volume (K Unit), by Route of Administration 2024 & 2032
- Figure 57: Asia Pacific Medical Nutrition Industry Revenue Share (%), by Route of Administration 2024 & 2032
- Figure 58: Asia Pacific Medical Nutrition Industry Volume Share (%), by Route of Administration 2024 & 2032
- Figure 59: Asia Pacific Medical Nutrition Industry Revenue (Million), by Application 2024 & 2032
- Figure 60: Asia Pacific Medical Nutrition Industry Volume (K Unit), by Application 2024 & 2032
- Figure 61: Asia Pacific Medical Nutrition Industry Revenue Share (%), by Application 2024 & 2032
- Figure 62: Asia Pacific Medical Nutrition Industry Volume Share (%), by Application 2024 & 2032
- Figure 63: Asia Pacific Medical Nutrition Industry Revenue (Million), by End User 2024 & 2032
- Figure 64: Asia Pacific Medical Nutrition Industry Volume (K Unit), by End User 2024 & 2032
- Figure 65: Asia Pacific Medical Nutrition Industry Revenue Share (%), by End User 2024 & 2032
- Figure 66: Asia Pacific Medical Nutrition Industry Volume Share (%), by End User 2024 & 2032
- Figure 67: Asia Pacific Medical Nutrition Industry Revenue (Million), by Country 2024 & 2032
- Figure 68: Asia Pacific Medical Nutrition Industry Volume (K Unit), by Country 2024 & 2032
- Figure 69: Asia Pacific Medical Nutrition Industry Revenue Share (%), by Country 2024 & 2032
- Figure 70: Asia Pacific Medical Nutrition Industry Volume Share (%), by Country 2024 & 2032
- Figure 71: Middle East and Africa Medical Nutrition Industry Revenue (Million), by Route of Administration 2024 & 2032
- Figure 72: Middle East and Africa Medical Nutrition Industry Volume (K Unit), by Route of Administration 2024 & 2032
- Figure 73: Middle East and Africa Medical Nutrition Industry Revenue Share (%), by Route of Administration 2024 & 2032
- Figure 74: Middle East and Africa Medical Nutrition Industry Volume Share (%), by Route of Administration 2024 & 2032
- Figure 75: Middle East and Africa Medical Nutrition Industry Revenue (Million), by Application 2024 & 2032
- Figure 76: Middle East and Africa Medical Nutrition Industry Volume (K Unit), by Application 2024 & 2032
- Figure 77: Middle East and Africa Medical Nutrition Industry Revenue Share (%), by Application 2024 & 2032
- Figure 78: Middle East and Africa Medical Nutrition Industry Volume Share (%), by Application 2024 & 2032
- Figure 79: Middle East and Africa Medical Nutrition Industry Revenue (Million), by End User 2024 & 2032
- Figure 80: Middle East and Africa Medical Nutrition Industry Volume (K Unit), by End User 2024 & 2032
- Figure 81: Middle East and Africa Medical Nutrition Industry Revenue Share (%), by End User 2024 & 2032
- Figure 82: Middle East and Africa Medical Nutrition Industry Volume Share (%), by End User 2024 & 2032
- Figure 83: Middle East and Africa Medical Nutrition Industry Revenue (Million), by Country 2024 & 2032
- Figure 84: Middle East and Africa Medical Nutrition Industry Volume (K Unit), by Country 2024 & 2032
- Figure 85: Middle East and Africa Medical Nutrition Industry Revenue Share (%), by Country 2024 & 2032
- Figure 86: Middle East and Africa Medical Nutrition Industry Volume Share (%), by Country 2024 & 2032
- Figure 87: South America Medical Nutrition Industry Revenue (Million), by Route of Administration 2024 & 2032
- Figure 88: South America Medical Nutrition Industry Volume (K Unit), by Route of Administration 2024 & 2032
- Figure 89: South America Medical Nutrition Industry Revenue Share (%), by Route of Administration 2024 & 2032
- Figure 90: South America Medical Nutrition Industry Volume Share (%), by Route of Administration 2024 & 2032
- Figure 91: South America Medical Nutrition Industry Revenue (Million), by Application 2024 & 2032
- Figure 92: South America Medical Nutrition Industry Volume (K Unit), by Application 2024 & 2032
- Figure 93: South America Medical Nutrition Industry Revenue Share (%), by Application 2024 & 2032
- Figure 94: South America Medical Nutrition Industry Volume Share (%), by Application 2024 & 2032
- Figure 95: South America Medical Nutrition Industry Revenue (Million), by End User 2024 & 2032
- Figure 96: South America Medical Nutrition Industry Volume (K Unit), by End User 2024 & 2032
- Figure 97: South America Medical Nutrition Industry Revenue Share (%), by End User 2024 & 2032
- Figure 98: South America Medical Nutrition Industry Volume Share (%), by End User 2024 & 2032
- Figure 99: South America Medical Nutrition Industry Revenue (Million), by Country 2024 & 2032
- Figure 100: South America Medical Nutrition Industry Volume (K Unit), by Country 2024 & 2032
- Figure 101: South America Medical Nutrition Industry Revenue Share (%), by Country 2024 & 2032
- Figure 102: South America Medical Nutrition Industry Volume Share (%), by Country 2024 & 2032
List of Tables
- Table 1: Global Medical Nutrition Industry Revenue Million Forecast, by Region 2019 & 2032
- Table 2: Global Medical Nutrition Industry Volume K Unit Forecast, by Region 2019 & 2032
- Table 3: Global Medical Nutrition Industry Revenue Million Forecast, by Route of Administration 2019 & 2032
- Table 4: Global Medical Nutrition Industry Volume K Unit Forecast, by Route of Administration 2019 & 2032
- Table 5: Global Medical Nutrition Industry Revenue Million Forecast, by Application 2019 & 2032
- Table 6: Global Medical Nutrition Industry Volume K Unit Forecast, by Application 2019 & 2032
- Table 7: Global Medical Nutrition Industry Revenue Million Forecast, by End User 2019 & 2032
- Table 8: Global Medical Nutrition Industry Volume K Unit Forecast, by End User 2019 & 2032
- Table 9: Global Medical Nutrition Industry Revenue Million Forecast, by Region 2019 & 2032
- Table 10: Global Medical Nutrition Industry Volume K Unit Forecast, by Region 2019 & 2032
- Table 11: Global Medical Nutrition Industry Revenue Million Forecast, by Country 2019 & 2032
- Table 12: Global Medical Nutrition Industry Volume K Unit Forecast, by Country 2019 & 2032
- Table 13: Global Medical Nutrition Industry Revenue Million Forecast, by Country 2019 & 2032
- Table 14: Global Medical Nutrition Industry Volume K Unit Forecast, by Country 2019 & 2032
- Table 15: Global Medical Nutrition Industry Revenue Million Forecast, by Country 2019 & 2032
- Table 16: Global Medical Nutrition Industry Volume K Unit Forecast, by Country 2019 & 2032
- Table 17: Global Medical Nutrition Industry Revenue Million Forecast, by Country 2019 & 2032
- Table 18: Global Medical Nutrition Industry Volume K Unit Forecast, by Country 2019 & 2032
- Table 19: Global Medical Nutrition Industry Revenue Million Forecast, by Country 2019 & 2032
- Table 20: Global Medical Nutrition Industry Volume K Unit Forecast, by Country 2019 & 2032
- Table 21: Global Medical Nutrition Industry Revenue Million Forecast, by Route of Administration 2019 & 2032
- Table 22: Global Medical Nutrition Industry Volume K Unit Forecast, by Route of Administration 2019 & 2032
- Table 23: Global Medical Nutrition Industry Revenue Million Forecast, by Application 2019 & 2032
- Table 24: Global Medical Nutrition Industry Volume K Unit Forecast, by Application 2019 & 2032
- Table 25: Global Medical Nutrition Industry Revenue Million Forecast, by End User 2019 & 2032
- Table 26: Global Medical Nutrition Industry Volume K Unit Forecast, by End User 2019 & 2032
- Table 27: Global Medical Nutrition Industry Revenue Million Forecast, by Country 2019 & 2032
- Table 28: Global Medical Nutrition Industry Volume K Unit Forecast, by Country 2019 & 2032
- Table 29: United States Medical Nutrition Industry Revenue (Million) Forecast, by Application 2019 & 2032
- Table 30: United States Medical Nutrition Industry Volume (K Unit) Forecast, by Application 2019 & 2032
- Table 31: Canada Medical Nutrition Industry Revenue (Million) Forecast, by Application 2019 & 2032
- Table 32: Canada Medical Nutrition Industry Volume (K Unit) Forecast, by Application 2019 & 2032
- Table 33: Mexico Medical Nutrition Industry Revenue (Million) Forecast, by Application 2019 & 2032
- Table 34: Mexico Medical Nutrition Industry Volume (K Unit) Forecast, by Application 2019 & 2032
- Table 35: Global Medical Nutrition Industry Revenue Million Forecast, by Route of Administration 2019 & 2032
- Table 36: Global Medical Nutrition Industry Volume K Unit Forecast, by Route of Administration 2019 & 2032
- Table 37: Global Medical Nutrition Industry Revenue Million Forecast, by Application 2019 & 2032
- Table 38: Global Medical Nutrition Industry Volume K Unit Forecast, by Application 2019 & 2032
- Table 39: Global Medical Nutrition Industry Revenue Million Forecast, by End User 2019 & 2032
- Table 40: Global Medical Nutrition Industry Volume K Unit Forecast, by End User 2019 & 2032
- Table 41: Global Medical Nutrition Industry Revenue Million Forecast, by Country 2019 & 2032
- Table 42: Global Medical Nutrition Industry Volume K Unit Forecast, by Country 2019 & 2032
- Table 43: Germany Medical Nutrition Industry Revenue (Million) Forecast, by Application 2019 & 2032
- Table 44: Germany Medical Nutrition Industry Volume (K Unit) Forecast, by Application 2019 & 2032
- Table 45: United Kingdom Medical Nutrition Industry Revenue (Million) Forecast, by Application 2019 & 2032
- Table 46: United Kingdom Medical Nutrition Industry Volume (K Unit) Forecast, by Application 2019 & 2032
- Table 47: France Medical Nutrition Industry Revenue (Million) Forecast, by Application 2019 & 2032
- Table 48: France Medical Nutrition Industry Volume (K Unit) Forecast, by Application 2019 & 2032
- Table 49: Italy Medical Nutrition Industry Revenue (Million) Forecast, by Application 2019 & 2032
- Table 50: Italy Medical Nutrition Industry Volume (K Unit) Forecast, by Application 2019 & 2032
- Table 51: Spain Medical Nutrition Industry Revenue (Million) Forecast, by Application 2019 & 2032
- Table 52: Spain Medical Nutrition Industry Volume (K Unit) Forecast, by Application 2019 & 2032
- Table 53: Rest of Europe Medical Nutrition Industry Revenue (Million) Forecast, by Application 2019 & 2032
- Table 54: Rest of Europe Medical Nutrition Industry Volume (K Unit) Forecast, by Application 2019 & 2032
- Table 55: Global Medical Nutrition Industry Revenue Million Forecast, by Route of Administration 2019 & 2032
- Table 56: Global Medical Nutrition Industry Volume K Unit Forecast, by Route of Administration 2019 & 2032
- Table 57: Global Medical Nutrition Industry Revenue Million Forecast, by Application 2019 & 2032
- Table 58: Global Medical Nutrition Industry Volume K Unit Forecast, by Application 2019 & 2032
- Table 59: Global Medical Nutrition Industry Revenue Million Forecast, by End User 2019 & 2032
- Table 60: Global Medical Nutrition Industry Volume K Unit Forecast, by End User 2019 & 2032
- Table 61: Global Medical Nutrition Industry Revenue Million Forecast, by Country 2019 & 2032
- Table 62: Global Medical Nutrition Industry Volume K Unit Forecast, by Country 2019 & 2032
- Table 63: China Medical Nutrition Industry Revenue (Million) Forecast, by Application 2019 & 2032
- Table 64: China Medical Nutrition Industry Volume (K Unit) Forecast, by Application 2019 & 2032
- Table 65: Japan Medical Nutrition Industry Revenue (Million) Forecast, by Application 2019 & 2032
- Table 66: Japan Medical Nutrition Industry Volume (K Unit) Forecast, by Application 2019 & 2032
- Table 67: India Medical Nutrition Industry Revenue (Million) Forecast, by Application 2019 & 2032
- Table 68: India Medical Nutrition Industry Volume (K Unit) Forecast, by Application 2019 & 2032
- Table 69: Australia Medical Nutrition Industry Revenue (Million) Forecast, by Application 2019 & 2032
- Table 70: Australia Medical Nutrition Industry Volume (K Unit) Forecast, by Application 2019 & 2032
- Table 71: South Korea Medical Nutrition Industry Revenue (Million) Forecast, by Application 2019 & 2032
- Table 72: South Korea Medical Nutrition Industry Volume (K Unit) Forecast, by Application 2019 & 2032
- Table 73: Rest of Asia Pacific Medical Nutrition Industry Revenue (Million) Forecast, by Application 2019 & 2032
- Table 74: Rest of Asia Pacific Medical Nutrition Industry Volume (K Unit) Forecast, by Application 2019 & 2032
- Table 75: Global Medical Nutrition Industry Revenue Million Forecast, by Route of Administration 2019 & 2032
- Table 76: Global Medical Nutrition Industry Volume K Unit Forecast, by Route of Administration 2019 & 2032
- Table 77: Global Medical Nutrition Industry Revenue Million Forecast, by Application 2019 & 2032
- Table 78: Global Medical Nutrition Industry Volume K Unit Forecast, by Application 2019 & 2032
- Table 79: Global Medical Nutrition Industry Revenue Million Forecast, by End User 2019 & 2032
- Table 80: Global Medical Nutrition Industry Volume K Unit Forecast, by End User 2019 & 2032
- Table 81: Global Medical Nutrition Industry Revenue Million Forecast, by Country 2019 & 2032
- Table 82: Global Medical Nutrition Industry Volume K Unit Forecast, by Country 2019 & 2032
- Table 83: GCC Medical Nutrition Industry Revenue (Million) Forecast, by Application 2019 & 2032
- Table 84: GCC Medical Nutrition Industry Volume (K Unit) Forecast, by Application 2019 & 2032
- Table 85: South Africa Medical Nutrition Industry Revenue (Million) Forecast, by Application 2019 & 2032
- Table 86: South Africa Medical Nutrition Industry Volume (K Unit) Forecast, by Application 2019 & 2032
- Table 87: Rest of Middle East and Africa Medical Nutrition Industry Revenue (Million) Forecast, by Application 2019 & 2032
- Table 88: Rest of Middle East and Africa Medical Nutrition Industry Volume (K Unit) Forecast, by Application 2019 & 2032
- Table 89: Global Medical Nutrition Industry Revenue Million Forecast, by Route of Administration 2019 & 2032
- Table 90: Global Medical Nutrition Industry Volume K Unit Forecast, by Route of Administration 2019 & 2032
- Table 91: Global Medical Nutrition Industry Revenue Million Forecast, by Application 2019 & 2032
- Table 92: Global Medical Nutrition Industry Volume K Unit Forecast, by Application 2019 & 2032
- Table 93: Global Medical Nutrition Industry Revenue Million Forecast, by End User 2019 & 2032
- Table 94: Global Medical Nutrition Industry Volume K Unit Forecast, by End User 2019 & 2032
- Table 95: Global Medical Nutrition Industry Revenue Million Forecast, by Country 2019 & 2032
- Table 96: Global Medical Nutrition Industry Volume K Unit Forecast, by Country 2019 & 2032
- Table 97: Brazil Medical Nutrition Industry Revenue (Million) Forecast, by Application 2019 & 2032
- Table 98: Brazil Medical Nutrition Industry Volume (K Unit) Forecast, by Application 2019 & 2032
- Table 99: Argentina Medical Nutrition Industry Revenue (Million) Forecast, by Application 2019 & 2032
- Table 100: Argentina Medical Nutrition Industry Volume (K Unit) Forecast, by Application 2019 & 2032
- Table 101: Rest of South America Medical Nutrition Industry Revenue (Million) Forecast, by Application 2019 & 2032
- Table 102: Rest of South America Medical Nutrition Industry Volume (K Unit) Forecast, by Application 2019 & 2032
Frequently Asked Questions
1. What is the projected Compound Annual Growth Rate (CAGR) of the Medical Nutrition Industry?
The projected CAGR is approximately 8.05%.
2. Which companies are prominent players in the Medical Nutrition Industry?
Key companies in the market include Medifood International Ltd, Abbott Laboratories (Abbott Nutrition), Fresenius Kabi, Danone (Nutricia), Perrigo Company PLC, Nestle Health Science, Ajinomoto Cambrooke Inc (Nualtra Ltd), AYMES International Ltd, Baxter Healthcare, B Braun SE, Reckitt Benckiser.
3. What are the main segments of the Medical Nutrition Industry?
The market segments include Route of Administration, Application, End User.
4. Can you provide details about the market size?
The market size is estimated to be USD 72.29 Million as of 2022.
5. What are some drivers contributing to market growth?
Increasing Prevalence of Metabolic Disorders; High Spending on Healthcare; Growing Geriatric Population.
6. What are the notable trends driving market growth?
Oral and Enteral Segment is Expected to Hold a Significant Market Share Over the Forecast Period.
7. Are there any restraints impacting market growth?
Imprecise Perception About Clinical Nutrition; Reduction in Birth Rates.
8. Can you provide examples of recent developments in the market?
October 2022: Hologram Sciences, and Maeil Health Nutrition entered into a strategic partnership to deliver personalized nutrition solutions to the Korean market.
9. What pricing options are available for accessing the report?
Pricing options include single-user, multi-user, and enterprise licenses priced at USD 4750, USD 5250, and USD 8750 respectively.
10. Is the market size provided in terms of value or volume?
The market size is provided in terms of value, measured in Million and volume, measured in K Unit.
11. Are there any specific market keywords associated with the report?
Yes, the market keyword associated with the report is "Medical Nutrition Industry," which aids in identifying and referencing the specific market segment covered.
12. How do I determine which pricing option suits my needs best?
The pricing options vary based on user requirements and access needs. Individual users may opt for single-user licenses, while businesses requiring broader access may choose multi-user or enterprise licenses for cost-effective access to the report.
13. Are there any additional resources or data provided in the Medical Nutrition Industry report?
While the report offers comprehensive insights, it's advisable to review the specific contents or supplementary materials provided to ascertain if additional resources or data are available.
14. How can I stay updated on further developments or reports in the Medical Nutrition Industry?
To stay informed about further developments, trends, and reports in the Medical Nutrition Industry, consider subscribing to industry newsletters, following relevant companies and organizations, or regularly checking reputable industry news sources and publications.
Methodology
Step 1 - Identification of Relevant Samples Size from Population Database


Step 2 - Approaches for Defining Global Market Size (Value, Volume* & Price*)

Note*: In applicable scenarios
Step 3 - Data Sources
Primary Research
- Web Analytics
- Survey Reports
- Research Institute
- Latest Research Reports
- Opinion Leaders
Secondary Research
- Annual Reports
- White Paper
- Latest Press Release
- Industry Association
- Paid Database
- Investor Presentations

Step 4 - Data Triangulation
Involves using different sources of information in order to increase the validity of a study
These sources are likely to be stakeholders in a program - participants, other researchers, program staff, other community members, and so on.
Then we put all data in single framework & apply various statistical tools to find out the dynamic on the market.
During the analysis stage, feedback from the stakeholder groups would be compared to determine areas of agreement as well as areas of divergence
