

Key Insights
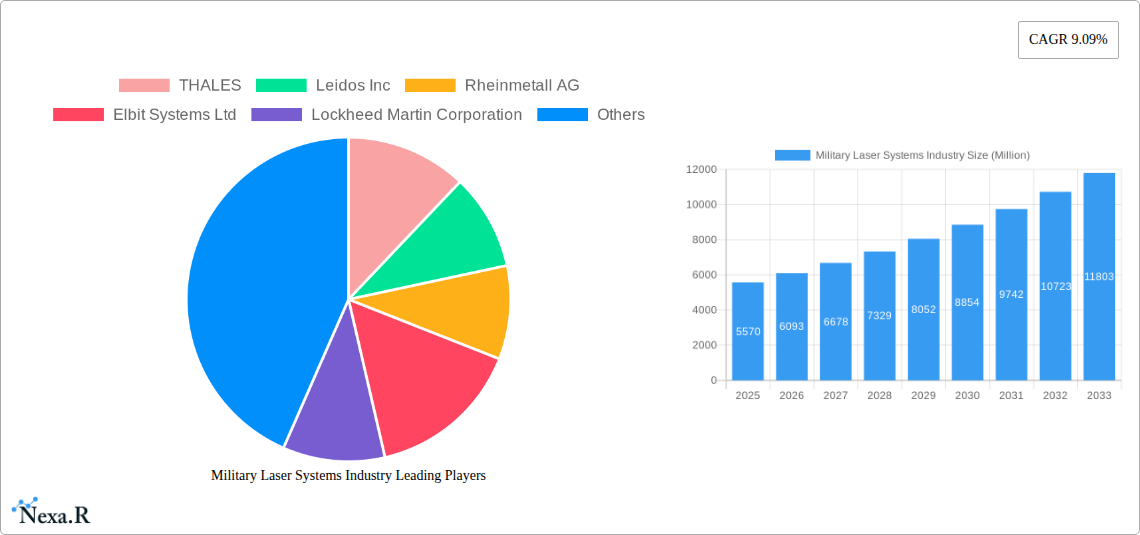
The Military Laser Systems market, valued at $5.57 billion in 2025, is projected to experience robust growth, driven by a compound annual growth rate (CAGR) of 9.09% from 2025 to 2033. This expansion is fueled by several key factors. Firstly, the increasing demand for advanced directed energy weapons (DEWs) for both offensive and defensive applications is a major catalyst. Governments worldwide are investing heavily in developing and deploying laser-based systems for their superior precision, speed, and cost-effectiveness compared to traditional munitions. Secondly, technological advancements in solid-state lasers and other laser technologies are enhancing the capabilities of military laser systems, leading to improved range, accuracy, and power efficiency. This is further complemented by ongoing research and development in miniaturization and integration of laser systems into various platforms, from aircraft and ground vehicles to unmanned aerial vehicles (UAVs). Finally, the growing adoption of laser-based guidance systems, laser sights, designators, and rangefinders in various military operations further contributes to market growth. These systems improve targeting accuracy, situational awareness, and overall operational efficiency, making them indispensable components of modern military arsenals.
However, the market also faces certain restraints. The high initial cost of development and deployment of advanced military laser systems can be a significant barrier to entry for some nations. Furthermore, concerns regarding the safety and potential for accidental or unintended consequences associated with the use of high-powered lasers need to be addressed through stringent safety protocols and regulations. Despite these challenges, the long-term outlook for the Military Laser Systems market remains highly positive, driven by continuous technological advancements and the increasing strategic importance of laser-based weaponry and targeting solutions in modern warfare. The market's segmentation, encompassing various technologies (solid-state, gas, others) and applications (DEWs, guidance systems, laser sights, etc.), provides opportunities for specialized players across the value chain. Leading companies like Thales, Lockheed Martin, and Rheinmetall are strategically positioned to capitalize on this growth trajectory through continuous innovation and strategic partnerships.
Military Laser Systems Industry Market Report: 2019-2033
This comprehensive report provides a detailed analysis of the Military Laser Systems market, encompassing market dynamics, growth trends, regional insights, product landscapes, and key players. The study period covers 2019-2033, with 2025 as the base and estimated year. The report is essential for industry professionals, investors, and strategic decision-makers seeking a deep understanding of this rapidly evolving sector. The market is segmented by technology (Solid State Lasers, Gas Lasers, Others) and application (Directed Energy Weapons, Guidance Systems, Laser Sights, Designators and Rangefinders, Others). The total market size is projected to reach xx Million by 2033.
Military Laser Systems Industry Market Dynamics & Structure
The Military Laser Systems market is characterized by a moderately concentrated landscape, with key players like Thales, Lockheed Martin, and Raytheon holding significant market share. Technological innovation, particularly in solid-state laser technology, is a primary growth driver. Stringent regulatory frameworks and export controls influence market access. Competitive pressures stem from the emergence of innovative solutions and the development of directed energy weapons (DEWs). The market witnesses continuous mergers and acquisitions (M&A) activity, with an estimated xx M&A deals in the historical period (2019-2024), shaping the competitive dynamics.
- Market Concentration: Moderately concentrated, with top 5 players holding approximately 60% market share in 2025.
- Technological Innovation: Solid-state lasers are driving innovation, offering higher efficiency and power output compared to gas lasers.
- Regulatory Landscape: Stringent regulations on the export of military laser technology significantly impact market dynamics.
- Competitive Substitutes: Traditional weapon systems remain competitive substitutes, although the advantages of laser systems are becoming increasingly apparent.
- End-User Demographics: Primarily defense ministries, armed forces, and government agencies.
- M&A Trends: Increased consolidation through strategic acquisitions and partnerships for technological advancements and market expansion.
Military Laser Systems Industry Growth Trends & Insights
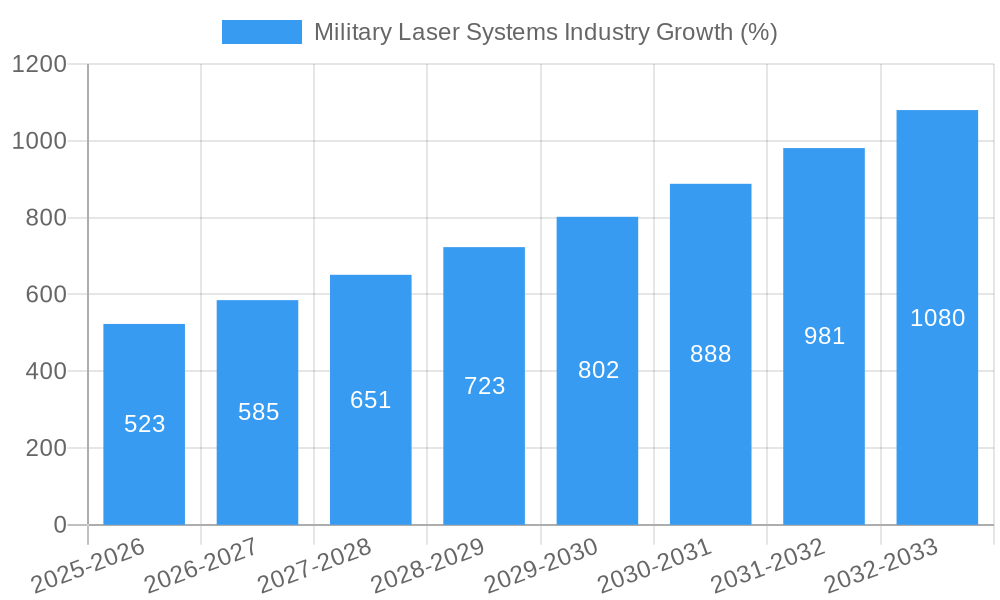
The Military Laser Systems market experienced significant growth during the historical period (2019-2024), driven by increasing defense budgets, the adoption of advanced technologies, and the growing demand for precision-guided munitions. The market is expected to maintain a healthy CAGR of xx% during the forecast period (2025-2033), reaching a projected market size of xx Million by 2033. This growth is fueled by technological advancements in laser technology, the increasing integration of laser systems into various military platforms, and the rising adoption of DEWs. The market penetration rate for laser-guided systems is expected to increase significantly in the coming years. Technological disruptions, such as the development of high-power fiber lasers and advancements in beam control technology, are reshaping the market landscape.
Dominant Regions, Countries, or Segments in Military Laser Systems Industry
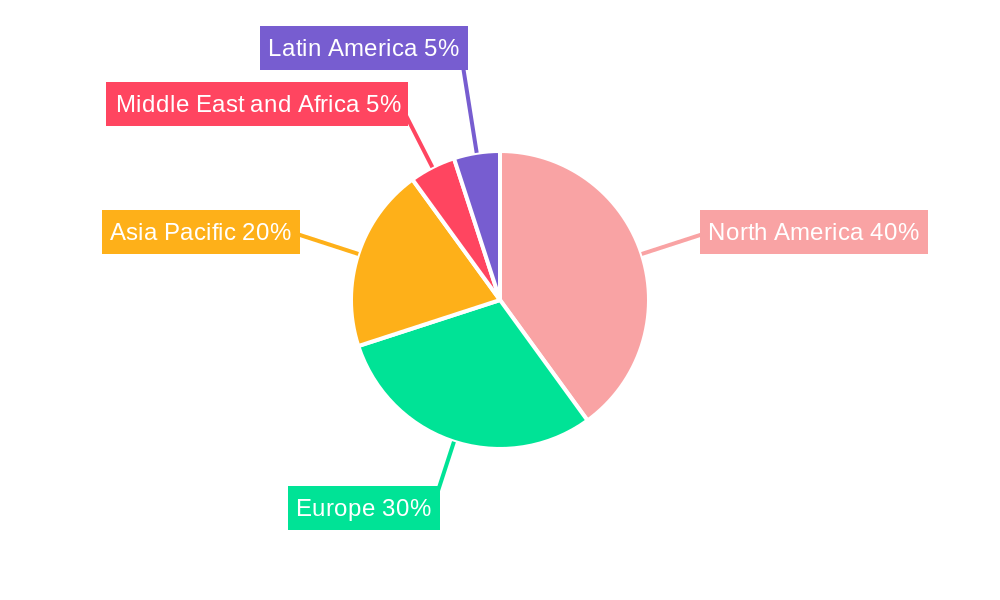
North America currently dominates the Military Laser Systems market, driven by substantial defense spending and technological advancements. The region’s significant investments in R&D and the presence of major industry players contribute to its market leadership. Within the technology segment, solid-state lasers are experiencing the most rapid growth, owing to their superior efficiency and scalability. In terms of application, Directed Energy Weapons (DEWs) are gaining significant traction due to their strategic advantages.
- North America: High defense expenditure, technological leadership, and strong domestic industry presence.
- Europe: Significant investments in defense modernization and a robust technology base.
- Asia-Pacific: Growing defense budgets and increasing demand for sophisticated military equipment.
- Solid-State Lasers: Superior efficiency, scalability, and compact design compared to other laser types.
- Directed Energy Weapons: Increased focus on developing and deploying DEWs for various military applications.
Military Laser Systems Industry Product Landscape
Military laser systems encompass a wide range of products, including laser designators, rangefinders, laser sights, and directed-energy weapons. Recent innovations focus on increasing power output, improving beam quality, and enhancing system portability. High-power fiber lasers are gaining prominence for their efficiency and scalability. Key performance metrics include power output, beam quality, range, and accuracy. Unique selling propositions include enhanced precision, reduced collateral damage, and improved targeting capabilities.
Key Drivers, Barriers & Challenges in Military Laser Systems Industry
Key Drivers:
- Increasing defense budgets globally.
- Growing demand for precision-guided munitions.
- Technological advancements in laser technology.
- Rising adoption of directed energy weapons.
Challenges and Restraints:
- High development and manufacturing costs.
- Technological complexities and integration challenges.
- Environmental factors (e.g., atmospheric effects on beam propagation).
- Supply chain disruptions impacting component availability. These disruptions caused a xx% increase in production lead times in 2022.
Emerging Opportunities in Military Laser Systems Industry
Emerging opportunities exist in the development of high-energy laser systems for DEWs, the integration of laser systems into unmanned aerial vehicles (UAVs), and the exploration of counter-drone applications. Furthermore, miniaturization and improved power efficiency create new opportunities for diverse applications. Untapped markets in developing economies with rising defense spending also present considerable potential.
Growth Accelerators in the Military Laser Systems Industry Industry
Long-term growth will be driven by continuous technological advancements, particularly in high-power fiber lasers and adaptive optics. Strategic partnerships between defense contractors and research institutions will also foster innovation. Furthermore, the increasing adoption of DEWs and expansion into new military applications will fuel market expansion.
Key Players Shaping the Military Laser Systems Industry Market
- THALES
- Leidos Inc
- Rheinmetall AG
- Elbit Systems Ltd
- Lockheed Martin Corporation
- MBDA
- IAI
- Rafael Advanced Defense Systems Ltd
- RTX Corporation
- BAE Systems plc
- Northrop Grumman Corporation
- The Boeing Company
Notable Milestones in Military Laser Systems Industry Sector
- June 2023: RTX Corporation delivered the fourth combat-ready laser weapon to the US Air Force. This 10 KW laser system is the first built to US military specifications in a stand-alone configuration.
- April 2023: The US Department of Defense (DoD) selected NUBURU Inc. for a contract to support the development of solid-state high-energy laser (HEL) weapon systems.
- March 2023: Blighter Surveillance Systems received a contract to supply Raytheon UK with radars for a laser weapon project with the UK MoD.
In-Depth Military Laser Systems Industry Market Outlook
The Military Laser Systems market is poised for substantial growth in the coming years, driven by technological breakthroughs, increasing defense modernization efforts, and the strategic importance of directed energy weapons. Strategic partnerships and collaborative R&D initiatives will play a crucial role in accelerating technological advancements and expanding market applications. The focus on miniaturization, improved efficiency, and enhanced portability will unlock new opportunities across various military platforms and operational scenarios.
Military Laser Systems Industry Segmentation
-
1. Technology
- 1.1. Solid-state Lasers
- 1.2. Gas Lasers
- 1.3. Other Technologies
-
2. Application
- 2.1. Directed Energy Weapons
- 2.2. Guidance Systems
- 2.3. Laser Sights, Designators, and Rangefinders
- 2.4. Other Applications
Military Laser Systems Industry Segmentation By Geography
-
1. North America
- 1.1. United States
- 1.2. Canada
-
2. Europe
- 2.1. United Kingdom
- 2.2. Germany
- 2.3. France
- 2.4. Italy
- 2.5. Russia
- 2.6. Rest of Europe
-
3. Asia Pacific
- 3.1. China
- 3.2. India
- 3.3. Japan
- 3.4. South Korea
- 3.5. Rest of Asia Pacific
-
4. Latin America
- 4.1. Brazil
- 4.2. Rest of Latin America
-
5. Middle East and Africa
- 5.1. United Arab Emirates
- 5.2. Saudi Arabia
- 5.3. Israel
- 5.4. Rest of Middle East and Africa
Military Laser Systems Industry REPORT HIGHLIGHTS
| Aspects | Details |
|---|---|
| Study Period | 2019-2033 |
| Base Year | 2024 |
| Estimated Year | 2025 |
| Forecast Period | 2025-2033 |
| Historical Period | 2019-2024 |
| Growth Rate | CAGR of 9.09% from 2019-2033 |
| Segmentation |
|
Table of Contents
- 1. Introduction
- 1.1. Research Scope
- 1.2. Market Segmentation
- 1.3. Research Methodology
- 1.4. Definitions and Assumptions
- 2. Executive Summary
- 2.1. Introduction
- 3. Market Dynamics
- 3.1. Introduction
- 3.2. Market Drivers
- 3.2.1. Increase in Internet of Things (IoT) and Autonomous Systems; Rise in Demand for Military and Defense Satellite Communication Solutions
- 3.3. Market Restrains
- 3.3.1. Cybersecurity Threats to Satellite Communication; Interference in Transmission of Data
- 3.4. Market Trends
- 3.4.1. Directed Energy Weapons Segment Projected to Exhibit the Highest CAGR During the Forecast Period
- 4. Market Factor Analysis
- 4.1. Porters Five Forces
- 4.2. Supply/Value Chain
- 4.3. PESTEL analysis
- 4.4. Market Entropy
- 4.5. Patent/Trademark Analysis
- 5. Global Military Laser Systems Industry Analysis, Insights and Forecast, 2019-2031
- 5.1. Market Analysis, Insights and Forecast - by Technology
- 5.1.1. Solid-state Lasers
- 5.1.2. Gas Lasers
- 5.1.3. Other Technologies
- 5.2. Market Analysis, Insights and Forecast - by Application
- 5.2.1. Directed Energy Weapons
- 5.2.2. Guidance Systems
- 5.2.3. Laser Sights, Designators, and Rangefinders
- 5.2.4. Other Applications
- 5.3. Market Analysis, Insights and Forecast - by Region
- 5.3.1. North America
- 5.3.2. Europe
- 5.3.3. Asia Pacific
- 5.3.4. Latin America
- 5.3.5. Middle East and Africa
- 5.1. Market Analysis, Insights and Forecast - by Technology
- 6. North America Military Laser Systems Industry Analysis, Insights and Forecast, 2019-2031
- 6.1. Market Analysis, Insights and Forecast - by Technology
- 6.1.1. Solid-state Lasers
- 6.1.2. Gas Lasers
- 6.1.3. Other Technologies
- 6.2. Market Analysis, Insights and Forecast - by Application
- 6.2.1. Directed Energy Weapons
- 6.2.2. Guidance Systems
- 6.2.3. Laser Sights, Designators, and Rangefinders
- 6.2.4. Other Applications
- 6.1. Market Analysis, Insights and Forecast - by Technology
- 7. Europe Military Laser Systems Industry Analysis, Insights and Forecast, 2019-2031
- 7.1. Market Analysis, Insights and Forecast - by Technology
- 7.1.1. Solid-state Lasers
- 7.1.2. Gas Lasers
- 7.1.3. Other Technologies
- 7.2. Market Analysis, Insights and Forecast - by Application
- 7.2.1. Directed Energy Weapons
- 7.2.2. Guidance Systems
- 7.2.3. Laser Sights, Designators, and Rangefinders
- 7.2.4. Other Applications
- 7.1. Market Analysis, Insights and Forecast - by Technology
- 8. Asia Pacific Military Laser Systems Industry Analysis, Insights and Forecast, 2019-2031
- 8.1. Market Analysis, Insights and Forecast - by Technology
- 8.1.1. Solid-state Lasers
- 8.1.2. Gas Lasers
- 8.1.3. Other Technologies
- 8.2. Market Analysis, Insights and Forecast - by Application
- 8.2.1. Directed Energy Weapons
- 8.2.2. Guidance Systems
- 8.2.3. Laser Sights, Designators, and Rangefinders
- 8.2.4. Other Applications
- 8.1. Market Analysis, Insights and Forecast - by Technology
- 9. Latin America Military Laser Systems Industry Analysis, Insights and Forecast, 2019-2031
- 9.1. Market Analysis, Insights and Forecast - by Technology
- 9.1.1. Solid-state Lasers
- 9.1.2. Gas Lasers
- 9.1.3. Other Technologies
- 9.2. Market Analysis, Insights and Forecast - by Application
- 9.2.1. Directed Energy Weapons
- 9.2.2. Guidance Systems
- 9.2.3. Laser Sights, Designators, and Rangefinders
- 9.2.4. Other Applications
- 9.1. Market Analysis, Insights and Forecast - by Technology
- 10. Middle East and Africa Military Laser Systems Industry Analysis, Insights and Forecast, 2019-2031
- 10.1. Market Analysis, Insights and Forecast - by Technology
- 10.1.1. Solid-state Lasers
- 10.1.2. Gas Lasers
- 10.1.3. Other Technologies
- 10.2. Market Analysis, Insights and Forecast - by Application
- 10.2.1. Directed Energy Weapons
- 10.2.2. Guidance Systems
- 10.2.3. Laser Sights, Designators, and Rangefinders
- 10.2.4. Other Applications
- 10.1. Market Analysis, Insights and Forecast - by Technology
- 11. North America Military Laser Systems Industry Analysis, Insights and Forecast, 2019-2031
- 11.1. Market Analysis, Insights and Forecast - By Country/Sub-region
- 11.1.1 United States
- 11.1.2 Canada
- 12. Europe Military Laser Systems Industry Analysis, Insights and Forecast, 2019-2031
- 12.1. Market Analysis, Insights and Forecast - By Country/Sub-region
- 12.1.1 United Kingdom
- 12.1.2 Germany
- 12.1.3 France
- 12.1.4 Italy
- 12.1.5 Russia
- 12.1.6 Rest of Europe
- 13. Asia Pacific Military Laser Systems Industry Analysis, Insights and Forecast, 2019-2031
- 13.1. Market Analysis, Insights and Forecast - By Country/Sub-region
- 13.1.1 China
- 13.1.2 India
- 13.1.3 Japan
- 13.1.4 South Korea
- 13.1.5 Rest of Asia Pacific
- 14. Latin America Military Laser Systems Industry Analysis, Insights and Forecast, 2019-2031
- 14.1. Market Analysis, Insights and Forecast - By Country/Sub-region
- 14.1.1 Brazil
- 14.1.2 Rest of Latin America
- 15. Middle East and Africa Military Laser Systems Industry Analysis, Insights and Forecast, 2019-2031
- 15.1. Market Analysis, Insights and Forecast - By Country/Sub-region
- 15.1.1 United Arab Emirates
- 15.1.2 Saudi Arabia
- 15.1.3 Israel
- 15.1.4 Rest of Middle East and Africa
- 16. Competitive Analysis
- 16.1. Global Market Share Analysis 2024
- 16.2. Company Profiles
- 16.2.1 THALES
- 16.2.1.1. Overview
- 16.2.1.2. Products
- 16.2.1.3. SWOT Analysis
- 16.2.1.4. Recent Developments
- 16.2.1.5. Financials (Based on Availability)
- 16.2.2 Leidos Inc
- 16.2.2.1. Overview
- 16.2.2.2. Products
- 16.2.2.3. SWOT Analysis
- 16.2.2.4. Recent Developments
- 16.2.2.5. Financials (Based on Availability)
- 16.2.3 Rheinmetall AG
- 16.2.3.1. Overview
- 16.2.3.2. Products
- 16.2.3.3. SWOT Analysis
- 16.2.3.4. Recent Developments
- 16.2.3.5. Financials (Based on Availability)
- 16.2.4 Elbit Systems Ltd
- 16.2.4.1. Overview
- 16.2.4.2. Products
- 16.2.4.3. SWOT Analysis
- 16.2.4.4. Recent Developments
- 16.2.4.5. Financials (Based on Availability)
- 16.2.5 Lockheed Martin Corporation
- 16.2.5.1. Overview
- 16.2.5.2. Products
- 16.2.5.3. SWOT Analysis
- 16.2.5.4. Recent Developments
- 16.2.5.5. Financials (Based on Availability)
- 16.2.6 MBDA
- 16.2.6.1. Overview
- 16.2.6.2. Products
- 16.2.6.3. SWOT Analysis
- 16.2.6.4. Recent Developments
- 16.2.6.5. Financials (Based on Availability)
- 16.2.7 IAI
- 16.2.7.1. Overview
- 16.2.7.2. Products
- 16.2.7.3. SWOT Analysis
- 16.2.7.4. Recent Developments
- 16.2.7.5. Financials (Based on Availability)
- 16.2.8 Rafael Advanced Defense Systems Ltd
- 16.2.8.1. Overview
- 16.2.8.2. Products
- 16.2.8.3. SWOT Analysis
- 16.2.8.4. Recent Developments
- 16.2.8.5. Financials (Based on Availability)
- 16.2.9 RTX Corporation
- 16.2.9.1. Overview
- 16.2.9.2. Products
- 16.2.9.3. SWOT Analysis
- 16.2.9.4. Recent Developments
- 16.2.9.5. Financials (Based on Availability)
- 16.2.10 BAE Systems plc
- 16.2.10.1. Overview
- 16.2.10.2. Products
- 16.2.10.3. SWOT Analysis
- 16.2.10.4. Recent Developments
- 16.2.10.5. Financials (Based on Availability)
- 16.2.11 Northrop Grumman Corporation
- 16.2.11.1. Overview
- 16.2.11.2. Products
- 16.2.11.3. SWOT Analysis
- 16.2.11.4. Recent Developments
- 16.2.11.5. Financials (Based on Availability)
- 16.2.12 The Boeing Company
- 16.2.12.1. Overview
- 16.2.12.2. Products
- 16.2.12.3. SWOT Analysis
- 16.2.12.4. Recent Developments
- 16.2.12.5. Financials (Based on Availability)
- 16.2.1 THALES
List of Figures
- Figure 1: Global Military Laser Systems Industry Revenue Breakdown (Million, %) by Region 2024 & 2032
- Figure 2: North America Military Laser Systems Industry Revenue (Million), by Country 2024 & 2032
- Figure 3: North America Military Laser Systems Industry Revenue Share (%), by Country 2024 & 2032
- Figure 4: Europe Military Laser Systems Industry Revenue (Million), by Country 2024 & 2032
- Figure 5: Europe Military Laser Systems Industry Revenue Share (%), by Country 2024 & 2032
- Figure 6: Asia Pacific Military Laser Systems Industry Revenue (Million), by Country 2024 & 2032
- Figure 7: Asia Pacific Military Laser Systems Industry Revenue Share (%), by Country 2024 & 2032
- Figure 8: Latin America Military Laser Systems Industry Revenue (Million), by Country 2024 & 2032
- Figure 9: Latin America Military Laser Systems Industry Revenue Share (%), by Country 2024 & 2032
- Figure 10: Middle East and Africa Military Laser Systems Industry Revenue (Million), by Country 2024 & 2032
- Figure 11: Middle East and Africa Military Laser Systems Industry Revenue Share (%), by Country 2024 & 2032
- Figure 12: North America Military Laser Systems Industry Revenue (Million), by Technology 2024 & 2032
- Figure 13: North America Military Laser Systems Industry Revenue Share (%), by Technology 2024 & 2032
- Figure 14: North America Military Laser Systems Industry Revenue (Million), by Application 2024 & 2032
- Figure 15: North America Military Laser Systems Industry Revenue Share (%), by Application 2024 & 2032
- Figure 16: North America Military Laser Systems Industry Revenue (Million), by Country 2024 & 2032
- Figure 17: North America Military Laser Systems Industry Revenue Share (%), by Country 2024 & 2032
- Figure 18: Europe Military Laser Systems Industry Revenue (Million), by Technology 2024 & 2032
- Figure 19: Europe Military Laser Systems Industry Revenue Share (%), by Technology 2024 & 2032
- Figure 20: Europe Military Laser Systems Industry Revenue (Million), by Application 2024 & 2032
- Figure 21: Europe Military Laser Systems Industry Revenue Share (%), by Application 2024 & 2032
- Figure 22: Europe Military Laser Systems Industry Revenue (Million), by Country 2024 & 2032
- Figure 23: Europe Military Laser Systems Industry Revenue Share (%), by Country 2024 & 2032
- Figure 24: Asia Pacific Military Laser Systems Industry Revenue (Million), by Technology 2024 & 2032
- Figure 25: Asia Pacific Military Laser Systems Industry Revenue Share (%), by Technology 2024 & 2032
- Figure 26: Asia Pacific Military Laser Systems Industry Revenue (Million), by Application 2024 & 2032
- Figure 27: Asia Pacific Military Laser Systems Industry Revenue Share (%), by Application 2024 & 2032
- Figure 28: Asia Pacific Military Laser Systems Industry Revenue (Million), by Country 2024 & 2032
- Figure 29: Asia Pacific Military Laser Systems Industry Revenue Share (%), by Country 2024 & 2032
- Figure 30: Latin America Military Laser Systems Industry Revenue (Million), by Technology 2024 & 2032
- Figure 31: Latin America Military Laser Systems Industry Revenue Share (%), by Technology 2024 & 2032
- Figure 32: Latin America Military Laser Systems Industry Revenue (Million), by Application 2024 & 2032
- Figure 33: Latin America Military Laser Systems Industry Revenue Share (%), by Application 2024 & 2032
- Figure 34: Latin America Military Laser Systems Industry Revenue (Million), by Country 2024 & 2032
- Figure 35: Latin America Military Laser Systems Industry Revenue Share (%), by Country 2024 & 2032
- Figure 36: Middle East and Africa Military Laser Systems Industry Revenue (Million), by Technology 2024 & 2032
- Figure 37: Middle East and Africa Military Laser Systems Industry Revenue Share (%), by Technology 2024 & 2032
- Figure 38: Middle East and Africa Military Laser Systems Industry Revenue (Million), by Application 2024 & 2032
- Figure 39: Middle East and Africa Military Laser Systems Industry Revenue Share (%), by Application 2024 & 2032
- Figure 40: Middle East and Africa Military Laser Systems Industry Revenue (Million), by Country 2024 & 2032
- Figure 41: Middle East and Africa Military Laser Systems Industry Revenue Share (%), by Country 2024 & 2032
List of Tables
- Table 1: Global Military Laser Systems Industry Revenue Million Forecast, by Region 2019 & 2032
- Table 2: Global Military Laser Systems Industry Revenue Million Forecast, by Technology 2019 & 2032
- Table 3: Global Military Laser Systems Industry Revenue Million Forecast, by Application 2019 & 2032
- Table 4: Global Military Laser Systems Industry Revenue Million Forecast, by Region 2019 & 2032
- Table 5: Global Military Laser Systems Industry Revenue Million Forecast, by Country 2019 & 2032
- Table 6: United States Military Laser Systems Industry Revenue (Million) Forecast, by Application 2019 & 2032
- Table 7: Canada Military Laser Systems Industry Revenue (Million) Forecast, by Application 2019 & 2032
- Table 8: Global Military Laser Systems Industry Revenue Million Forecast, by Country 2019 & 2032
- Table 9: United Kingdom Military Laser Systems Industry Revenue (Million) Forecast, by Application 2019 & 2032
- Table 10: Germany Military Laser Systems Industry Revenue (Million) Forecast, by Application 2019 & 2032
- Table 11: France Military Laser Systems Industry Revenue (Million) Forecast, by Application 2019 & 2032
- Table 12: Italy Military Laser Systems Industry Revenue (Million) Forecast, by Application 2019 & 2032
- Table 13: Russia Military Laser Systems Industry Revenue (Million) Forecast, by Application 2019 & 2032
- Table 14: Rest of Europe Military Laser Systems Industry Revenue (Million) Forecast, by Application 2019 & 2032
- Table 15: Global Military Laser Systems Industry Revenue Million Forecast, by Country 2019 & 2032
- Table 16: China Military Laser Systems Industry Revenue (Million) Forecast, by Application 2019 & 2032
- Table 17: India Military Laser Systems Industry Revenue (Million) Forecast, by Application 2019 & 2032
- Table 18: Japan Military Laser Systems Industry Revenue (Million) Forecast, by Application 2019 & 2032
- Table 19: South Korea Military Laser Systems Industry Revenue (Million) Forecast, by Application 2019 & 2032
- Table 20: Rest of Asia Pacific Military Laser Systems Industry Revenue (Million) Forecast, by Application 2019 & 2032
- Table 21: Global Military Laser Systems Industry Revenue Million Forecast, by Country 2019 & 2032
- Table 22: Brazil Military Laser Systems Industry Revenue (Million) Forecast, by Application 2019 & 2032
- Table 23: Rest of Latin America Military Laser Systems Industry Revenue (Million) Forecast, by Application 2019 & 2032
- Table 24: Global Military Laser Systems Industry Revenue Million Forecast, by Country 2019 & 2032
- Table 25: United Arab Emirates Military Laser Systems Industry Revenue (Million) Forecast, by Application 2019 & 2032
- Table 26: Saudi Arabia Military Laser Systems Industry Revenue (Million) Forecast, by Application 2019 & 2032
- Table 27: Israel Military Laser Systems Industry Revenue (Million) Forecast, by Application 2019 & 2032
- Table 28: Rest of Middle East and Africa Military Laser Systems Industry Revenue (Million) Forecast, by Application 2019 & 2032
- Table 29: Global Military Laser Systems Industry Revenue Million Forecast, by Technology 2019 & 2032
- Table 30: Global Military Laser Systems Industry Revenue Million Forecast, by Application 2019 & 2032
- Table 31: Global Military Laser Systems Industry Revenue Million Forecast, by Country 2019 & 2032
- Table 32: United States Military Laser Systems Industry Revenue (Million) Forecast, by Application 2019 & 2032
- Table 33: Canada Military Laser Systems Industry Revenue (Million) Forecast, by Application 2019 & 2032
- Table 34: Global Military Laser Systems Industry Revenue Million Forecast, by Technology 2019 & 2032
- Table 35: Global Military Laser Systems Industry Revenue Million Forecast, by Application 2019 & 2032
- Table 36: Global Military Laser Systems Industry Revenue Million Forecast, by Country 2019 & 2032
- Table 37: United Kingdom Military Laser Systems Industry Revenue (Million) Forecast, by Application 2019 & 2032
- Table 38: Germany Military Laser Systems Industry Revenue (Million) Forecast, by Application 2019 & 2032
- Table 39: France Military Laser Systems Industry Revenue (Million) Forecast, by Application 2019 & 2032
- Table 40: Italy Military Laser Systems Industry Revenue (Million) Forecast, by Application 2019 & 2032
- Table 41: Russia Military Laser Systems Industry Revenue (Million) Forecast, by Application 2019 & 2032
- Table 42: Rest of Europe Military Laser Systems Industry Revenue (Million) Forecast, by Application 2019 & 2032
- Table 43: Global Military Laser Systems Industry Revenue Million Forecast, by Technology 2019 & 2032
- Table 44: Global Military Laser Systems Industry Revenue Million Forecast, by Application 2019 & 2032
- Table 45: Global Military Laser Systems Industry Revenue Million Forecast, by Country 2019 & 2032
- Table 46: China Military Laser Systems Industry Revenue (Million) Forecast, by Application 2019 & 2032
- Table 47: India Military Laser Systems Industry Revenue (Million) Forecast, by Application 2019 & 2032
- Table 48: Japan Military Laser Systems Industry Revenue (Million) Forecast, by Application 2019 & 2032
- Table 49: South Korea Military Laser Systems Industry Revenue (Million) Forecast, by Application 2019 & 2032
- Table 50: Rest of Asia Pacific Military Laser Systems Industry Revenue (Million) Forecast, by Application 2019 & 2032
- Table 51: Global Military Laser Systems Industry Revenue Million Forecast, by Technology 2019 & 2032
- Table 52: Global Military Laser Systems Industry Revenue Million Forecast, by Application 2019 & 2032
- Table 53: Global Military Laser Systems Industry Revenue Million Forecast, by Country 2019 & 2032
- Table 54: Brazil Military Laser Systems Industry Revenue (Million) Forecast, by Application 2019 & 2032
- Table 55: Rest of Latin America Military Laser Systems Industry Revenue (Million) Forecast, by Application 2019 & 2032
- Table 56: Global Military Laser Systems Industry Revenue Million Forecast, by Technology 2019 & 2032
- Table 57: Global Military Laser Systems Industry Revenue Million Forecast, by Application 2019 & 2032
- Table 58: Global Military Laser Systems Industry Revenue Million Forecast, by Country 2019 & 2032
- Table 59: United Arab Emirates Military Laser Systems Industry Revenue (Million) Forecast, by Application 2019 & 2032
- Table 60: Saudi Arabia Military Laser Systems Industry Revenue (Million) Forecast, by Application 2019 & 2032
- Table 61: Israel Military Laser Systems Industry Revenue (Million) Forecast, by Application 2019 & 2032
- Table 62: Rest of Middle East and Africa Military Laser Systems Industry Revenue (Million) Forecast, by Application 2019 & 2032
Frequently Asked Questions
1. What is the projected Compound Annual Growth Rate (CAGR) of the Military Laser Systems Industry?
The projected CAGR is approximately 9.09%.
2. Which companies are prominent players in the Military Laser Systems Industry?
Key companies in the market include THALES, Leidos Inc, Rheinmetall AG, Elbit Systems Ltd, Lockheed Martin Corporation, MBDA, IAI, Rafael Advanced Defense Systems Ltd, RTX Corporation, BAE Systems plc, Northrop Grumman Corporation, The Boeing Company.
3. What are the main segments of the Military Laser Systems Industry?
The market segments include Technology, Application.
4. Can you provide details about the market size?
The market size is estimated to be USD 5.57 Million as of 2022.
5. What are some drivers contributing to market growth?
Increase in Internet of Things (IoT) and Autonomous Systems; Rise in Demand for Military and Defense Satellite Communication Solutions.
6. What are the notable trends driving market growth?
Directed Energy Weapons Segment Projected to Exhibit the Highest CAGR During the Forecast Period.
7. Are there any restraints impacting market growth?
Cybersecurity Threats to Satellite Communication; Interference in Transmission of Data.
8. Can you provide examples of recent developments in the market?
June 2023: RTX Corporation delivered the fourth combat-ready laser weapon to the US Air Force. The new palletized laser weapon was the first 10 KW laser built to US military specifications in a stand-alone configuration that can be moved and mounted anywhere it's needed.
9. What pricing options are available for accessing the report?
Pricing options include single-user, multi-user, and enterprise licenses priced at USD 4750, USD 5250, and USD 8750 respectively.
10. Is the market size provided in terms of value or volume?
The market size is provided in terms of value, measured in Million.
11. Are there any specific market keywords associated with the report?
Yes, the market keyword associated with the report is "Military Laser Systems Industry," which aids in identifying and referencing the specific market segment covered.
12. How do I determine which pricing option suits my needs best?
The pricing options vary based on user requirements and access needs. Individual users may opt for single-user licenses, while businesses requiring broader access may choose multi-user or enterprise licenses for cost-effective access to the report.
13. Are there any additional resources or data provided in the Military Laser Systems Industry report?
While the report offers comprehensive insights, it's advisable to review the specific contents or supplementary materials provided to ascertain if additional resources or data are available.
14. How can I stay updated on further developments or reports in the Military Laser Systems Industry?
To stay informed about further developments, trends, and reports in the Military Laser Systems Industry, consider subscribing to industry newsletters, following relevant companies and organizations, or regularly checking reputable industry news sources and publications.
Methodology
Step 1 - Identification of Relevant Samples Size from Population Database


Step 2 - Approaches for Defining Global Market Size (Value, Volume* & Price*)

Note*: In applicable scenarios
Step 3 - Data Sources
Primary Research
- Web Analytics
- Survey Reports
- Research Institute
- Latest Research Reports
- Opinion Leaders
Secondary Research
- Annual Reports
- White Paper
- Latest Press Release
- Industry Association
- Paid Database
- Investor Presentations

Step 4 - Data Triangulation
Involves using different sources of information in order to increase the validity of a study
These sources are likely to be stakeholders in a program - participants, other researchers, program staff, other community members, and so on.
Then we put all data in single framework & apply various statistical tools to find out the dynamic on the market.
During the analysis stage, feedback from the stakeholder groups would be compared to determine areas of agreement as well as areas of divergence
