

Key Insights
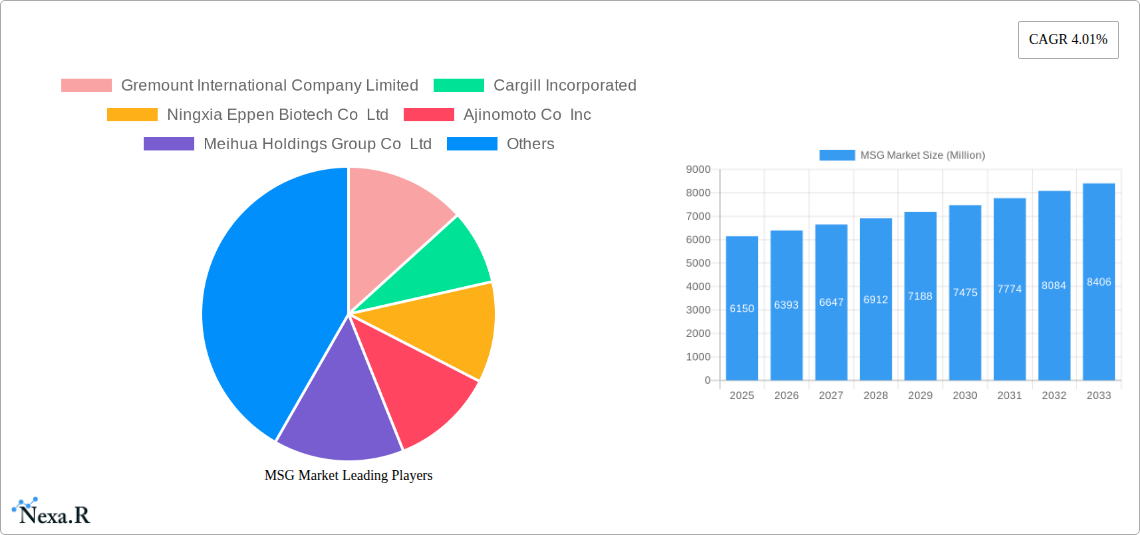
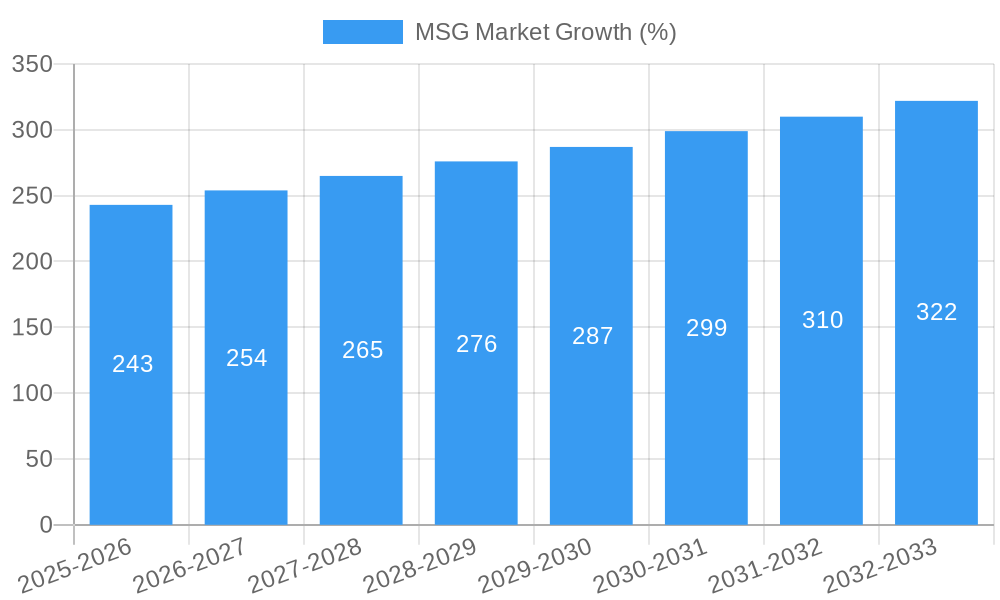
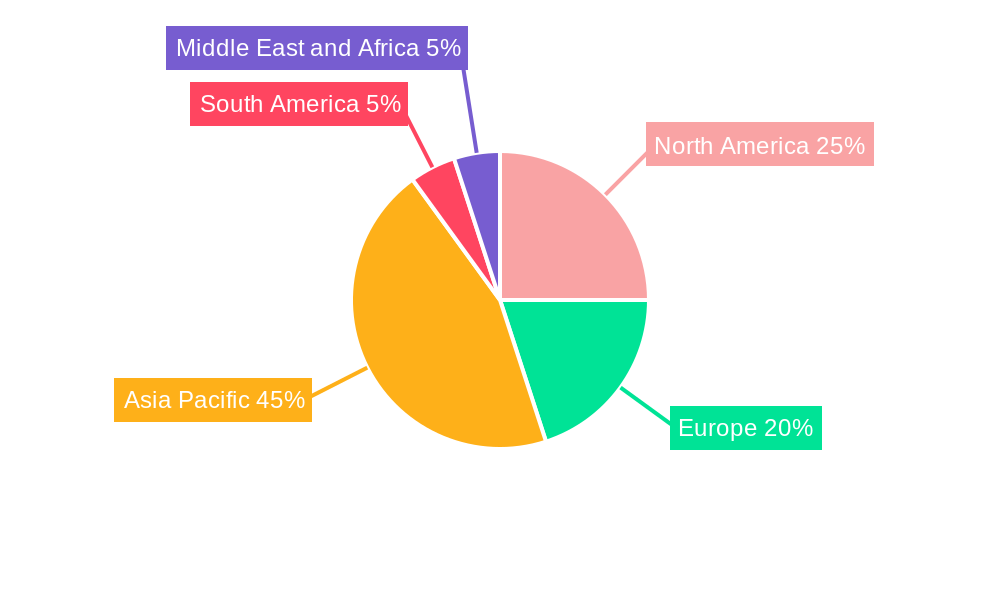
The global monosodium glutamate (MSG) market, valued at $6.15 billion in 2025, is projected to experience steady growth, driven by increasing demand from the food processing industry. The compound annual growth rate (CAGR) of 4.01% from 2025 to 2033 indicates a consistent expansion, fueled primarily by the rising popularity of processed foods, particularly noodles, soups, and meat products, across diverse geographical regions. The Asia-Pacific region, with its large and rapidly growing population and established food processing sector, is expected to remain a key market driver, contributing significantly to the overall market size. Growth in emerging economies is further propelling demand as consumer preferences shift toward convenient and flavorful food options. While the market faces some restraints such as increasing health concerns surrounding MSG consumption and stringent regulations in certain markets, these are largely offset by the development of high-quality, purified MSG and growing consumer awareness of its benefits as a flavor enhancer and nutritional supplement, when consumed in moderation. Key players in the market, including Ajinomoto, Cargill, and others, are focusing on product innovation, expansion into new markets, and strategic partnerships to maintain their competitive edge and capitalize on the market's growth potential. Segmentation by application reveals noodles, soups, and broth as leading consumers of MSG, highlighting the market’s deep integration within established food categories.
The forecast period of 2025-2033 suggests continued growth, with a projected market value exceeding $8 billion by 2033. This growth will be influenced by factors such as increasing urbanization, changing lifestyles, and the proliferation of quick-service restaurants and food delivery services, all of which contribute to higher consumption of processed foods. However, the market's success will hinge on addressing consumer concerns regarding MSG's health impacts through transparent labeling and educational campaigns emphasizing responsible consumption. Furthermore, adapting to evolving regulations and exploring new applications of MSG in areas like seasonings and dressings will be crucial for long-term market success. Companies are likely to focus on sustainable sourcing and production methods to cater to growing consumer demands for ethically produced food ingredients.
MSG Market: A Comprehensive Market Report (2019-2033)
This comprehensive report provides an in-depth analysis of the global Monosodium Glutamate (MSG) market, encompassing market dynamics, growth trends, regional analysis, product landscape, key players, and future outlook. The study period covers 2019-2033, with a base year of 2025 and a forecast period of 2025-2033. The report is invaluable for industry professionals, investors, and strategic decision-makers seeking a complete understanding of this vital food ingredient market.
MSG Market Dynamics & Structure
The global MSG market, valued at xx Million in 2025, is characterized by moderate concentration with key players holding significant market share. Technological advancements, particularly in production efficiency and quality control, are driving market growth. Stringent regulatory frameworks concerning food safety and labeling influence market practices. The market faces competition from alternative flavor enhancers, but MSG’s cost-effectiveness and established consumer acceptance remain significant advantages. M&A activity has been relatively consistent, with xx deals recorded in the historical period (2019-2024), primarily driven by consolidation and expansion strategies.
- Market Concentration: Highly concentrated market with top 5 players holding approximately 60% market share in 2025.
- Technological Innovation: Focus on improving production efficiency and reducing impurities to enhance product quality.
- Regulatory Framework: Stringent food safety and labeling regulations vary across regions, influencing market dynamics.
- Competitive Substitutes: Competition from natural flavoring agents and other taste enhancers remains a key factor.
- End-User Demographics: Growing demand from processed food industries and the increasing global population drives market growth.
- M&A Trends: Consolidation and expansion strategies are major drivers behind M&A activity.
MSG Market Growth Trends & Insights
The MSG market experienced a CAGR of xx% during the historical period (2019-2024), reaching xx Million in 2024. This growth is attributed to several factors. Rising disposable incomes in emerging economies have led to increased consumption of processed foods, which are major consumers of MSG. Technological advancements in production have increased efficiency and decreased costs. Changing consumer preferences towards convenient and ready-to-eat meals also positively impact market growth. Market penetration is expected to further increase in the forecast period (2025-2033), with a projected CAGR of xx%, driven by factors such as increasing demand from the food service industry and the continuous growth of global population. Technological innovations such as improved fermentation techniques and better purification processes are further augmenting the market growth.
Dominant Regions, Countries, or Segments in MSG Market
Asia Pacific dominates the global MSG market, accounting for approximately xx% of the total market share in 2025. This dominance stems from significant production capacity, large consumer base, and rapid growth of the food processing industry in this region. China and India are the key contributors to this regional dominance. Within application segments, the Noodles and Soups and Broth segment represents the largest consumer of MSG, accounting for xx% in 2025, driven by high consumption of these food items globally.
- Asia Pacific Dominance: High production capacity, large consumer base, and growing food processing industry.
- China and India: Leading contributors to Asia Pacific's market dominance.
- Noodles and Soups and Broth: Largest application segment driven by high consumption.
- Meat Products: Strong growth potential attributed to the rising demand for processed meat products.
- Economic Factors: Growing disposable incomes and urbanization positively influence consumption patterns.
MSG Market Product Landscape
The MSG market offers a range of products with varying purity levels and functionalities. Innovations focus on enhancing product quality, improving taste profiles, and developing specialized products for specific applications. Many manufacturers are focusing on developing MSG products with enhanced functional properties and improved sensory attributes. Technological advancements such as advanced fermentation techniques and membrane separation technologies are improving product purity and yield, leading to cost reduction.
Key Drivers, Barriers & Challenges in MSG Market
Key Drivers:
- Rising demand for processed food products globally.
- Increasing consumption of convenience foods and ready-to-eat meals.
- Technological advancements in production efficiency and cost reduction.
- Growing urbanization and changing dietary habits.
Key Challenges:
- Concerns about MSG’s potential health effects, though largely refuted by scientific studies.
- Fluctuations in raw material prices (e.g., sugar beet molasses).
- Stringent regulatory frameworks and labeling requirements.
- Competition from alternative flavor enhancers.
Emerging Opportunities in MSG Market
- Growing demand for MSG in emerging markets.
- Expansion into new applications, such as plant-based meat alternatives.
- Development of functional MSG products with added health benefits.
- Focus on sustainable and eco-friendly production methods.
Growth Accelerators in the MSG Market Industry
Continued investment in research and development, along with strategic partnerships and collaborations within the food industry, will propel market growth. Furthermore, expansion into new and emerging markets in Africa and Latin America will open significant opportunities for growth. The industry's focus on sustainability and eco-friendly production methods will further enhance its appeal to consumers.
Key Players Shaping the MSG Market Market
- Gremount International Company Limited
- Cargill Incorporated
- Ningxia Eppen Biotech Co Ltd
- Ajinomoto Co Inc
- Meihua Holdings Group Co Ltd
- Shandong Xinle Monosodium Glutamate Limited Company
- COFCO
- Fufeng Group
- Shandong Qilu Biotechnology Group Co
- Henan Lotus Flower Gourmet Powder Co
Notable Milestones in MSG Market Sector
- 2020: Ajinomoto Co Inc launched a new range of MSG products with improved purity.
- 2022: Cargill Incorporated acquired a smaller MSG producer, expanding its market share.
- 2023: New regulatory guidelines on MSG labeling were introduced in several key markets. (Specific details on these guidelines would be included in the full report)
In-Depth MSG Market Market Outlook
The MSG market is poised for continued growth in the forecast period (2025-2033), driven by factors such as rising demand for processed foods, population growth, and technological advancements. Strategic partnerships, expansion into new markets, and the development of innovative products will further accelerate market growth. The industry's focus on sustainability will appeal to environmentally conscious consumers. Overall, the MSG market presents lucrative opportunities for established players and new entrants alike.
MSG Market Segmentation
-
1. Application
- 1.1. Noodles, Soups and Broth
- 1.2. Meat Products
- 1.3. Seasonings and Dressings
- 1.4. Other Applications
MSG Market Segmentation By Geography
-
1. North America
- 1.1. United States
- 1.2. Canada
- 1.3. Mexico
- 1.4. Rest of North America
-
2. Europe
- 2.1. Germany
- 2.2. United Kingdom
- 2.3. France
- 2.4. Russia
- 2.5. Rest of Europe
-
3. Asia Pacific
- 3.1. China
- 3.2. Japan
- 3.3. India
- 3.4. Australia
- 3.5. Rest of Asia Pacific
-
4. South America
- 4.1. Brazil
- 4.2. Argentina
- 4.3. Rest of South America
-
5. Middle East and Africa
- 5.1. South Africa
- 5.2. United Arab Emirates
- 5.3. Rest of Middle East and Africa
MSG Market REPORT HIGHLIGHTS
| Aspects | Details |
|---|---|
| Study Period | 2019-2033 |
| Base Year | 2024 |
| Estimated Year | 2025 |
| Forecast Period | 2025-2033 |
| Historical Period | 2019-2024 |
| Growth Rate | CAGR of 4.01% from 2019-2033 |
| Segmentation |
|
Table of Contents
- 1. Introduction
- 1.1. Research Scope
- 1.2. Market Segmentation
- 1.3. Research Methodology
- 1.4. Definitions and Assumptions
- 2. Executive Summary
- 2.1. Introduction
- 3. Market Dynamics
- 3.1. Introduction
- 3.2. Market Drivers
- 3.2.1. Consumer inclination toward functional food and beverages; Increasing Number of Applications and Growing Industrial Use
- 3.3. Market Restrains
- 3.3.1. Increasing Shift Toward Plant-Based Protein
- 3.4. Market Trends
- 3.4.1. Rising Demand for Ready -To-Eat and Processed Food
- 4. Market Factor Analysis
- 4.1. Porters Five Forces
- 4.2. Supply/Value Chain
- 4.3. PESTEL analysis
- 4.4. Market Entropy
- 4.5. Patent/Trademark Analysis
- 5. Global MSG Market Analysis, Insights and Forecast, 2019-2031
- 5.1. Market Analysis, Insights and Forecast - by Application
- 5.1.1. Noodles, Soups and Broth
- 5.1.2. Meat Products
- 5.1.3. Seasonings and Dressings
- 5.1.4. Other Applications
- 5.2. Market Analysis, Insights and Forecast - by Region
- 5.2.1. North America
- 5.2.2. Europe
- 5.2.3. Asia Pacific
- 5.2.4. South America
- 5.2.5. Middle East and Africa
- 5.1. Market Analysis, Insights and Forecast - by Application
- 6. North America MSG Market Analysis, Insights and Forecast, 2019-2031
- 6.1. Market Analysis, Insights and Forecast - by Application
- 6.1.1. Noodles, Soups and Broth
- 6.1.2. Meat Products
- 6.1.3. Seasonings and Dressings
- 6.1.4. Other Applications
- 6.1. Market Analysis, Insights and Forecast - by Application
- 7. Europe MSG Market Analysis, Insights and Forecast, 2019-2031
- 7.1. Market Analysis, Insights and Forecast - by Application
- 7.1.1. Noodles, Soups and Broth
- 7.1.2. Meat Products
- 7.1.3. Seasonings and Dressings
- 7.1.4. Other Applications
- 7.1. Market Analysis, Insights and Forecast - by Application
- 8. Asia Pacific MSG Market Analysis, Insights and Forecast, 2019-2031
- 8.1. Market Analysis, Insights and Forecast - by Application
- 8.1.1. Noodles, Soups and Broth
- 8.1.2. Meat Products
- 8.1.3. Seasonings and Dressings
- 8.1.4. Other Applications
- 8.1. Market Analysis, Insights and Forecast - by Application
- 9. South America MSG Market Analysis, Insights and Forecast, 2019-2031
- 9.1. Market Analysis, Insights and Forecast - by Application
- 9.1.1. Noodles, Soups and Broth
- 9.1.2. Meat Products
- 9.1.3. Seasonings and Dressings
- 9.1.4. Other Applications
- 9.1. Market Analysis, Insights and Forecast - by Application
- 10. Middle East and Africa MSG Market Analysis, Insights and Forecast, 2019-2031
- 10.1. Market Analysis, Insights and Forecast - by Application
- 10.1.1. Noodles, Soups and Broth
- 10.1.2. Meat Products
- 10.1.3. Seasonings and Dressings
- 10.1.4. Other Applications
- 10.1. Market Analysis, Insights and Forecast - by Application
- 11. North America MSG Market Analysis, Insights and Forecast, 2019-2031
- 11.1. Market Analysis, Insights and Forecast - By Country/Sub-region
- 11.1.1. undefined
- 12. Europe MSG Market Analysis, Insights and Forecast, 2019-2031
- 12.1. Market Analysis, Insights and Forecast - By Country/Sub-region
- 12.1.1. undefined
- 13. Asia Pacific MSG Market Analysis, Insights and Forecast, 2019-2031
- 13.1. Market Analysis, Insights and Forecast - By Country/Sub-region
- 13.1.1. undefined
- 14. South America MSG Market Analysis, Insights and Forecast, 2019-2031
- 14.1. Market Analysis, Insights and Forecast - By Country/Sub-region
- 14.1.1. undefined
- 15. Middle East and Africa MSG Market Analysis, Insights and Forecast, 2019-2031
- 15.1. Market Analysis, Insights and Forecast - By Country/Sub-region
- 15.1.1. undefined
- 16. Competitive Analysis
- 16.1. Global Market Share Analysis 2024
- 16.2. Company Profiles
- 16.2.1 Gremount International Company Limited
- 16.2.1.1. Overview
- 16.2.1.2. Products
- 16.2.1.3. SWOT Analysis
- 16.2.1.4. Recent Developments
- 16.2.1.5. Financials (Based on Availability)
- 16.2.2 Cargill Incorporated
- 16.2.2.1. Overview
- 16.2.2.2. Products
- 16.2.2.3. SWOT Analysis
- 16.2.2.4. Recent Developments
- 16.2.2.5. Financials (Based on Availability)
- 16.2.3 Ningxia Eppen Biotech Co Ltd
- 16.2.3.1. Overview
- 16.2.3.2. Products
- 16.2.3.3. SWOT Analysis
- 16.2.3.4. Recent Developments
- 16.2.3.5. Financials (Based on Availability)
- 16.2.4 Ajinomoto Co Inc
- 16.2.4.1. Overview
- 16.2.4.2. Products
- 16.2.4.3. SWOT Analysis
- 16.2.4.4. Recent Developments
- 16.2.4.5. Financials (Based on Availability)
- 16.2.5 Meihua Holdings Group Co Ltd
- 16.2.5.1. Overview
- 16.2.5.2. Products
- 16.2.5.3. SWOT Analysis
- 16.2.5.4. Recent Developments
- 16.2.5.5. Financials (Based on Availability)
- 16.2.6 Shandong Xinle Monosodium Glutamate Limited Company*List Not Exhaustive
- 16.2.6.1. Overview
- 16.2.6.2. Products
- 16.2.6.3. SWOT Analysis
- 16.2.6.4. Recent Developments
- 16.2.6.5. Financials (Based on Availability)
- 16.2.7 COFCO
- 16.2.7.1. Overview
- 16.2.7.2. Products
- 16.2.7.3. SWOT Analysis
- 16.2.7.4. Recent Developments
- 16.2.7.5. Financials (Based on Availability)
- 16.2.8 Fufeng Group
- 16.2.8.1. Overview
- 16.2.8.2. Products
- 16.2.8.3. SWOT Analysis
- 16.2.8.4. Recent Developments
- 16.2.8.5. Financials (Based on Availability)
- 16.2.9 Shandong Qilu Biotechnology Group Co
- 16.2.9.1. Overview
- 16.2.9.2. Products
- 16.2.9.3. SWOT Analysis
- 16.2.9.4. Recent Developments
- 16.2.9.5. Financials (Based on Availability)
- 16.2.10 Henan Lotus Flower Gourmet Powder Co
- 16.2.10.1. Overview
- 16.2.10.2. Products
- 16.2.10.3. SWOT Analysis
- 16.2.10.4. Recent Developments
- 16.2.10.5. Financials (Based on Availability)
- 16.2.1 Gremount International Company Limited
List of Figures
- Figure 1: Global MSG Market Revenue Breakdown (Million, %) by Region 2024 & 2032
- Figure 2: Global MSG Market Volume Breakdown (K Tons, %) by Region 2024 & 2032
- Figure 3: North America MSG Market Revenue (Million), by Country 2024 & 2032
- Figure 4: North America MSG Market Volume (K Tons), by Country 2024 & 2032
- Figure 5: North America MSG Market Revenue Share (%), by Country 2024 & 2032
- Figure 6: North America MSG Market Volume Share (%), by Country 2024 & 2032
- Figure 7: Europe MSG Market Revenue (Million), by Country 2024 & 2032
- Figure 8: Europe MSG Market Volume (K Tons), by Country 2024 & 2032
- Figure 9: Europe MSG Market Revenue Share (%), by Country 2024 & 2032
- Figure 10: Europe MSG Market Volume Share (%), by Country 2024 & 2032
- Figure 11: Asia Pacific MSG Market Revenue (Million), by Country 2024 & 2032
- Figure 12: Asia Pacific MSG Market Volume (K Tons), by Country 2024 & 2032
- Figure 13: Asia Pacific MSG Market Revenue Share (%), by Country 2024 & 2032
- Figure 14: Asia Pacific MSG Market Volume Share (%), by Country 2024 & 2032
- Figure 15: South America MSG Market Revenue (Million), by Country 2024 & 2032
- Figure 16: South America MSG Market Volume (K Tons), by Country 2024 & 2032
- Figure 17: South America MSG Market Revenue Share (%), by Country 2024 & 2032
- Figure 18: South America MSG Market Volume Share (%), by Country 2024 & 2032
- Figure 19: Middle East and Africa MSG Market Revenue (Million), by Country 2024 & 2032
- Figure 20: Middle East and Africa MSG Market Volume (K Tons), by Country 2024 & 2032
- Figure 21: Middle East and Africa MSG Market Revenue Share (%), by Country 2024 & 2032
- Figure 22: Middle East and Africa MSG Market Volume Share (%), by Country 2024 & 2032
- Figure 23: North America MSG Market Revenue (Million), by Application 2024 & 2032
- Figure 24: North America MSG Market Volume (K Tons), by Application 2024 & 2032
- Figure 25: North America MSG Market Revenue Share (%), by Application 2024 & 2032
- Figure 26: North America MSG Market Volume Share (%), by Application 2024 & 2032
- Figure 27: North America MSG Market Revenue (Million), by Country 2024 & 2032
- Figure 28: North America MSG Market Volume (K Tons), by Country 2024 & 2032
- Figure 29: North America MSG Market Revenue Share (%), by Country 2024 & 2032
- Figure 30: North America MSG Market Volume Share (%), by Country 2024 & 2032
- Figure 31: Europe MSG Market Revenue (Million), by Application 2024 & 2032
- Figure 32: Europe MSG Market Volume (K Tons), by Application 2024 & 2032
- Figure 33: Europe MSG Market Revenue Share (%), by Application 2024 & 2032
- Figure 34: Europe MSG Market Volume Share (%), by Application 2024 & 2032
- Figure 35: Europe MSG Market Revenue (Million), by Country 2024 & 2032
- Figure 36: Europe MSG Market Volume (K Tons), by Country 2024 & 2032
- Figure 37: Europe MSG Market Revenue Share (%), by Country 2024 & 2032
- Figure 38: Europe MSG Market Volume Share (%), by Country 2024 & 2032
- Figure 39: Asia Pacific MSG Market Revenue (Million), by Application 2024 & 2032
- Figure 40: Asia Pacific MSG Market Volume (K Tons), by Application 2024 & 2032
- Figure 41: Asia Pacific MSG Market Revenue Share (%), by Application 2024 & 2032
- Figure 42: Asia Pacific MSG Market Volume Share (%), by Application 2024 & 2032
- Figure 43: Asia Pacific MSG Market Revenue (Million), by Country 2024 & 2032
- Figure 44: Asia Pacific MSG Market Volume (K Tons), by Country 2024 & 2032
- Figure 45: Asia Pacific MSG Market Revenue Share (%), by Country 2024 & 2032
- Figure 46: Asia Pacific MSG Market Volume Share (%), by Country 2024 & 2032
- Figure 47: South America MSG Market Revenue (Million), by Application 2024 & 2032
- Figure 48: South America MSG Market Volume (K Tons), by Application 2024 & 2032
- Figure 49: South America MSG Market Revenue Share (%), by Application 2024 & 2032
- Figure 50: South America MSG Market Volume Share (%), by Application 2024 & 2032
- Figure 51: South America MSG Market Revenue (Million), by Country 2024 & 2032
- Figure 52: South America MSG Market Volume (K Tons), by Country 2024 & 2032
- Figure 53: South America MSG Market Revenue Share (%), by Country 2024 & 2032
- Figure 54: South America MSG Market Volume Share (%), by Country 2024 & 2032
- Figure 55: Middle East and Africa MSG Market Revenue (Million), by Application 2024 & 2032
- Figure 56: Middle East and Africa MSG Market Volume (K Tons), by Application 2024 & 2032
- Figure 57: Middle East and Africa MSG Market Revenue Share (%), by Application 2024 & 2032
- Figure 58: Middle East and Africa MSG Market Volume Share (%), by Application 2024 & 2032
- Figure 59: Middle East and Africa MSG Market Revenue (Million), by Country 2024 & 2032
- Figure 60: Middle East and Africa MSG Market Volume (K Tons), by Country 2024 & 2032
- Figure 61: Middle East and Africa MSG Market Revenue Share (%), by Country 2024 & 2032
- Figure 62: Middle East and Africa MSG Market Volume Share (%), by Country 2024 & 2032
List of Tables
- Table 1: Global MSG Market Revenue Million Forecast, by Region 2019 & 2032
- Table 2: Global MSG Market Volume K Tons Forecast, by Region 2019 & 2032
- Table 3: Global MSG Market Revenue Million Forecast, by Application 2019 & 2032
- Table 4: Global MSG Market Volume K Tons Forecast, by Application 2019 & 2032
- Table 5: Global MSG Market Revenue Million Forecast, by Region 2019 & 2032
- Table 6: Global MSG Market Volume K Tons Forecast, by Region 2019 & 2032
- Table 7: Global MSG Market Revenue Million Forecast, by Country 2019 & 2032
- Table 8: Global MSG Market Volume K Tons Forecast, by Country 2019 & 2032
- Table 9: Global MSG Market Revenue Million Forecast, by Country 2019 & 2032
- Table 10: Global MSG Market Volume K Tons Forecast, by Country 2019 & 2032
- Table 11: Global MSG Market Revenue Million Forecast, by Country 2019 & 2032
- Table 12: Global MSG Market Volume K Tons Forecast, by Country 2019 & 2032
- Table 13: Global MSG Market Revenue Million Forecast, by Country 2019 & 2032
- Table 14: Global MSG Market Volume K Tons Forecast, by Country 2019 & 2032
- Table 15: Global MSG Market Revenue Million Forecast, by Country 2019 & 2032
- Table 16: Global MSG Market Volume K Tons Forecast, by Country 2019 & 2032
- Table 17: Global MSG Market Revenue Million Forecast, by Application 2019 & 2032
- Table 18: Global MSG Market Volume K Tons Forecast, by Application 2019 & 2032
- Table 19: Global MSG Market Revenue Million Forecast, by Country 2019 & 2032
- Table 20: Global MSG Market Volume K Tons Forecast, by Country 2019 & 2032
- Table 21: United States MSG Market Revenue (Million) Forecast, by Application 2019 & 2032
- Table 22: United States MSG Market Volume (K Tons) Forecast, by Application 2019 & 2032
- Table 23: Canada MSG Market Revenue (Million) Forecast, by Application 2019 & 2032
- Table 24: Canada MSG Market Volume (K Tons) Forecast, by Application 2019 & 2032
- Table 25: Mexico MSG Market Revenue (Million) Forecast, by Application 2019 & 2032
- Table 26: Mexico MSG Market Volume (K Tons) Forecast, by Application 2019 & 2032
- Table 27: Rest of North America MSG Market Revenue (Million) Forecast, by Application 2019 & 2032
- Table 28: Rest of North America MSG Market Volume (K Tons) Forecast, by Application 2019 & 2032
- Table 29: Global MSG Market Revenue Million Forecast, by Application 2019 & 2032
- Table 30: Global MSG Market Volume K Tons Forecast, by Application 2019 & 2032
- Table 31: Global MSG Market Revenue Million Forecast, by Country 2019 & 2032
- Table 32: Global MSG Market Volume K Tons Forecast, by Country 2019 & 2032
- Table 33: Germany MSG Market Revenue (Million) Forecast, by Application 2019 & 2032
- Table 34: Germany MSG Market Volume (K Tons) Forecast, by Application 2019 & 2032
- Table 35: United Kingdom MSG Market Revenue (Million) Forecast, by Application 2019 & 2032
- Table 36: United Kingdom MSG Market Volume (K Tons) Forecast, by Application 2019 & 2032
- Table 37: France MSG Market Revenue (Million) Forecast, by Application 2019 & 2032
- Table 38: France MSG Market Volume (K Tons) Forecast, by Application 2019 & 2032
- Table 39: Russia MSG Market Revenue (Million) Forecast, by Application 2019 & 2032
- Table 40: Russia MSG Market Volume (K Tons) Forecast, by Application 2019 & 2032
- Table 41: Rest of Europe MSG Market Revenue (Million) Forecast, by Application 2019 & 2032
- Table 42: Rest of Europe MSG Market Volume (K Tons) Forecast, by Application 2019 & 2032
- Table 43: Global MSG Market Revenue Million Forecast, by Application 2019 & 2032
- Table 44: Global MSG Market Volume K Tons Forecast, by Application 2019 & 2032
- Table 45: Global MSG Market Revenue Million Forecast, by Country 2019 & 2032
- Table 46: Global MSG Market Volume K Tons Forecast, by Country 2019 & 2032
- Table 47: China MSG Market Revenue (Million) Forecast, by Application 2019 & 2032
- Table 48: China MSG Market Volume (K Tons) Forecast, by Application 2019 & 2032
- Table 49: Japan MSG Market Revenue (Million) Forecast, by Application 2019 & 2032
- Table 50: Japan MSG Market Volume (K Tons) Forecast, by Application 2019 & 2032
- Table 51: India MSG Market Revenue (Million) Forecast, by Application 2019 & 2032
- Table 52: India MSG Market Volume (K Tons) Forecast, by Application 2019 & 2032
- Table 53: Australia MSG Market Revenue (Million) Forecast, by Application 2019 & 2032
- Table 54: Australia MSG Market Volume (K Tons) Forecast, by Application 2019 & 2032
- Table 55: Rest of Asia Pacific MSG Market Revenue (Million) Forecast, by Application 2019 & 2032
- Table 56: Rest of Asia Pacific MSG Market Volume (K Tons) Forecast, by Application 2019 & 2032
- Table 57: Global MSG Market Revenue Million Forecast, by Application 2019 & 2032
- Table 58: Global MSG Market Volume K Tons Forecast, by Application 2019 & 2032
- Table 59: Global MSG Market Revenue Million Forecast, by Country 2019 & 2032
- Table 60: Global MSG Market Volume K Tons Forecast, by Country 2019 & 2032
- Table 61: Brazil MSG Market Revenue (Million) Forecast, by Application 2019 & 2032
- Table 62: Brazil MSG Market Volume (K Tons) Forecast, by Application 2019 & 2032
- Table 63: Argentina MSG Market Revenue (Million) Forecast, by Application 2019 & 2032
- Table 64: Argentina MSG Market Volume (K Tons) Forecast, by Application 2019 & 2032
- Table 65: Rest of South America MSG Market Revenue (Million) Forecast, by Application 2019 & 2032
- Table 66: Rest of South America MSG Market Volume (K Tons) Forecast, by Application 2019 & 2032
- Table 67: Global MSG Market Revenue Million Forecast, by Application 2019 & 2032
- Table 68: Global MSG Market Volume K Tons Forecast, by Application 2019 & 2032
- Table 69: Global MSG Market Revenue Million Forecast, by Country 2019 & 2032
- Table 70: Global MSG Market Volume K Tons Forecast, by Country 2019 & 2032
- Table 71: South Africa MSG Market Revenue (Million) Forecast, by Application 2019 & 2032
- Table 72: South Africa MSG Market Volume (K Tons) Forecast, by Application 2019 & 2032
- Table 73: United Arab Emirates MSG Market Revenue (Million) Forecast, by Application 2019 & 2032
- Table 74: United Arab Emirates MSG Market Volume (K Tons) Forecast, by Application 2019 & 2032
- Table 75: Rest of Middle East and Africa MSG Market Revenue (Million) Forecast, by Application 2019 & 2032
- Table 76: Rest of Middle East and Africa MSG Market Volume (K Tons) Forecast, by Application 2019 & 2032
Frequently Asked Questions
1. What is the projected Compound Annual Growth Rate (CAGR) of the MSG Market?
The projected CAGR is approximately 4.01%.
2. Which companies are prominent players in the MSG Market?
Key companies in the market include Gremount International Company Limited, Cargill Incorporated, Ningxia Eppen Biotech Co Ltd, Ajinomoto Co Inc, Meihua Holdings Group Co Ltd, Shandong Xinle Monosodium Glutamate Limited Company*List Not Exhaustive, COFCO, Fufeng Group, Shandong Qilu Biotechnology Group Co, Henan Lotus Flower Gourmet Powder Co.
3. What are the main segments of the MSG Market?
The market segments include Application.
4. Can you provide details about the market size?
The market size is estimated to be USD 6.15 Million as of 2022.
5. What are some drivers contributing to market growth?
Consumer inclination toward functional food and beverages; Increasing Number of Applications and Growing Industrial Use.
6. What are the notable trends driving market growth?
Rising Demand for Ready -To-Eat and Processed Food.
7. Are there any restraints impacting market growth?
Increasing Shift Toward Plant-Based Protein.
8. Can you provide examples of recent developments in the market?
N/A
9. What pricing options are available for accessing the report?
Pricing options include single-user, multi-user, and enterprise licenses priced at USD 4750, USD 5250, and USD 8750 respectively.
10. Is the market size provided in terms of value or volume?
The market size is provided in terms of value, measured in Million and volume, measured in K Tons.
11. Are there any specific market keywords associated with the report?
Yes, the market keyword associated with the report is "MSG Market," which aids in identifying and referencing the specific market segment covered.
12. How do I determine which pricing option suits my needs best?
The pricing options vary based on user requirements and access needs. Individual users may opt for single-user licenses, while businesses requiring broader access may choose multi-user or enterprise licenses for cost-effective access to the report.
13. Are there any additional resources or data provided in the MSG Market report?
While the report offers comprehensive insights, it's advisable to review the specific contents or supplementary materials provided to ascertain if additional resources or data are available.
14. How can I stay updated on further developments or reports in the MSG Market?
To stay informed about further developments, trends, and reports in the MSG Market, consider subscribing to industry newsletters, following relevant companies and organizations, or regularly checking reputable industry news sources and publications.
Methodology
Step 1 - Identification of Relevant Samples Size from Population Database


Step 2 - Approaches for Defining Global Market Size (Value, Volume* & Price*)

Note*: In applicable scenarios
Step 3 - Data Sources
Primary Research
- Web Analytics
- Survey Reports
- Research Institute
- Latest Research Reports
- Opinion Leaders
Secondary Research
- Annual Reports
- White Paper
- Latest Press Release
- Industry Association
- Paid Database
- Investor Presentations

Step 4 - Data Triangulation
Involves using different sources of information in order to increase the validity of a study
These sources are likely to be stakeholders in a program - participants, other researchers, program staff, other community members, and so on.
Then we put all data in single framework & apply various statistical tools to find out the dynamic on the market.
During the analysis stage, feedback from the stakeholder groups would be compared to determine areas of agreement as well as areas of divergence
