

Key Insights
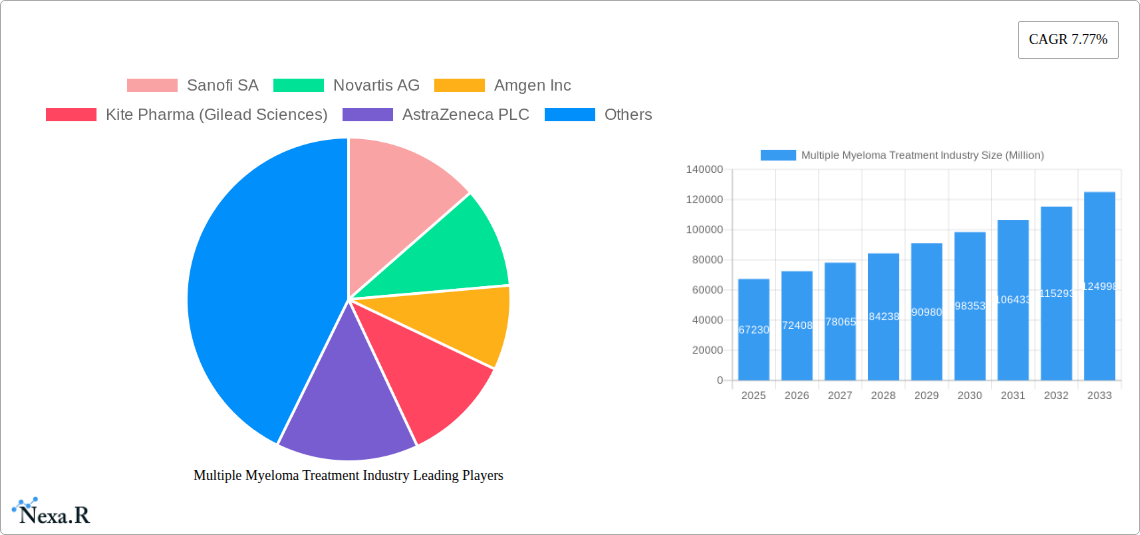
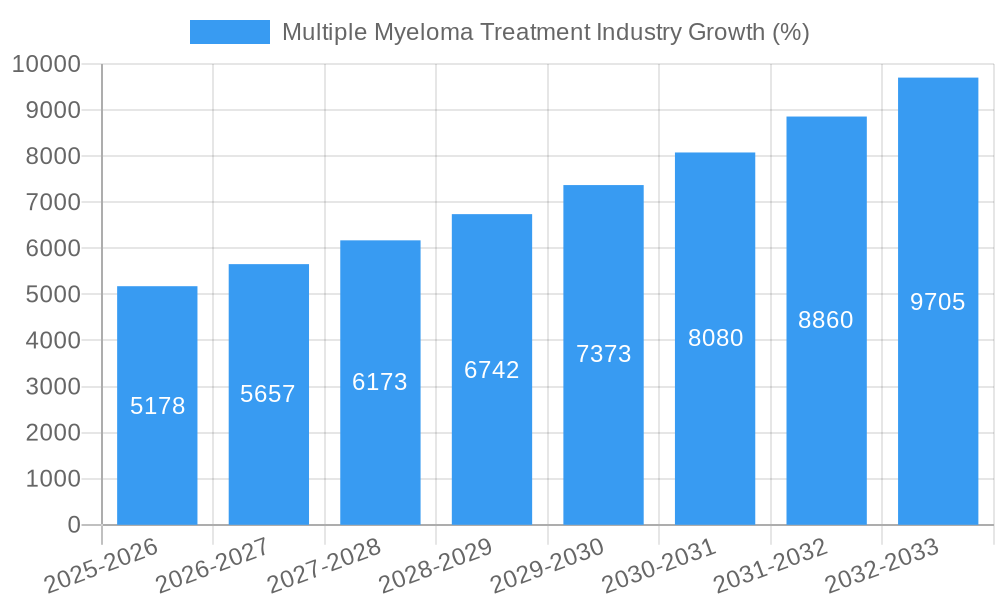
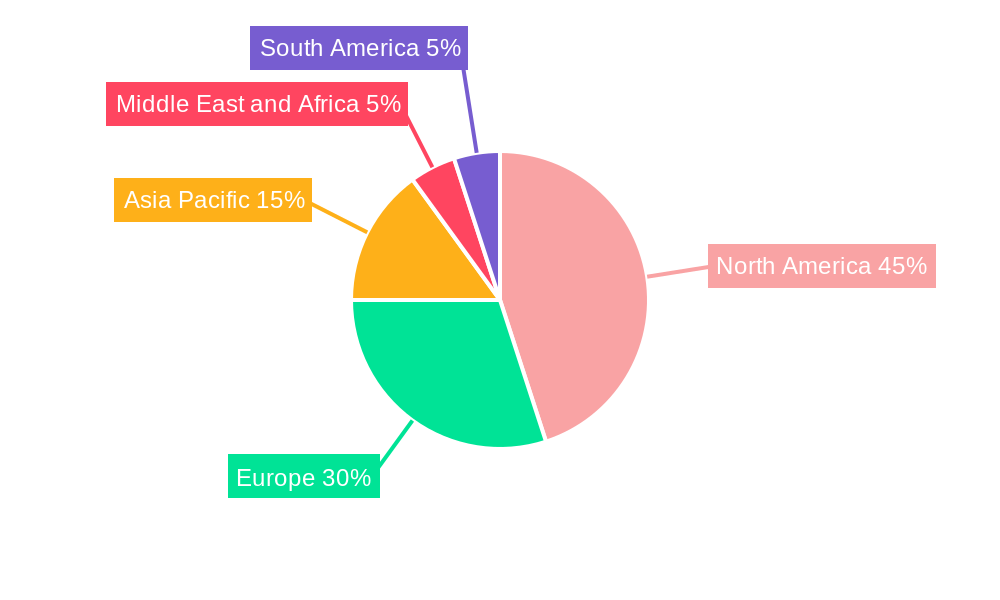
The global multiple myeloma treatment market, a segment within the broader hematological malignancy market, is experiencing robust growth. With a 2025 market size of $67.23 billion and a projected Compound Annual Growth Rate (CAGR) of 7.77% from 2025 to 2033, the market is poised for significant expansion. This growth is driven by several key factors. Increasing prevalence of multiple myeloma, particularly among older populations, fuels demand for effective treatments. Advancements in therapeutic modalities, such as targeted therapies and immunotherapies (including CAR T-cell therapy and bispecific antibodies), offer improved efficacy and survival rates, thereby driving market expansion. The rising geriatric population globally, coupled with increased healthcare spending and improved diagnostic capabilities, further contributes to this positive market trajectory. While the high cost of novel therapies presents a restraint, the overall benefit and increased survival rates outweigh the cost for many patients and healthcare systems. The market is segmented by disease condition (multiple myeloma, specifically), therapy type (chemotherapy, immunotherapy, targeted therapy, and other therapies), and end-user (hospital pharmacies, medical stores, and e-commerce platforms). North America currently holds a significant market share, owing to high healthcare expenditure and the presence of major pharmaceutical companies. However, Asia Pacific is projected to witness substantial growth in the forecast period, driven by rising healthcare infrastructure development and increasing awareness of multiple myeloma.
The competitive landscape is highly concentrated, with several major pharmaceutical companies dominating the market. These include Sanofi SA, Novartis AG, Amgen Inc, Gilead Sciences (through Kite Pharma), AstraZeneca PLC, Roche, AbbVie Inc, Incyte Corporation, Johnson & Johnson, Bristol-Myers Squibb Company, and others. These companies are actively engaged in research and development, focusing on innovative treatment approaches to improve patient outcomes and maintain their market share. Intense competition fosters continuous innovation and the introduction of new therapies, further fueling market expansion. The market is anticipated to witness further consolidation through mergers and acquisitions, partnerships, and licensing agreements, as companies strive to enhance their product portfolios and expand their global reach. The long-term outlook for the multiple myeloma treatment market remains positive, with sustained growth expected over the forecast period fueled by ongoing scientific advancements and an expanding patient population.
Multiple Myeloma Treatment Industry Market Report: 2019-2033
This comprehensive report provides a detailed analysis of the Multiple Myeloma Treatment industry, encompassing market dynamics, growth trends, key players, and future outlook. With a focus on the parent market (oncology treatment) and child market (multiple myeloma treatment), this report offers invaluable insights for industry professionals, investors, and strategic decision-makers. The study period covers 2019-2033, with 2025 as the base and estimated year. The forecast period spans 2025-2033, and the historical period includes 2019-2024. The market size is presented in million units.
Multiple Myeloma Treatment Industry Market Dynamics & Structure
The Multiple Myeloma Treatment market is characterized by a moderately concentrated landscape, with key players like Sanofi SA, Novartis AG, and Amgen Inc. holding significant market share. Technological innovation, particularly in immunotherapy and targeted therapies, is a major growth driver. Stringent regulatory frameworks, including FDA approvals, influence market access and product launches. Competitive pressures stem from the availability of substitute therapies and ongoing research and development efforts. The end-user demographic primarily comprises hospitals and specialized clinics. Mergers and acquisitions (M&A) activity remains significant, driving consolidation and expansion within the industry. The total M&A deal volume for the period 2019-2024 was approximately xx million.
- Market Concentration: Moderately concentrated, with top 5 players holding approximately xx% market share (2024).
- Technological Innovation: Focus on immunotherapy, targeted therapy, and CAR T-cell therapies.
- Regulatory Landscape: Stringent FDA approvals and pricing regulations impact market entry.
- Competitive Substitutes: Availability of alternative treatments creates competitive pressure.
- End-User Demographics: Hospital pharmacies and specialized oncology clinics are primary end-users.
- M&A Activity: Significant M&A activity in the period 2019-2024, driven by expansion and diversification strategies.
Multiple Myeloma Treatment Industry Growth Trends & Insights
The Multiple Myeloma Treatment market experienced robust growth during the historical period (2019-2024), driven by increasing prevalence of multiple myeloma, advancements in treatment modalities, and rising healthcare expenditure. The market size in 2024 was approximately xx million units. The adoption rate of novel therapies, such as immunotherapy, has increased significantly. Technological advancements in targeted therapies and personalized medicine are further accelerating market growth. Shifting consumer preferences towards less toxic and more effective treatments are shaping market dynamics. The Compound Annual Growth Rate (CAGR) for the period 2019-2024 was xx%, and a projected CAGR of xx% is expected for 2025-2033. Market penetration of novel therapies is projected to reach xx% by 2033. Further analysis using XXX will provide a more in-depth understanding of market size evolution and adoption rates across different segments.
Dominant Regions, Countries, or Segments in Multiple Myeloma Treatment Industry
North America currently dominates the Multiple Myeloma Treatment market, driven by high healthcare expenditure, advanced healthcare infrastructure, and a large patient pool. Within this region, the United States holds the largest market share. Europe follows as the second largest market, with significant growth potential in emerging economies. By Disease Condition, Myeloma represents the largest segment, followed by Lymphoma and Leukemia. In terms of therapy, Immunotherapy is experiencing rapid growth, surpassing Chemotherapy in market share. Hospital pharmacies are the dominant end-user segment.
- Key Drivers (North America): High healthcare expenditure, advanced healthcare infrastructure, strong regulatory support.
- Key Drivers (Europe): Growing awareness, increasing healthcare expenditure in some countries.
- Myeloma Segment Dominance: High prevalence of multiple myeloma globally.
- Immunotherapy Growth: Effectiveness and increasing adoption rates of immunotherapy.
- Hospital Pharmacies Dominance: Primary point of dispensing for multiple myeloma treatments.
Multiple Myeloma Treatment Industry Product Landscape
The Multiple Myeloma Treatment market features a diverse range of products, including chemotherapy drugs, immunotherapies (e.g., monoclonal antibodies), targeted therapies, and other supportive care medications. Product innovations are focused on improving efficacy, reducing toxicity, and enhancing patient convenience. Key performance metrics include response rates, progression-free survival, and overall survival. Unique selling propositions frequently center around improved efficacy, reduced side effects, or targeted mechanisms of action. Technological advancements such as CAR T-cell therapies represent a significant frontier in treatment development.
Key Drivers, Barriers & Challenges in Multiple Myeloma Treatment Industry
Key Drivers:
- Increasing prevalence of multiple myeloma.
- Advancements in targeted therapies and immunotherapies.
- Rising healthcare expenditure globally.
- Growing awareness and patient advocacy.
Challenges & Restraints:
- High cost of treatment limiting accessibility in certain regions. (Impact: xx% reduction in market potential)
- Stringent regulatory approvals prolonging time to market. (Impact: xx months delay in new drug launches)
- Competition from existing therapies and emerging treatment modalities. (Impact: xx% reduction in market share for some established therapies)
- Supply chain disruptions impacting drug availability. (Impact: xx% increase in drug prices)
Emerging Opportunities in Multiple Myeloma Treatment Industry
- Growing interest in personalized medicine approaches.
- Development of novel combination therapies.
- Expansion into emerging markets with unmet medical needs.
- Focus on improving patient outcomes and quality of life.
Growth Accelerators in the Multiple Myeloma Treatment Industry
Technological breakthroughs in immunotherapy and targeted therapies are significant drivers of long-term growth. Strategic partnerships between pharmaceutical companies and biotech firms are fostering innovation. Market expansion strategies, including the development of novel treatment approaches and access in emerging markets, are crucial for sustained growth.
Key Players Shaping the Multiple Myeloma Treatment Market
- Sanofi SA
- Novartis AG
- Amgen Inc
- Kite Pharma (Gilead Sciences)
- AstraZeneca PLC
- F Hoffmann-LA Roche Ltd
- Atara Biotherapeutics
- AbbVie Inc
- Incyte Corporation
- Johnson & Johnson
- Bristol-Myers Squibb Company
- Celldex Therapeutics Inc
- GlaxoSmithKline PLC
- Takeda Pharmaceutical Co Ltd
- Pfizer Inc
Notable Milestones in Multiple Myeloma Treatment Industry Sector
- March 2021: Sanofi SA received US FDA approval for Sarclisa (isatuximab).
- February 2021: TG Therapeutics Inc. received US FDA accelerated approval for UKONIQ (umbralisib).
In-Depth Multiple Myeloma Treatment Industry Market Outlook
The Multiple Myeloma Treatment market is poised for continued growth, driven by ongoing innovation in treatment modalities, expanding patient populations, and increasing healthcare investment. Strategic partnerships and investments in research and development will play a critical role in shaping future market dynamics. The focus on personalized medicine and improved access to therapies in emerging markets will create significant opportunities for market expansion and growth.
Multiple Myeloma Treatment Industry Segmentation
-
1. Disease Condition
- 1.1. Leukemia
- 1.2. Lymphoma
- 1.3. Myeloma
-
2. Therapy
- 2.1. Chemotherapy
- 2.2. Immunotherapy
- 2.3. Targeted Therapy
- 2.4. Other Therapies
-
3. End User
- 3.1. Hospital Pharmacies
- 3.2. Medical Stores
- 3.3. E-commerce Platforms
Multiple Myeloma Treatment Industry Segmentation By Geography
-
1. North America
- 1.1. United States
- 1.2. Canada
- 1.3. Mexico
-
2. Europe
- 2.1. Germany
- 2.2. United Kingdom
- 2.3. France
- 2.4. Italy
- 2.5. Spain
- 2.6. Rest of Europe
-
3. Asia Pacific
- 3.1. China
- 3.2. Japan
- 3.3. India
- 3.4. Australia
- 3.5. South Korea
- 3.6. Rest of Asia Pacific
-
4. Middle East and Africa
- 4.1. GCC
- 4.2. South Africa
- 4.3. Rest of Middle East and Africa
-
5. South America
- 5.1. Brazil
- 5.2. Argentina
- 5.3. Rest of South America
Multiple Myeloma Treatment Industry REPORT HIGHLIGHTS
| Aspects | Details |
|---|---|
| Study Period | 2019-2033 |
| Base Year | 2024 |
| Estimated Year | 2025 |
| Forecast Period | 2025-2033 |
| Historical Period | 2019-2024 |
| Growth Rate | CAGR of 7.77% from 2019-2033 |
| Segmentation |
|
Table of Contents
- 1. Introduction
- 1.1. Research Scope
- 1.2. Market Segmentation
- 1.3. Research Methodology
- 1.4. Definitions and Assumptions
- 2. Executive Summary
- 2.1. Introduction
- 3. Market Dynamics
- 3.1. Introduction
- 3.2. Market Drivers
- 3.2.1. Growing Incidence of Blood Cancer; Increasing Awareness about the Possibility of Early Diagnosis; Increasing Emphasis on Development of New Treatments
- 3.3. Market Restrains
- 3.3.1. High Cost of Medication
- 3.4. Market Trends
- 3.4.1 Chemotherapy Leads the Segment
- 3.4.2 and it is Expected to Witness a Healthy Growth Over the Forecast Period
- 4. Market Factor Analysis
- 4.1. Porters Five Forces
- 4.2. Supply/Value Chain
- 4.3. PESTEL analysis
- 4.4. Market Entropy
- 4.5. Patent/Trademark Analysis
- 5. Global Multiple Myeloma Treatment Industry Analysis, Insights and Forecast, 2019-2031
- 5.1. Market Analysis, Insights and Forecast - by Disease Condition
- 5.1.1. Leukemia
- 5.1.2. Lymphoma
- 5.1.3. Myeloma
- 5.2. Market Analysis, Insights and Forecast - by Therapy
- 5.2.1. Chemotherapy
- 5.2.2. Immunotherapy
- 5.2.3. Targeted Therapy
- 5.2.4. Other Therapies
- 5.3. Market Analysis, Insights and Forecast - by End User
- 5.3.1. Hospital Pharmacies
- 5.3.2. Medical Stores
- 5.3.3. E-commerce Platforms
- 5.4. Market Analysis, Insights and Forecast - by Region
- 5.4.1. North America
- 5.4.2. Europe
- 5.4.3. Asia Pacific
- 5.4.4. Middle East and Africa
- 5.4.5. South America
- 5.1. Market Analysis, Insights and Forecast - by Disease Condition
- 6. North America Multiple Myeloma Treatment Industry Analysis, Insights and Forecast, 2019-2031
- 6.1. Market Analysis, Insights and Forecast - by Disease Condition
- 6.1.1. Leukemia
- 6.1.2. Lymphoma
- 6.1.3. Myeloma
- 6.2. Market Analysis, Insights and Forecast - by Therapy
- 6.2.1. Chemotherapy
- 6.2.2. Immunotherapy
- 6.2.3. Targeted Therapy
- 6.2.4. Other Therapies
- 6.3. Market Analysis, Insights and Forecast - by End User
- 6.3.1. Hospital Pharmacies
- 6.3.2. Medical Stores
- 6.3.3. E-commerce Platforms
- 6.1. Market Analysis, Insights and Forecast - by Disease Condition
- 7. Europe Multiple Myeloma Treatment Industry Analysis, Insights and Forecast, 2019-2031
- 7.1. Market Analysis, Insights and Forecast - by Disease Condition
- 7.1.1. Leukemia
- 7.1.2. Lymphoma
- 7.1.3. Myeloma
- 7.2. Market Analysis, Insights and Forecast - by Therapy
- 7.2.1. Chemotherapy
- 7.2.2. Immunotherapy
- 7.2.3. Targeted Therapy
- 7.2.4. Other Therapies
- 7.3. Market Analysis, Insights and Forecast - by End User
- 7.3.1. Hospital Pharmacies
- 7.3.2. Medical Stores
- 7.3.3. E-commerce Platforms
- 7.1. Market Analysis, Insights and Forecast - by Disease Condition
- 8. Asia Pacific Multiple Myeloma Treatment Industry Analysis, Insights and Forecast, 2019-2031
- 8.1. Market Analysis, Insights and Forecast - by Disease Condition
- 8.1.1. Leukemia
- 8.1.2. Lymphoma
- 8.1.3. Myeloma
- 8.2. Market Analysis, Insights and Forecast - by Therapy
- 8.2.1. Chemotherapy
- 8.2.2. Immunotherapy
- 8.2.3. Targeted Therapy
- 8.2.4. Other Therapies
- 8.3. Market Analysis, Insights and Forecast - by End User
- 8.3.1. Hospital Pharmacies
- 8.3.2. Medical Stores
- 8.3.3. E-commerce Platforms
- 8.1. Market Analysis, Insights and Forecast - by Disease Condition
- 9. Middle East and Africa Multiple Myeloma Treatment Industry Analysis, Insights and Forecast, 2019-2031
- 9.1. Market Analysis, Insights and Forecast - by Disease Condition
- 9.1.1. Leukemia
- 9.1.2. Lymphoma
- 9.1.3. Myeloma
- 9.2. Market Analysis, Insights and Forecast - by Therapy
- 9.2.1. Chemotherapy
- 9.2.2. Immunotherapy
- 9.2.3. Targeted Therapy
- 9.2.4. Other Therapies
- 9.3. Market Analysis, Insights and Forecast - by End User
- 9.3.1. Hospital Pharmacies
- 9.3.2. Medical Stores
- 9.3.3. E-commerce Platforms
- 9.1. Market Analysis, Insights and Forecast - by Disease Condition
- 10. South America Multiple Myeloma Treatment Industry Analysis, Insights and Forecast, 2019-2031
- 10.1. Market Analysis, Insights and Forecast - by Disease Condition
- 10.1.1. Leukemia
- 10.1.2. Lymphoma
- 10.1.3. Myeloma
- 10.2. Market Analysis, Insights and Forecast - by Therapy
- 10.2.1. Chemotherapy
- 10.2.2. Immunotherapy
- 10.2.3. Targeted Therapy
- 10.2.4. Other Therapies
- 10.3. Market Analysis, Insights and Forecast - by End User
- 10.3.1. Hospital Pharmacies
- 10.3.2. Medical Stores
- 10.3.3. E-commerce Platforms
- 10.1. Market Analysis, Insights and Forecast - by Disease Condition
- 11. North America Multiple Myeloma Treatment Industry Analysis, Insights and Forecast, 2019-2031
- 11.1. Market Analysis, Insights and Forecast - By Country/Sub-region
- 11.1.1 United States
- 11.1.2 Canada
- 11.1.3 Mexico
- 12. Europe Multiple Myeloma Treatment Industry Analysis, Insights and Forecast, 2019-2031
- 12.1. Market Analysis, Insights and Forecast - By Country/Sub-region
- 12.1.1 Germany
- 12.1.2 United Kingdom
- 12.1.3 France
- 12.1.4 Italy
- 12.1.5 Spain
- 12.1.6 Rest of Europe
- 13. Asia Pacific Multiple Myeloma Treatment Industry Analysis, Insights and Forecast, 2019-2031
- 13.1. Market Analysis, Insights and Forecast - By Country/Sub-region
- 13.1.1 China
- 13.1.2 Japan
- 13.1.3 India
- 13.1.4 Australia
- 13.1.5 South Korea
- 13.1.6 Rest of Asia Pacific
- 14. Middle East and Africa Multiple Myeloma Treatment Industry Analysis, Insights and Forecast, 2019-2031
- 14.1. Market Analysis, Insights and Forecast - By Country/Sub-region
- 14.1.1 GCC
- 14.1.2 South Africa
- 14.1.3 Rest of Middle East and Africa
- 15. South America Multiple Myeloma Treatment Industry Analysis, Insights and Forecast, 2019-2031
- 15.1. Market Analysis, Insights and Forecast - By Country/Sub-region
- 15.1.1 Brazil
- 15.1.2 Argentina
- 15.1.3 Rest of South America
- 16. Competitive Analysis
- 16.1. Global Market Share Analysis 2024
- 16.2. Company Profiles
- 16.2.1 Sanofi SA
- 16.2.1.1. Overview
- 16.2.1.2. Products
- 16.2.1.3. SWOT Analysis
- 16.2.1.4. Recent Developments
- 16.2.1.5. Financials (Based on Availability)
- 16.2.2 Novartis AG
- 16.2.2.1. Overview
- 16.2.2.2. Products
- 16.2.2.3. SWOT Analysis
- 16.2.2.4. Recent Developments
- 16.2.2.5. Financials (Based on Availability)
- 16.2.3 Amgen Inc
- 16.2.3.1. Overview
- 16.2.3.2. Products
- 16.2.3.3. SWOT Analysis
- 16.2.3.4. Recent Developments
- 16.2.3.5. Financials (Based on Availability)
- 16.2.4 Kite Pharma (Gilead Sciences)
- 16.2.4.1. Overview
- 16.2.4.2. Products
- 16.2.4.3. SWOT Analysis
- 16.2.4.4. Recent Developments
- 16.2.4.5. Financials (Based on Availability)
- 16.2.5 AstraZeneca PLC
- 16.2.5.1. Overview
- 16.2.5.2. Products
- 16.2.5.3. SWOT Analysis
- 16.2.5.4. Recent Developments
- 16.2.5.5. Financials (Based on Availability)
- 16.2.6 F Hoffmann-LA Roche Ltd
- 16.2.6.1. Overview
- 16.2.6.2. Products
- 16.2.6.3. SWOT Analysis
- 16.2.6.4. Recent Developments
- 16.2.6.5. Financials (Based on Availability)
- 16.2.7 Atara Biotherapeutics
- 16.2.7.1. Overview
- 16.2.7.2. Products
- 16.2.7.3. SWOT Analysis
- 16.2.7.4. Recent Developments
- 16.2.7.5. Financials (Based on Availability)
- 16.2.8 AbbVie Inc
- 16.2.8.1. Overview
- 16.2.8.2. Products
- 16.2.8.3. SWOT Analysis
- 16.2.8.4. Recent Developments
- 16.2.8.5. Financials (Based on Availability)
- 16.2.9 Incyte Corporation
- 16.2.9.1. Overview
- 16.2.9.2. Products
- 16.2.9.3. SWOT Analysis
- 16.2.9.4. Recent Developments
- 16.2.9.5. Financials (Based on Availability)
- 16.2.10 Johnson & Johnson
- 16.2.10.1. Overview
- 16.2.10.2. Products
- 16.2.10.3. SWOT Analysis
- 16.2.10.4. Recent Developments
- 16.2.10.5. Financials (Based on Availability)
- 16.2.11 Bristol-Myers Squibb Company
- 16.2.11.1. Overview
- 16.2.11.2. Products
- 16.2.11.3. SWOT Analysis
- 16.2.11.4. Recent Developments
- 16.2.11.5. Financials (Based on Availability)
- 16.2.12 Celldex Therapeutics Inc
- 16.2.12.1. Overview
- 16.2.12.2. Products
- 16.2.12.3. SWOT Analysis
- 16.2.12.4. Recent Developments
- 16.2.12.5. Financials (Based on Availability)
- 16.2.13 GlaxoSmithKline PLC
- 16.2.13.1. Overview
- 16.2.13.2. Products
- 16.2.13.3. SWOT Analysis
- 16.2.13.4. Recent Developments
- 16.2.13.5. Financials (Based on Availability)
- 16.2.14 Takeda Pharmaceutical Co Ltd
- 16.2.14.1. Overview
- 16.2.14.2. Products
- 16.2.14.3. SWOT Analysis
- 16.2.14.4. Recent Developments
- 16.2.14.5. Financials (Based on Availability)
- 16.2.15 Pfizer Inc
- 16.2.15.1. Overview
- 16.2.15.2. Products
- 16.2.15.3. SWOT Analysis
- 16.2.15.4. Recent Developments
- 16.2.15.5. Financials (Based on Availability)
- 16.2.1 Sanofi SA
List of Figures
- Figure 1: Global Multiple Myeloma Treatment Industry Revenue Breakdown (Million, %) by Region 2024 & 2032
- Figure 2: Global Multiple Myeloma Treatment Industry Volume Breakdown (K Unit, %) by Region 2024 & 2032
- Figure 3: North America Multiple Myeloma Treatment Industry Revenue (Million), by Country 2024 & 2032
- Figure 4: North America Multiple Myeloma Treatment Industry Volume (K Unit), by Country 2024 & 2032
- Figure 5: North America Multiple Myeloma Treatment Industry Revenue Share (%), by Country 2024 & 2032
- Figure 6: North America Multiple Myeloma Treatment Industry Volume Share (%), by Country 2024 & 2032
- Figure 7: Europe Multiple Myeloma Treatment Industry Revenue (Million), by Country 2024 & 2032
- Figure 8: Europe Multiple Myeloma Treatment Industry Volume (K Unit), by Country 2024 & 2032
- Figure 9: Europe Multiple Myeloma Treatment Industry Revenue Share (%), by Country 2024 & 2032
- Figure 10: Europe Multiple Myeloma Treatment Industry Volume Share (%), by Country 2024 & 2032
- Figure 11: Asia Pacific Multiple Myeloma Treatment Industry Revenue (Million), by Country 2024 & 2032
- Figure 12: Asia Pacific Multiple Myeloma Treatment Industry Volume (K Unit), by Country 2024 & 2032
- Figure 13: Asia Pacific Multiple Myeloma Treatment Industry Revenue Share (%), by Country 2024 & 2032
- Figure 14: Asia Pacific Multiple Myeloma Treatment Industry Volume Share (%), by Country 2024 & 2032
- Figure 15: Middle East and Africa Multiple Myeloma Treatment Industry Revenue (Million), by Country 2024 & 2032
- Figure 16: Middle East and Africa Multiple Myeloma Treatment Industry Volume (K Unit), by Country 2024 & 2032
- Figure 17: Middle East and Africa Multiple Myeloma Treatment Industry Revenue Share (%), by Country 2024 & 2032
- Figure 18: Middle East and Africa Multiple Myeloma Treatment Industry Volume Share (%), by Country 2024 & 2032
- Figure 19: South America Multiple Myeloma Treatment Industry Revenue (Million), by Country 2024 & 2032
- Figure 20: South America Multiple Myeloma Treatment Industry Volume (K Unit), by Country 2024 & 2032
- Figure 21: South America Multiple Myeloma Treatment Industry Revenue Share (%), by Country 2024 & 2032
- Figure 22: South America Multiple Myeloma Treatment Industry Volume Share (%), by Country 2024 & 2032
- Figure 23: North America Multiple Myeloma Treatment Industry Revenue (Million), by Disease Condition 2024 & 2032
- Figure 24: North America Multiple Myeloma Treatment Industry Volume (K Unit), by Disease Condition 2024 & 2032
- Figure 25: North America Multiple Myeloma Treatment Industry Revenue Share (%), by Disease Condition 2024 & 2032
- Figure 26: North America Multiple Myeloma Treatment Industry Volume Share (%), by Disease Condition 2024 & 2032
- Figure 27: North America Multiple Myeloma Treatment Industry Revenue (Million), by Therapy 2024 & 2032
- Figure 28: North America Multiple Myeloma Treatment Industry Volume (K Unit), by Therapy 2024 & 2032
- Figure 29: North America Multiple Myeloma Treatment Industry Revenue Share (%), by Therapy 2024 & 2032
- Figure 30: North America Multiple Myeloma Treatment Industry Volume Share (%), by Therapy 2024 & 2032
- Figure 31: North America Multiple Myeloma Treatment Industry Revenue (Million), by End User 2024 & 2032
- Figure 32: North America Multiple Myeloma Treatment Industry Volume (K Unit), by End User 2024 & 2032
- Figure 33: North America Multiple Myeloma Treatment Industry Revenue Share (%), by End User 2024 & 2032
- Figure 34: North America Multiple Myeloma Treatment Industry Volume Share (%), by End User 2024 & 2032
- Figure 35: North America Multiple Myeloma Treatment Industry Revenue (Million), by Country 2024 & 2032
- Figure 36: North America Multiple Myeloma Treatment Industry Volume (K Unit), by Country 2024 & 2032
- Figure 37: North America Multiple Myeloma Treatment Industry Revenue Share (%), by Country 2024 & 2032
- Figure 38: North America Multiple Myeloma Treatment Industry Volume Share (%), by Country 2024 & 2032
- Figure 39: Europe Multiple Myeloma Treatment Industry Revenue (Million), by Disease Condition 2024 & 2032
- Figure 40: Europe Multiple Myeloma Treatment Industry Volume (K Unit), by Disease Condition 2024 & 2032
- Figure 41: Europe Multiple Myeloma Treatment Industry Revenue Share (%), by Disease Condition 2024 & 2032
- Figure 42: Europe Multiple Myeloma Treatment Industry Volume Share (%), by Disease Condition 2024 & 2032
- Figure 43: Europe Multiple Myeloma Treatment Industry Revenue (Million), by Therapy 2024 & 2032
- Figure 44: Europe Multiple Myeloma Treatment Industry Volume (K Unit), by Therapy 2024 & 2032
- Figure 45: Europe Multiple Myeloma Treatment Industry Revenue Share (%), by Therapy 2024 & 2032
- Figure 46: Europe Multiple Myeloma Treatment Industry Volume Share (%), by Therapy 2024 & 2032
- Figure 47: Europe Multiple Myeloma Treatment Industry Revenue (Million), by End User 2024 & 2032
- Figure 48: Europe Multiple Myeloma Treatment Industry Volume (K Unit), by End User 2024 & 2032
- Figure 49: Europe Multiple Myeloma Treatment Industry Revenue Share (%), by End User 2024 & 2032
- Figure 50: Europe Multiple Myeloma Treatment Industry Volume Share (%), by End User 2024 & 2032
- Figure 51: Europe Multiple Myeloma Treatment Industry Revenue (Million), by Country 2024 & 2032
- Figure 52: Europe Multiple Myeloma Treatment Industry Volume (K Unit), by Country 2024 & 2032
- Figure 53: Europe Multiple Myeloma Treatment Industry Revenue Share (%), by Country 2024 & 2032
- Figure 54: Europe Multiple Myeloma Treatment Industry Volume Share (%), by Country 2024 & 2032
- Figure 55: Asia Pacific Multiple Myeloma Treatment Industry Revenue (Million), by Disease Condition 2024 & 2032
- Figure 56: Asia Pacific Multiple Myeloma Treatment Industry Volume (K Unit), by Disease Condition 2024 & 2032
- Figure 57: Asia Pacific Multiple Myeloma Treatment Industry Revenue Share (%), by Disease Condition 2024 & 2032
- Figure 58: Asia Pacific Multiple Myeloma Treatment Industry Volume Share (%), by Disease Condition 2024 & 2032
- Figure 59: Asia Pacific Multiple Myeloma Treatment Industry Revenue (Million), by Therapy 2024 & 2032
- Figure 60: Asia Pacific Multiple Myeloma Treatment Industry Volume (K Unit), by Therapy 2024 & 2032
- Figure 61: Asia Pacific Multiple Myeloma Treatment Industry Revenue Share (%), by Therapy 2024 & 2032
- Figure 62: Asia Pacific Multiple Myeloma Treatment Industry Volume Share (%), by Therapy 2024 & 2032
- Figure 63: Asia Pacific Multiple Myeloma Treatment Industry Revenue (Million), by End User 2024 & 2032
- Figure 64: Asia Pacific Multiple Myeloma Treatment Industry Volume (K Unit), by End User 2024 & 2032
- Figure 65: Asia Pacific Multiple Myeloma Treatment Industry Revenue Share (%), by End User 2024 & 2032
- Figure 66: Asia Pacific Multiple Myeloma Treatment Industry Volume Share (%), by End User 2024 & 2032
- Figure 67: Asia Pacific Multiple Myeloma Treatment Industry Revenue (Million), by Country 2024 & 2032
- Figure 68: Asia Pacific Multiple Myeloma Treatment Industry Volume (K Unit), by Country 2024 & 2032
- Figure 69: Asia Pacific Multiple Myeloma Treatment Industry Revenue Share (%), by Country 2024 & 2032
- Figure 70: Asia Pacific Multiple Myeloma Treatment Industry Volume Share (%), by Country 2024 & 2032
- Figure 71: Middle East and Africa Multiple Myeloma Treatment Industry Revenue (Million), by Disease Condition 2024 & 2032
- Figure 72: Middle East and Africa Multiple Myeloma Treatment Industry Volume (K Unit), by Disease Condition 2024 & 2032
- Figure 73: Middle East and Africa Multiple Myeloma Treatment Industry Revenue Share (%), by Disease Condition 2024 & 2032
- Figure 74: Middle East and Africa Multiple Myeloma Treatment Industry Volume Share (%), by Disease Condition 2024 & 2032
- Figure 75: Middle East and Africa Multiple Myeloma Treatment Industry Revenue (Million), by Therapy 2024 & 2032
- Figure 76: Middle East and Africa Multiple Myeloma Treatment Industry Volume (K Unit), by Therapy 2024 & 2032
- Figure 77: Middle East and Africa Multiple Myeloma Treatment Industry Revenue Share (%), by Therapy 2024 & 2032
- Figure 78: Middle East and Africa Multiple Myeloma Treatment Industry Volume Share (%), by Therapy 2024 & 2032
- Figure 79: Middle East and Africa Multiple Myeloma Treatment Industry Revenue (Million), by End User 2024 & 2032
- Figure 80: Middle East and Africa Multiple Myeloma Treatment Industry Volume (K Unit), by End User 2024 & 2032
- Figure 81: Middle East and Africa Multiple Myeloma Treatment Industry Revenue Share (%), by End User 2024 & 2032
- Figure 82: Middle East and Africa Multiple Myeloma Treatment Industry Volume Share (%), by End User 2024 & 2032
- Figure 83: Middle East and Africa Multiple Myeloma Treatment Industry Revenue (Million), by Country 2024 & 2032
- Figure 84: Middle East and Africa Multiple Myeloma Treatment Industry Volume (K Unit), by Country 2024 & 2032
- Figure 85: Middle East and Africa Multiple Myeloma Treatment Industry Revenue Share (%), by Country 2024 & 2032
- Figure 86: Middle East and Africa Multiple Myeloma Treatment Industry Volume Share (%), by Country 2024 & 2032
- Figure 87: South America Multiple Myeloma Treatment Industry Revenue (Million), by Disease Condition 2024 & 2032
- Figure 88: South America Multiple Myeloma Treatment Industry Volume (K Unit), by Disease Condition 2024 & 2032
- Figure 89: South America Multiple Myeloma Treatment Industry Revenue Share (%), by Disease Condition 2024 & 2032
- Figure 90: South America Multiple Myeloma Treatment Industry Volume Share (%), by Disease Condition 2024 & 2032
- Figure 91: South America Multiple Myeloma Treatment Industry Revenue (Million), by Therapy 2024 & 2032
- Figure 92: South America Multiple Myeloma Treatment Industry Volume (K Unit), by Therapy 2024 & 2032
- Figure 93: South America Multiple Myeloma Treatment Industry Revenue Share (%), by Therapy 2024 & 2032
- Figure 94: South America Multiple Myeloma Treatment Industry Volume Share (%), by Therapy 2024 & 2032
- Figure 95: South America Multiple Myeloma Treatment Industry Revenue (Million), by End User 2024 & 2032
- Figure 96: South America Multiple Myeloma Treatment Industry Volume (K Unit), by End User 2024 & 2032
- Figure 97: South America Multiple Myeloma Treatment Industry Revenue Share (%), by End User 2024 & 2032
- Figure 98: South America Multiple Myeloma Treatment Industry Volume Share (%), by End User 2024 & 2032
- Figure 99: South America Multiple Myeloma Treatment Industry Revenue (Million), by Country 2024 & 2032
- Figure 100: South America Multiple Myeloma Treatment Industry Volume (K Unit), by Country 2024 & 2032
- Figure 101: South America Multiple Myeloma Treatment Industry Revenue Share (%), by Country 2024 & 2032
- Figure 102: South America Multiple Myeloma Treatment Industry Volume Share (%), by Country 2024 & 2032
List of Tables
- Table 1: Global Multiple Myeloma Treatment Industry Revenue Million Forecast, by Region 2019 & 2032
- Table 2: Global Multiple Myeloma Treatment Industry Volume K Unit Forecast, by Region 2019 & 2032
- Table 3: Global Multiple Myeloma Treatment Industry Revenue Million Forecast, by Disease Condition 2019 & 2032
- Table 4: Global Multiple Myeloma Treatment Industry Volume K Unit Forecast, by Disease Condition 2019 & 2032
- Table 5: Global Multiple Myeloma Treatment Industry Revenue Million Forecast, by Therapy 2019 & 2032
- Table 6: Global Multiple Myeloma Treatment Industry Volume K Unit Forecast, by Therapy 2019 & 2032
- Table 7: Global Multiple Myeloma Treatment Industry Revenue Million Forecast, by End User 2019 & 2032
- Table 8: Global Multiple Myeloma Treatment Industry Volume K Unit Forecast, by End User 2019 & 2032
- Table 9: Global Multiple Myeloma Treatment Industry Revenue Million Forecast, by Region 2019 & 2032
- Table 10: Global Multiple Myeloma Treatment Industry Volume K Unit Forecast, by Region 2019 & 2032
- Table 11: Global Multiple Myeloma Treatment Industry Revenue Million Forecast, by Country 2019 & 2032
- Table 12: Global Multiple Myeloma Treatment Industry Volume K Unit Forecast, by Country 2019 & 2032
- Table 13: United States Multiple Myeloma Treatment Industry Revenue (Million) Forecast, by Application 2019 & 2032
- Table 14: United States Multiple Myeloma Treatment Industry Volume (K Unit) Forecast, by Application 2019 & 2032
- Table 15: Canada Multiple Myeloma Treatment Industry Revenue (Million) Forecast, by Application 2019 & 2032
- Table 16: Canada Multiple Myeloma Treatment Industry Volume (K Unit) Forecast, by Application 2019 & 2032
- Table 17: Mexico Multiple Myeloma Treatment Industry Revenue (Million) Forecast, by Application 2019 & 2032
- Table 18: Mexico Multiple Myeloma Treatment Industry Volume (K Unit) Forecast, by Application 2019 & 2032
- Table 19: Global Multiple Myeloma Treatment Industry Revenue Million Forecast, by Country 2019 & 2032
- Table 20: Global Multiple Myeloma Treatment Industry Volume K Unit Forecast, by Country 2019 & 2032
- Table 21: Germany Multiple Myeloma Treatment Industry Revenue (Million) Forecast, by Application 2019 & 2032
- Table 22: Germany Multiple Myeloma Treatment Industry Volume (K Unit) Forecast, by Application 2019 & 2032
- Table 23: United Kingdom Multiple Myeloma Treatment Industry Revenue (Million) Forecast, by Application 2019 & 2032
- Table 24: United Kingdom Multiple Myeloma Treatment Industry Volume (K Unit) Forecast, by Application 2019 & 2032
- Table 25: France Multiple Myeloma Treatment Industry Revenue (Million) Forecast, by Application 2019 & 2032
- Table 26: France Multiple Myeloma Treatment Industry Volume (K Unit) Forecast, by Application 2019 & 2032
- Table 27: Italy Multiple Myeloma Treatment Industry Revenue (Million) Forecast, by Application 2019 & 2032
- Table 28: Italy Multiple Myeloma Treatment Industry Volume (K Unit) Forecast, by Application 2019 & 2032
- Table 29: Spain Multiple Myeloma Treatment Industry Revenue (Million) Forecast, by Application 2019 & 2032
- Table 30: Spain Multiple Myeloma Treatment Industry Volume (K Unit) Forecast, by Application 2019 & 2032
- Table 31: Rest of Europe Multiple Myeloma Treatment Industry Revenue (Million) Forecast, by Application 2019 & 2032
- Table 32: Rest of Europe Multiple Myeloma Treatment Industry Volume (K Unit) Forecast, by Application 2019 & 2032
- Table 33: Global Multiple Myeloma Treatment Industry Revenue Million Forecast, by Country 2019 & 2032
- Table 34: Global Multiple Myeloma Treatment Industry Volume K Unit Forecast, by Country 2019 & 2032
- Table 35: China Multiple Myeloma Treatment Industry Revenue (Million) Forecast, by Application 2019 & 2032
- Table 36: China Multiple Myeloma Treatment Industry Volume (K Unit) Forecast, by Application 2019 & 2032
- Table 37: Japan Multiple Myeloma Treatment Industry Revenue (Million) Forecast, by Application 2019 & 2032
- Table 38: Japan Multiple Myeloma Treatment Industry Volume (K Unit) Forecast, by Application 2019 & 2032
- Table 39: India Multiple Myeloma Treatment Industry Revenue (Million) Forecast, by Application 2019 & 2032
- Table 40: India Multiple Myeloma Treatment Industry Volume (K Unit) Forecast, by Application 2019 & 2032
- Table 41: Australia Multiple Myeloma Treatment Industry Revenue (Million) Forecast, by Application 2019 & 2032
- Table 42: Australia Multiple Myeloma Treatment Industry Volume (K Unit) Forecast, by Application 2019 & 2032
- Table 43: South Korea Multiple Myeloma Treatment Industry Revenue (Million) Forecast, by Application 2019 & 2032
- Table 44: South Korea Multiple Myeloma Treatment Industry Volume (K Unit) Forecast, by Application 2019 & 2032
- Table 45: Rest of Asia Pacific Multiple Myeloma Treatment Industry Revenue (Million) Forecast, by Application 2019 & 2032
- Table 46: Rest of Asia Pacific Multiple Myeloma Treatment Industry Volume (K Unit) Forecast, by Application 2019 & 2032
- Table 47: Global Multiple Myeloma Treatment Industry Revenue Million Forecast, by Country 2019 & 2032
- Table 48: Global Multiple Myeloma Treatment Industry Volume K Unit Forecast, by Country 2019 & 2032
- Table 49: GCC Multiple Myeloma Treatment Industry Revenue (Million) Forecast, by Application 2019 & 2032
- Table 50: GCC Multiple Myeloma Treatment Industry Volume (K Unit) Forecast, by Application 2019 & 2032
- Table 51: South Africa Multiple Myeloma Treatment Industry Revenue (Million) Forecast, by Application 2019 & 2032
- Table 52: South Africa Multiple Myeloma Treatment Industry Volume (K Unit) Forecast, by Application 2019 & 2032
- Table 53: Rest of Middle East and Africa Multiple Myeloma Treatment Industry Revenue (Million) Forecast, by Application 2019 & 2032
- Table 54: Rest of Middle East and Africa Multiple Myeloma Treatment Industry Volume (K Unit) Forecast, by Application 2019 & 2032
- Table 55: Global Multiple Myeloma Treatment Industry Revenue Million Forecast, by Country 2019 & 2032
- Table 56: Global Multiple Myeloma Treatment Industry Volume K Unit Forecast, by Country 2019 & 2032
- Table 57: Brazil Multiple Myeloma Treatment Industry Revenue (Million) Forecast, by Application 2019 & 2032
- Table 58: Brazil Multiple Myeloma Treatment Industry Volume (K Unit) Forecast, by Application 2019 & 2032
- Table 59: Argentina Multiple Myeloma Treatment Industry Revenue (Million) Forecast, by Application 2019 & 2032
- Table 60: Argentina Multiple Myeloma Treatment Industry Volume (K Unit) Forecast, by Application 2019 & 2032
- Table 61: Rest of South America Multiple Myeloma Treatment Industry Revenue (Million) Forecast, by Application 2019 & 2032
- Table 62: Rest of South America Multiple Myeloma Treatment Industry Volume (K Unit) Forecast, by Application 2019 & 2032
- Table 63: Global Multiple Myeloma Treatment Industry Revenue Million Forecast, by Disease Condition 2019 & 2032
- Table 64: Global Multiple Myeloma Treatment Industry Volume K Unit Forecast, by Disease Condition 2019 & 2032
- Table 65: Global Multiple Myeloma Treatment Industry Revenue Million Forecast, by Therapy 2019 & 2032
- Table 66: Global Multiple Myeloma Treatment Industry Volume K Unit Forecast, by Therapy 2019 & 2032
- Table 67: Global Multiple Myeloma Treatment Industry Revenue Million Forecast, by End User 2019 & 2032
- Table 68: Global Multiple Myeloma Treatment Industry Volume K Unit Forecast, by End User 2019 & 2032
- Table 69: Global Multiple Myeloma Treatment Industry Revenue Million Forecast, by Country 2019 & 2032
- Table 70: Global Multiple Myeloma Treatment Industry Volume K Unit Forecast, by Country 2019 & 2032
- Table 71: United States Multiple Myeloma Treatment Industry Revenue (Million) Forecast, by Application 2019 & 2032
- Table 72: United States Multiple Myeloma Treatment Industry Volume (K Unit) Forecast, by Application 2019 & 2032
- Table 73: Canada Multiple Myeloma Treatment Industry Revenue (Million) Forecast, by Application 2019 & 2032
- Table 74: Canada Multiple Myeloma Treatment Industry Volume (K Unit) Forecast, by Application 2019 & 2032
- Table 75: Mexico Multiple Myeloma Treatment Industry Revenue (Million) Forecast, by Application 2019 & 2032
- Table 76: Mexico Multiple Myeloma Treatment Industry Volume (K Unit) Forecast, by Application 2019 & 2032
- Table 77: Global Multiple Myeloma Treatment Industry Revenue Million Forecast, by Disease Condition 2019 & 2032
- Table 78: Global Multiple Myeloma Treatment Industry Volume K Unit Forecast, by Disease Condition 2019 & 2032
- Table 79: Global Multiple Myeloma Treatment Industry Revenue Million Forecast, by Therapy 2019 & 2032
- Table 80: Global Multiple Myeloma Treatment Industry Volume K Unit Forecast, by Therapy 2019 & 2032
- Table 81: Global Multiple Myeloma Treatment Industry Revenue Million Forecast, by End User 2019 & 2032
- Table 82: Global Multiple Myeloma Treatment Industry Volume K Unit Forecast, by End User 2019 & 2032
- Table 83: Global Multiple Myeloma Treatment Industry Revenue Million Forecast, by Country 2019 & 2032
- Table 84: Global Multiple Myeloma Treatment Industry Volume K Unit Forecast, by Country 2019 & 2032
- Table 85: Germany Multiple Myeloma Treatment Industry Revenue (Million) Forecast, by Application 2019 & 2032
- Table 86: Germany Multiple Myeloma Treatment Industry Volume (K Unit) Forecast, by Application 2019 & 2032
- Table 87: United Kingdom Multiple Myeloma Treatment Industry Revenue (Million) Forecast, by Application 2019 & 2032
- Table 88: United Kingdom Multiple Myeloma Treatment Industry Volume (K Unit) Forecast, by Application 2019 & 2032
- Table 89: France Multiple Myeloma Treatment Industry Revenue (Million) Forecast, by Application 2019 & 2032
- Table 90: France Multiple Myeloma Treatment Industry Volume (K Unit) Forecast, by Application 2019 & 2032
- Table 91: Italy Multiple Myeloma Treatment Industry Revenue (Million) Forecast, by Application 2019 & 2032
- Table 92: Italy Multiple Myeloma Treatment Industry Volume (K Unit) Forecast, by Application 2019 & 2032
- Table 93: Spain Multiple Myeloma Treatment Industry Revenue (Million) Forecast, by Application 2019 & 2032
- Table 94: Spain Multiple Myeloma Treatment Industry Volume (K Unit) Forecast, by Application 2019 & 2032
- Table 95: Rest of Europe Multiple Myeloma Treatment Industry Revenue (Million) Forecast, by Application 2019 & 2032
- Table 96: Rest of Europe Multiple Myeloma Treatment Industry Volume (K Unit) Forecast, by Application 2019 & 2032
- Table 97: Global Multiple Myeloma Treatment Industry Revenue Million Forecast, by Disease Condition 2019 & 2032
- Table 98: Global Multiple Myeloma Treatment Industry Volume K Unit Forecast, by Disease Condition 2019 & 2032
- Table 99: Global Multiple Myeloma Treatment Industry Revenue Million Forecast, by Therapy 2019 & 2032
- Table 100: Global Multiple Myeloma Treatment Industry Volume K Unit Forecast, by Therapy 2019 & 2032
- Table 101: Global Multiple Myeloma Treatment Industry Revenue Million Forecast, by End User 2019 & 2032
- Table 102: Global Multiple Myeloma Treatment Industry Volume K Unit Forecast, by End User 2019 & 2032
- Table 103: Global Multiple Myeloma Treatment Industry Revenue Million Forecast, by Country 2019 & 2032
- Table 104: Global Multiple Myeloma Treatment Industry Volume K Unit Forecast, by Country 2019 & 2032
- Table 105: China Multiple Myeloma Treatment Industry Revenue (Million) Forecast, by Application 2019 & 2032
- Table 106: China Multiple Myeloma Treatment Industry Volume (K Unit) Forecast, by Application 2019 & 2032
- Table 107: Japan Multiple Myeloma Treatment Industry Revenue (Million) Forecast, by Application 2019 & 2032
- Table 108: Japan Multiple Myeloma Treatment Industry Volume (K Unit) Forecast, by Application 2019 & 2032
- Table 109: India Multiple Myeloma Treatment Industry Revenue (Million) Forecast, by Application 2019 & 2032
- Table 110: India Multiple Myeloma Treatment Industry Volume (K Unit) Forecast, by Application 2019 & 2032
- Table 111: Australia Multiple Myeloma Treatment Industry Revenue (Million) Forecast, by Application 2019 & 2032
- Table 112: Australia Multiple Myeloma Treatment Industry Volume (K Unit) Forecast, by Application 2019 & 2032
- Table 113: South Korea Multiple Myeloma Treatment Industry Revenue (Million) Forecast, by Application 2019 & 2032
- Table 114: South Korea Multiple Myeloma Treatment Industry Volume (K Unit) Forecast, by Application 2019 & 2032
- Table 115: Rest of Asia Pacific Multiple Myeloma Treatment Industry Revenue (Million) Forecast, by Application 2019 & 2032
- Table 116: Rest of Asia Pacific Multiple Myeloma Treatment Industry Volume (K Unit) Forecast, by Application 2019 & 2032
- Table 117: Global Multiple Myeloma Treatment Industry Revenue Million Forecast, by Disease Condition 2019 & 2032
- Table 118: Global Multiple Myeloma Treatment Industry Volume K Unit Forecast, by Disease Condition 2019 & 2032
- Table 119: Global Multiple Myeloma Treatment Industry Revenue Million Forecast, by Therapy 2019 & 2032
- Table 120: Global Multiple Myeloma Treatment Industry Volume K Unit Forecast, by Therapy 2019 & 2032
- Table 121: Global Multiple Myeloma Treatment Industry Revenue Million Forecast, by End User 2019 & 2032
- Table 122: Global Multiple Myeloma Treatment Industry Volume K Unit Forecast, by End User 2019 & 2032
- Table 123: Global Multiple Myeloma Treatment Industry Revenue Million Forecast, by Country 2019 & 2032
- Table 124: Global Multiple Myeloma Treatment Industry Volume K Unit Forecast, by Country 2019 & 2032
- Table 125: GCC Multiple Myeloma Treatment Industry Revenue (Million) Forecast, by Application 2019 & 2032
- Table 126: GCC Multiple Myeloma Treatment Industry Volume (K Unit) Forecast, by Application 2019 & 2032
- Table 127: South Africa Multiple Myeloma Treatment Industry Revenue (Million) Forecast, by Application 2019 & 2032
- Table 128: South Africa Multiple Myeloma Treatment Industry Volume (K Unit) Forecast, by Application 2019 & 2032
- Table 129: Rest of Middle East and Africa Multiple Myeloma Treatment Industry Revenue (Million) Forecast, by Application 2019 & 2032
- Table 130: Rest of Middle East and Africa Multiple Myeloma Treatment Industry Volume (K Unit) Forecast, by Application 2019 & 2032
- Table 131: Global Multiple Myeloma Treatment Industry Revenue Million Forecast, by Disease Condition 2019 & 2032
- Table 132: Global Multiple Myeloma Treatment Industry Volume K Unit Forecast, by Disease Condition 2019 & 2032
- Table 133: Global Multiple Myeloma Treatment Industry Revenue Million Forecast, by Therapy 2019 & 2032
- Table 134: Global Multiple Myeloma Treatment Industry Volume K Unit Forecast, by Therapy 2019 & 2032
- Table 135: Global Multiple Myeloma Treatment Industry Revenue Million Forecast, by End User 2019 & 2032
- Table 136: Global Multiple Myeloma Treatment Industry Volume K Unit Forecast, by End User 2019 & 2032
- Table 137: Global Multiple Myeloma Treatment Industry Revenue Million Forecast, by Country 2019 & 2032
- Table 138: Global Multiple Myeloma Treatment Industry Volume K Unit Forecast, by Country 2019 & 2032
- Table 139: Brazil Multiple Myeloma Treatment Industry Revenue (Million) Forecast, by Application 2019 & 2032
- Table 140: Brazil Multiple Myeloma Treatment Industry Volume (K Unit) Forecast, by Application 2019 & 2032
- Table 141: Argentina Multiple Myeloma Treatment Industry Revenue (Million) Forecast, by Application 2019 & 2032
- Table 142: Argentina Multiple Myeloma Treatment Industry Volume (K Unit) Forecast, by Application 2019 & 2032
- Table 143: Rest of South America Multiple Myeloma Treatment Industry Revenue (Million) Forecast, by Application 2019 & 2032
- Table 144: Rest of South America Multiple Myeloma Treatment Industry Volume (K Unit) Forecast, by Application 2019 & 2032
Frequently Asked Questions
1. What is the projected Compound Annual Growth Rate (CAGR) of the Multiple Myeloma Treatment Industry?
The projected CAGR is approximately 7.77%.
2. Which companies are prominent players in the Multiple Myeloma Treatment Industry?
Key companies in the market include Sanofi SA, Novartis AG, Amgen Inc, Kite Pharma (Gilead Sciences), AstraZeneca PLC, F Hoffmann-LA Roche Ltd, Atara Biotherapeutics, AbbVie Inc, Incyte Corporation, Johnson & Johnson, Bristol-Myers Squibb Company, Celldex Therapeutics Inc, GlaxoSmithKline PLC, Takeda Pharmaceutical Co Ltd, Pfizer Inc.
3. What are the main segments of the Multiple Myeloma Treatment Industry?
The market segments include Disease Condition, Therapy, End User.
4. Can you provide details about the market size?
The market size is estimated to be USD 67.23 Million as of 2022.
5. What are some drivers contributing to market growth?
Growing Incidence of Blood Cancer; Increasing Awareness about the Possibility of Early Diagnosis; Increasing Emphasis on Development of New Treatments.
6. What are the notable trends driving market growth?
Chemotherapy Leads the Segment. and it is Expected to Witness a Healthy Growth Over the Forecast Period.
7. Are there any restraints impacting market growth?
High Cost of Medication.
8. Can you provide examples of recent developments in the market?
In March 2021, Sanofi SA received US FDA approval for its Sarclisa (isatuximab) in combination with carfilzomib and dexamethasone for patients with relapsed or refractory multiple myeloma.
9. What pricing options are available for accessing the report?
Pricing options include single-user, multi-user, and enterprise licenses priced at USD 4750, USD 5250, and USD 8750 respectively.
10. Is the market size provided in terms of value or volume?
The market size is provided in terms of value, measured in Million and volume, measured in K Unit.
11. Are there any specific market keywords associated with the report?
Yes, the market keyword associated with the report is "Multiple Myeloma Treatment Industry," which aids in identifying and referencing the specific market segment covered.
12. How do I determine which pricing option suits my needs best?
The pricing options vary based on user requirements and access needs. Individual users may opt for single-user licenses, while businesses requiring broader access may choose multi-user or enterprise licenses for cost-effective access to the report.
13. Are there any additional resources or data provided in the Multiple Myeloma Treatment Industry report?
While the report offers comprehensive insights, it's advisable to review the specific contents or supplementary materials provided to ascertain if additional resources or data are available.
14. How can I stay updated on further developments or reports in the Multiple Myeloma Treatment Industry?
To stay informed about further developments, trends, and reports in the Multiple Myeloma Treatment Industry, consider subscribing to industry newsletters, following relevant companies and organizations, or regularly checking reputable industry news sources and publications.
Methodology
Step 1 - Identification of Relevant Samples Size from Population Database


Step 2 - Approaches for Defining Global Market Size (Value, Volume* & Price*)

Note*: In applicable scenarios
Step 3 - Data Sources
Primary Research
- Web Analytics
- Survey Reports
- Research Institute
- Latest Research Reports
- Opinion Leaders
Secondary Research
- Annual Reports
- White Paper
- Latest Press Release
- Industry Association
- Paid Database
- Investor Presentations

Step 4 - Data Triangulation
Involves using different sources of information in order to increase the validity of a study
These sources are likely to be stakeholders in a program - participants, other researchers, program staff, other community members, and so on.
Then we put all data in single framework & apply various statistical tools to find out the dynamic on the market.
During the analysis stage, feedback from the stakeholder groups would be compared to determine areas of agreement as well as areas of divergence
