

Key Insights
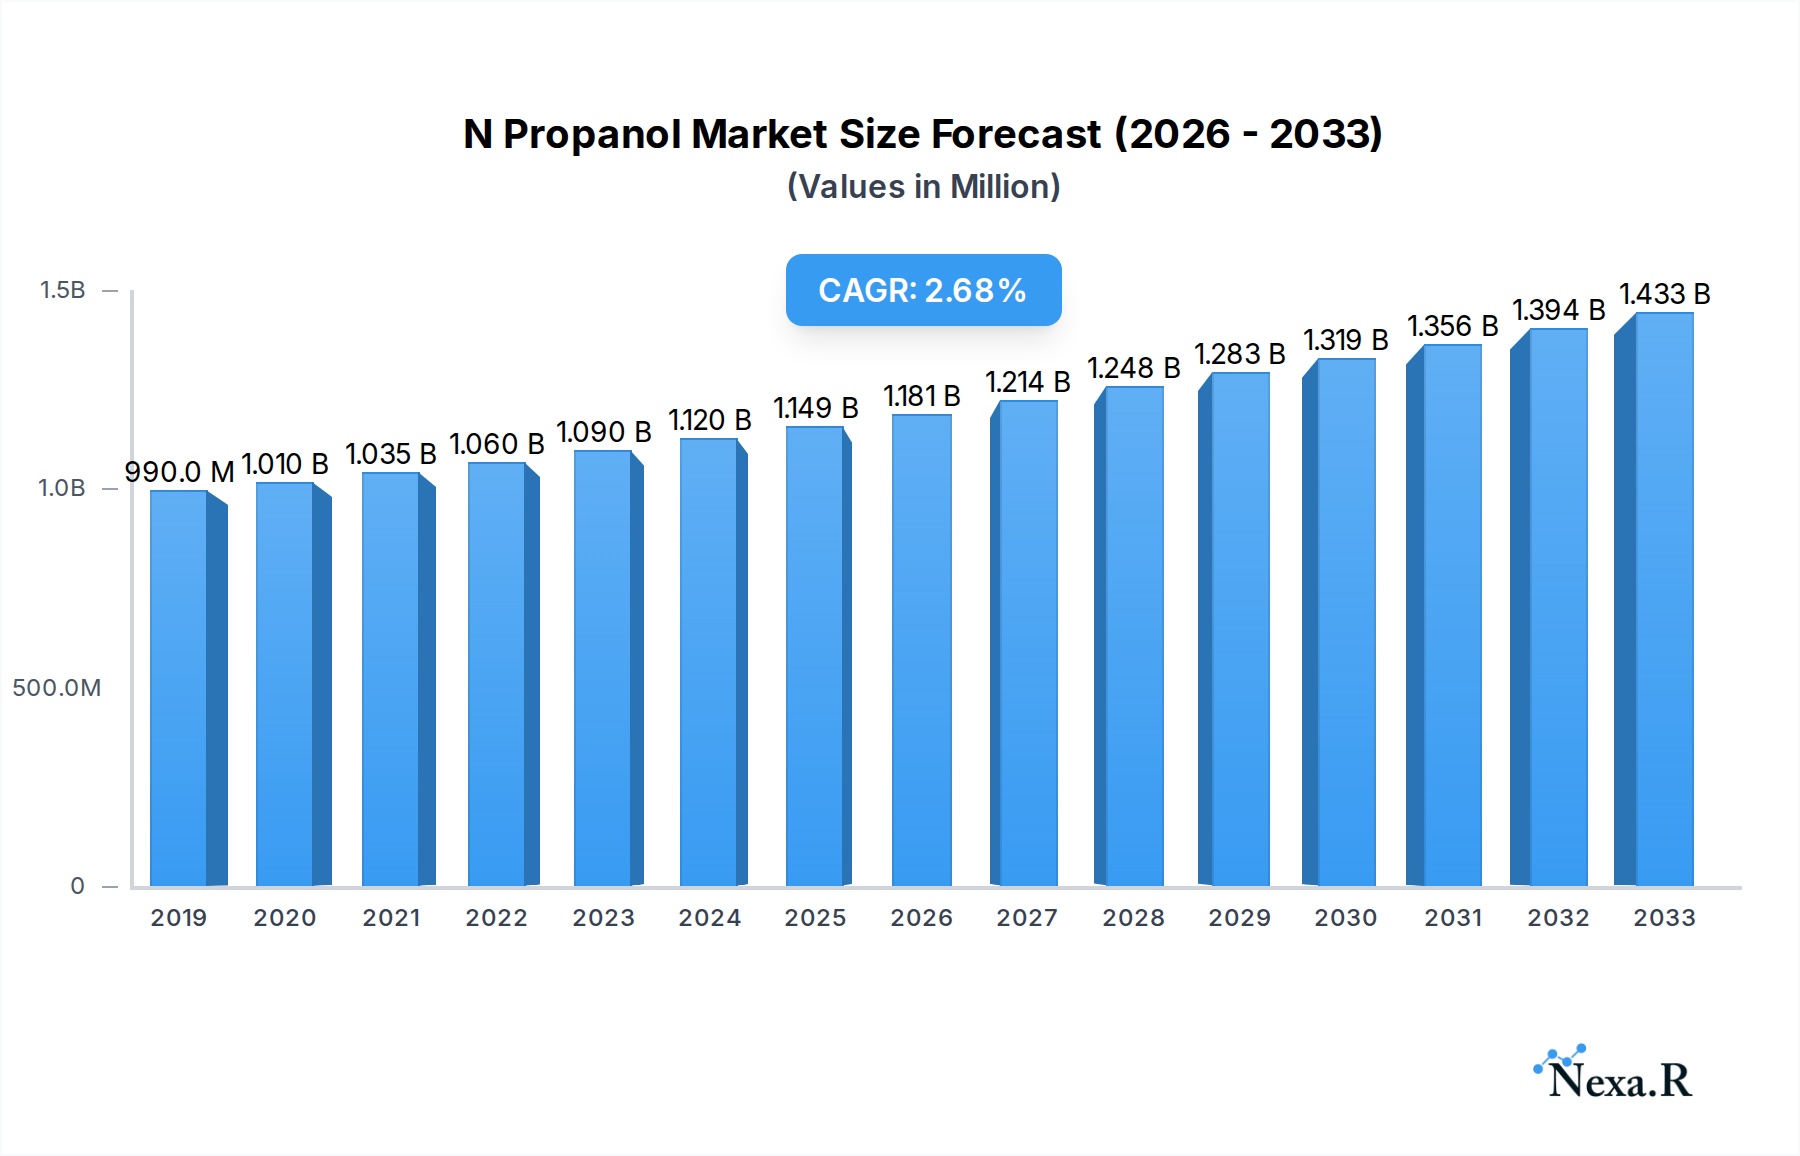
The global N Propanol market is poised for steady growth, projected to reach $1149 million by 2025, driven by a CAGR of 2.9% through 2033. This expansion is primarily fueled by the increasing demand from key application segments such as coatings and printing inks, where N Propanol serves as a crucial solvent. Its utility in feed additives and spices, pharmaceuticals, pesticides, and daily necessities further bolsters its market relevance. The market's trajectory is significantly influenced by the adoption of efficient production methods, with the Ethylene Hydrogenation Method emerging as a dominant technique due to its cost-effectiveness and higher yields. Innovations in chemical synthesis and a growing emphasis on product quality and environmental compliance are also shaping the market landscape.

N Propanol Market Size (In Million)
Looking ahead, the market is expected to navigate several influential trends and challenges. The rising global population and increasing disposable incomes are expected to stimulate demand for products within the daily necessities sector, indirectly benefiting N Propanol consumption. Furthermore, advancements in the pharmaceutical and agrochemical industries, necessitating high-purity solvents, will continue to be a strong growth driver. However, the market may encounter restraints related to the price volatility of raw materials, particularly ethylene and propylene, which are subject to fluctuations in crude oil prices. Stringent environmental regulations concerning VOC emissions might also necessitate the development of greener alternatives or advanced emission control technologies, posing a potential challenge. Nevertheless, strategic collaborations among key players and a focus on expanding production capacities in high-demand regions are expected to sustain the market's upward momentum.
N Propanol Company Market Share
N Propanol Market Report: Comprehensive Analysis and Future Outlook (2019-2033)
This in-depth report provides a detailed analysis of the global N Propanol market, covering market dynamics, growth trends, regional dominance, product landscape, key drivers, emerging opportunities, and a comprehensive outlook for the forecast period of 2025-2033. The report leverages extensive research and data to offer actionable insights for industry professionals, investors, and stakeholders. The parent market for N Propanol encompasses the broader alcohols and solvents industry, while the child market focuses specifically on the unique applications and value chain of N Propanol.
N Propanol Market Dynamics & Structure
The N Propanol market is characterized by a moderate level of concentration, with key global players like BASF, DuPont, Eastman, OXEA, and Sasol holding significant market shares. Technological innovation is primarily driven by advancements in synthesis processes, aiming for higher purity and cost-efficiency. For instance, the Ethylene Hydrogenation Method is a key area of ongoing R&D for improved yields and reduced environmental impact, while the Other Compounds Byproduct Method offers alternative, potentially more sustainable routes. Regulatory frameworks, particularly concerning chemical safety and environmental emissions, are crucial in shaping market access and product development. Competitive product substitutes, such as Isopropanol and other specialty solvents, influence pricing and demand, necessitating continuous innovation and differentiation by N Propanol manufacturers. End-user demographics are increasingly influenced by the growth in sectors like pharmaceuticals, daily necessities, and coatings, driving demand for high-purity N Propanol. Mergers and acquisitions (M&A) activity, though not extensively prevalent in the historical period, represents a potential future trend for market consolidation and expansion.
- Market Concentration: Moderate, with a few key global manufacturers.
- Technological Innovation Drivers: Enhanced synthesis efficiency, higher purity grades, sustainable production methods.
- Regulatory Frameworks: Stringent safety and environmental regulations impacting production and application.
- Competitive Product Substitutes: Isopropanol, Ethanol, specialty solvents.
- End-User Demographics: Growth in pharmaceuticals, daily necessities, coatings, and printing ink sectors.
- M&A Trends: Limited historical activity, potential for future consolidation.
N Propanol Growth Trends & Insights
The global N Propanol market is poised for robust growth over the study period of 2019–2033, with a projected Compound Annual Growth Rate (CAGR) of approximately 5.8% from the base year of 2025 through 2033. The market size, valued at an estimated $1,850 million in 2025, is expected to expand significantly, driven by escalating demand across its diverse applications. Adoption rates for N Propanol are steadily increasing, particularly within the pharmaceutical and pesticide sectors, where its role as a solvent and intermediate is critical for the synthesis of active ingredients. Technological disruptions are largely centered on optimizing production methods. The Ethylene Hydrogenation Method, for instance, is being refined for greater energy efficiency and higher yields, while research into alternative byproduct routes is exploring novel pathways to enhance sustainability and reduce waste. Consumer behavior shifts are indirectly impacting the N Propanol market; for example, increased consumer spending on personal care products and disinfectants fuels demand for N Propanol as a key ingredient in daily necessities. Furthermore, the growing emphasis on eco-friendly coatings and printing inks is also creating new avenues for N Propanol adoption. The market penetration of N Propanol is expected to deepen across various industrial segments as awareness of its performance benefits and applications grows. The historical period of 2019-2024 saw steady growth, laying a solid foundation for the anticipated acceleration in the forecast period. By 2025, the market size is forecast to reach approximately $1,980 million, demonstrating continued upward trajectory. This growth trajectory is underpinned by consistent industrial activity and the expanding application scope of N Propanol in critical manufacturing processes. The overall market evolution is indicative of its indispensable role in various chemical synthesis and formulation processes.
Dominant Regions, Countries, or Segments in N Propanol
The Coatings & Printing Ink application segment is projected to be the dominant driver of market growth for N Propanol during the forecast period (2025–2033). This dominance stems from the widespread use of N Propanol as a solvent in high-performance coatings, lacquers, and printing inks, where its properties contribute to excellent solvency, controlled evaporation rates, and improved gloss. The increasing global demand for paints and coatings in the construction, automotive, and industrial sectors, particularly in emerging economies, directly translates into higher consumption of N Propanol. Coupled with the growing trend towards digital printing technologies, which often utilize specialized ink formulations requiring high-purity solvents like N Propanol, this segment's growth potential is substantial.
- Asia Pacific is anticipated to be the leading region, driven by rapid industrialization, a burgeoning manufacturing base, and increasing investments in infrastructure and consumer goods production. Countries like China and India are significant contributors due to their large chemical manufacturing capacities and substantial domestic demand across all N Propanol application segments.
- The Ethylene Hydrogenation Method is expected to remain the predominant production type, owing to its established efficiency and cost-effectiveness in large-scale manufacturing. However, continuous advancements in this method and the development of alternative byproduct routes are crucial for meeting evolving environmental standards and market demands for sustainable chemicals.
- The Pharmaceutical and Pesticide segment also presents strong growth potential, driven by the continuous need for advanced drug synthesis and crop protection chemicals. N Propanol's role as a crucial intermediate and solvent in these complex chemical processes ensures sustained demand.
Key drivers for the dominance of the Coatings & Printing Ink segment and the Asia Pacific region include:
- Economic Policies: Favorable industrial policies and government initiatives promoting manufacturing and infrastructure development in Asia Pacific.
- Infrastructure: Significant investments in industrial infrastructure, transportation networks, and R&D facilities in key Asian countries.
- Market Share: The Coatings & Printing Ink segment is estimated to hold approximately 35% of the total N Propanol market in 2025, with a projected growth rate of 6.2% CAGR.
- Growth Potential: The Asia Pacific region is forecasted to account for over 45% of the global N Propanol market by 2033, driven by its expanding industrial footprint and significant consumption in key application sectors.
N Propanol Product Landscape
The N Propanol product landscape is characterized by a focus on high-purity grades and specialized formulations tailored for specific industrial applications. Innovations are driven by the need for enhanced solvency, reduced volatile organic compound (VOC) emissions, and improved environmental profiles. Manufacturers are investing in advanced purification technologies to meet the stringent requirements of the pharmaceutical and daily necessities sectors. Unique selling propositions often revolve around consistency, reliability, and compliance with international quality standards. Technological advancements are centered on optimizing production efficiency and developing greener synthesis pathways. For instance, advancements in catalysts for the Ethylene Hydrogenation Method are leading to higher yields and reduced energy consumption, thereby improving the product's competitive edge and sustainability.
Key Drivers, Barriers & Challenges in N Propanol
Key Drivers:
The N Propanol market is propelled by several key drivers. The escalating demand from the pharmaceutical industry for high-purity solvents and intermediates is a significant growth catalyst. Growth in the coatings and printing ink sectors, fueled by construction and automotive industry expansion, further boosts demand. The increasing use of N Propanol in daily necessities, such as sanitizers and personal care products, also contributes to market expansion. Technological advancements in production methods, leading to improved efficiency and sustainability, are also crucial drivers.
- Pharmaceutical Demand: Essential for drug synthesis and formulation.
- Coatings & Printing Ink Growth: Driven by construction and automotive sectors.
- Daily Necessities Expansion: Increased use in personal care and hygiene products.
- Production Efficiency: Technological advancements in synthesis methods.
Barriers & Challenges:
Despite positive growth, the N Propanol market faces several challenges. Fluctuations in raw material prices, particularly crude oil derivatives, can impact production costs and profit margins. Stringent environmental regulations regarding chemical production and emissions pose compliance challenges for manufacturers. The availability of competitive substitutes like Isopropanol can create pricing pressures and limit market penetration in certain applications. Supply chain disruptions, as seen in recent global events, can also affect the availability and cost of N Propanol.
- Raw Material Volatility: Price fluctuations of upstream chemicals impact manufacturing costs.
- Environmental Regulations: Strict compliance requirements for emissions and waste management.
- Substitute Availability: Competition from Isopropanol and other solvents.
- Supply Chain Disruptions: Vulnerability to global logistical and geopolitical issues.
Emerging Opportunities in N Propanol
Emerging opportunities in the N Propanol market lie in the development of bio-based N Propanol and the expansion of its applications in niche, high-value sectors. The growing global emphasis on sustainability and circular economy principles is creating a demand for bio-derived chemicals. Research into fermentation processes and the utilization of renewable feedstocks for N Propanol production presents a significant untapped market. Furthermore, exploring novel applications in areas like advanced materials, electronics manufacturing, and as a component in specialized cleaning agents could unlock new revenue streams. The increasing consumer preference for natural and eco-friendly products also presents an opportunity for N Propanol derived from sustainable sources.
- Bio-based N Propanol: Development of sustainable production routes from renewable feedstocks.
- Niche Applications: Exploration in advanced materials, electronics, and specialized cleaning.
- Sustainable Consumer Products: Aligning with market demand for eco-friendly formulations.
Growth Accelerators in the N Propanol Industry
Growth accelerators for the N Propanol industry include continued investment in research and development to enhance production efficiency and explore novel synthesis pathways. Strategic partnerships between raw material suppliers and N Propanol manufacturers can help mitigate price volatility and ensure supply chain stability. Furthermore, expanding market reach into developing economies with growing industrial bases offers significant potential for volume growth. The development of higher-purity grades of N Propanol for specialized applications, particularly in the pharmaceutical and advanced materials sectors, will also act as a key accelerator, commanding premium pricing and driving innovation.
- R&D Investment: Focus on process optimization and greener synthesis.
- Strategic Partnerships: Ensuring supply chain security and cost management.
- Emerging Market Expansion: Tapping into growing industrial demand in developing regions.
- High-Purity Grades: Catering to specialized and high-value applications.
Key Players Shaping the N Propanol Market
- BASF
- DuPont
- Eastman
- OXEA
- Sasol
- Wu Jiang Chemical
- Zibo Nalcohol Chemical
- DAIREN CHEMICAL
Notable Milestones in N Propanol Sector
- 2019: Increased investment in R&D for optimizing Ethylene Hydrogenation Method by major chemical companies.
- 2020: Growing demand for N Propanol in hand sanitizers due to the global pandemic.
- 2021: Introduction of new, environmentally friendly catalysts for N Propanol production.
- 2022: Expansion of production capacity by OXEA to meet rising demand in coatings and pharmaceuticals.
- 2023: Focus on developing higher purity grades of N Propanol for advanced pharmaceutical applications.
- 2024: Exploration of alternative byproduct methods for more sustainable N Propanol synthesis.
In-Depth N Propanol Market Outlook
The N Propanol market is projected for continued robust growth, driven by its indispensable role in diverse industrial applications. The forecast period (2025–2033) is expected to witness accelerated expansion, fueled by advancements in production technologies and increasing demand from key sectors like pharmaceuticals, coatings, and daily necessities. Strategic opportunities lie in the development of bio-based N Propanol and its penetration into emerging high-value applications. Companies that prioritize innovation, sustainability, and supply chain resilience will be well-positioned to capitalize on the evolving market landscape and achieve sustained growth. The market's future trajectory is indicative of its essentiality in modern chemical manufacturing and product development.
N Propanol Segmentation
-
1. Application
- 1.1. Coatings & Printing Ink
- 1.2. Feed Additive and Spice
- 1.3. Pharmaceutical and Pesticide
- 1.4. Daily Necessities and Others
-
2. Type
- 2.1. Ethylene Hydrogenation Method
- 2.2. Other Compounds Byproduct Method
N Propanol Segmentation By Geography
-
1. North America
- 1.1. United States
- 1.2. Canada
- 1.3. Mexico
-
2. South America
- 2.1. Brazil
- 2.2. Argentina
- 2.3. Rest of South America
-
3. Europe
- 3.1. United Kingdom
- 3.2. Germany
- 3.3. France
- 3.4. Italy
- 3.5. Spain
- 3.6. Russia
- 3.7. Benelux
- 3.8. Nordics
- 3.9. Rest of Europe
-
4. Middle East & Africa
- 4.1. Turkey
- 4.2. Israel
- 4.3. GCC
- 4.4. North Africa
- 4.5. South Africa
- 4.6. Rest of Middle East & Africa
-
5. Asia Pacific
- 5.1. China
- 5.2. India
- 5.3. Japan
- 5.4. South Korea
- 5.5. ASEAN
- 5.6. Oceania
- 5.7. Rest of Asia Pacific
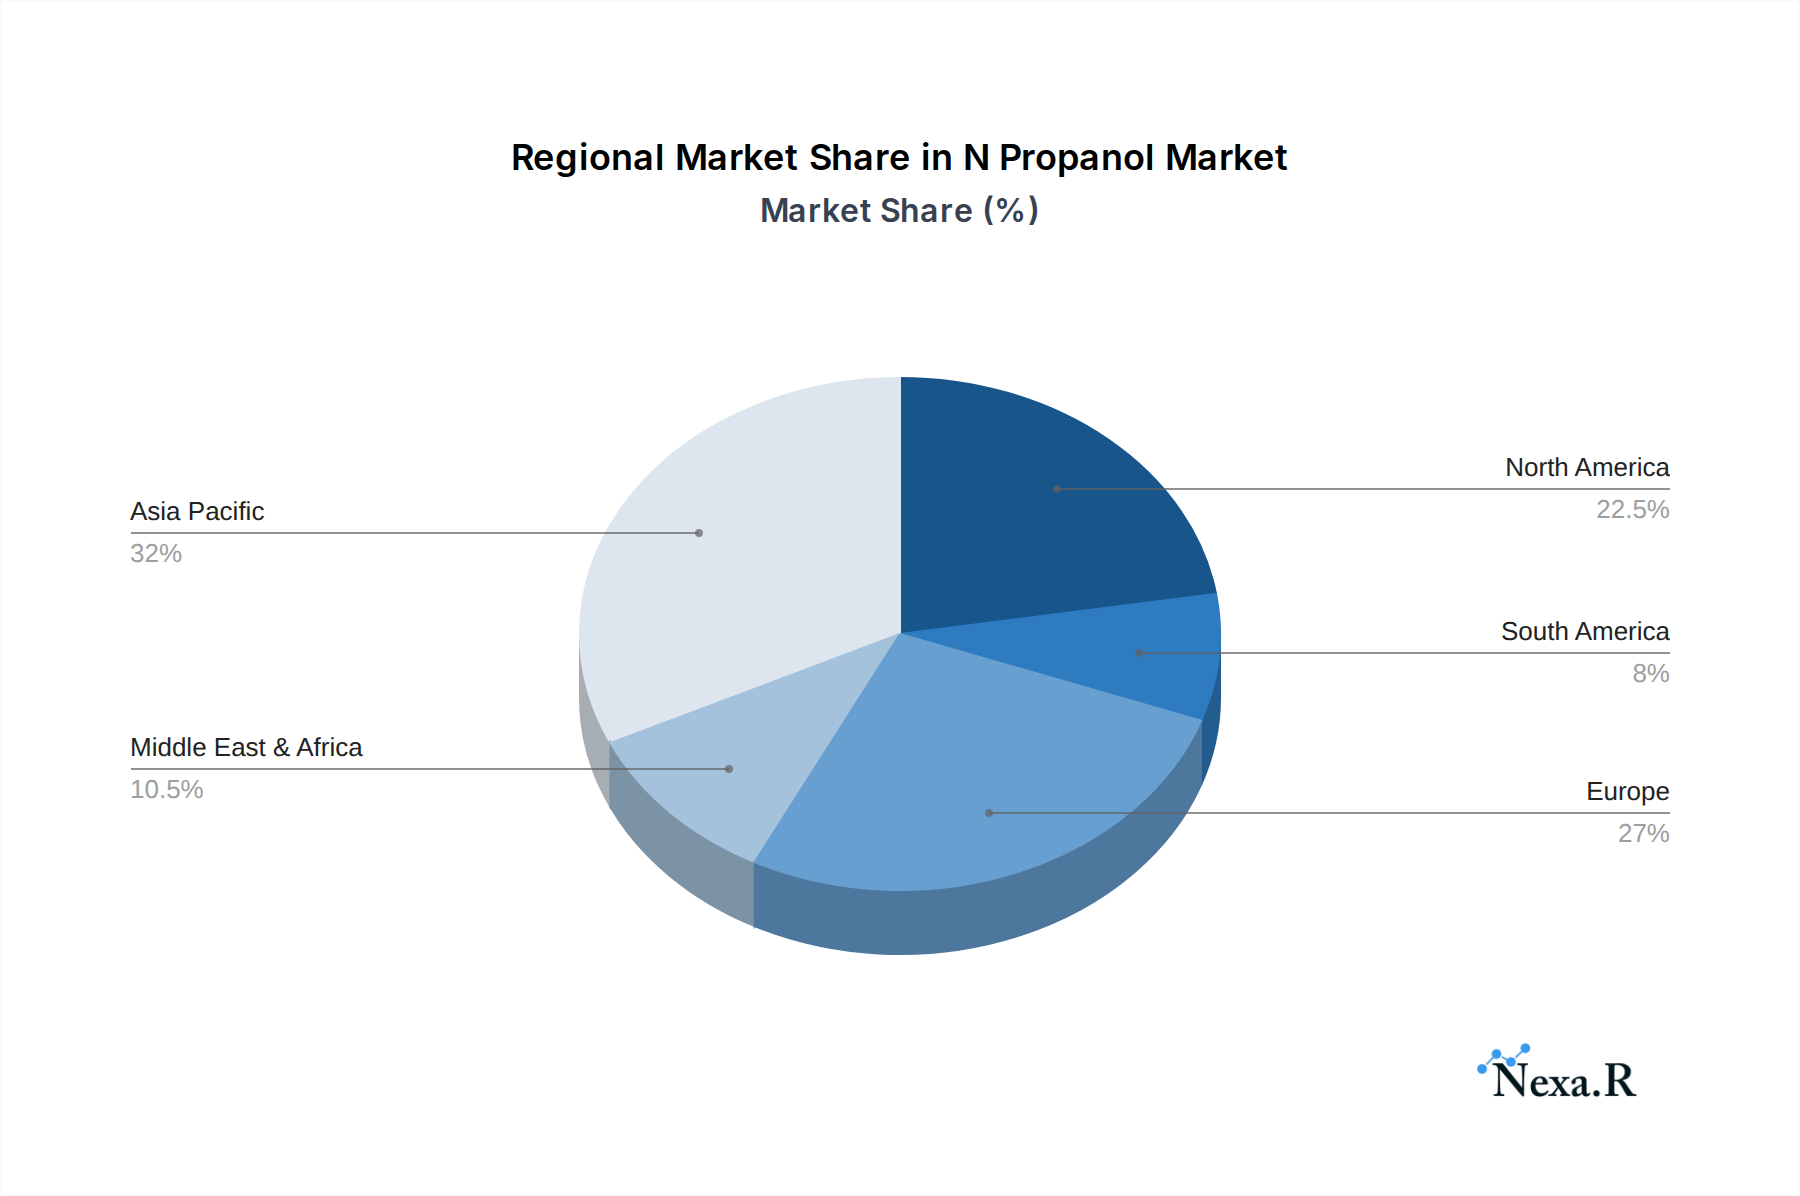
N Propanol Regional Market Share
Geographic Coverage of N Propanol
N Propanol REPORT HIGHLIGHTS
| Aspects | Details |
|---|---|
| Study Period | 2020-2034 |
| Base Year | 2025 |
| Estimated Year | 2026 |
| Forecast Period | 2026-2034 |
| Historical Period | 2020-2025 |
| Growth Rate | CAGR of 2.9% from 2020-2034 |
| Segmentation |
|
Table of Contents
- 1. Introduction
- 1.1. Research Scope
- 1.2. Market Segmentation
- 1.3. Research Objective
- 1.4. Definitions and Assumptions
- 2. Executive Summary
- 2.1. Market Snapshot
- 3. Market Dynamics
- 3.1. Market Drivers
- 3.2. Market Restrains
- 3.3. Market Trends
- 3.4. Market Opportunities
- 4. Market Factor Analysis
- 4.1. Porters Five Forces
- 4.1.1. Bargaining Power of Suppliers
- 4.1.2. Bargaining Power of Buyers
- 4.1.3. Threat of New Entrants
- 4.1.4. Threat of Substitutes
- 4.1.5. Competitive Rivalry
- 4.2. PESTEL analysis
- 4.3. BCG Analysis
- 4.3.1. Stars (High Growth, High Market Share)
- 4.3.2. Cash Cows (Low Growth, High Market Share)
- 4.3.3. Question Mark (High Growth, Low Market Share)
- 4.3.4. Dogs (Low Growth, Low Market Share)
- 4.4. Ansoff Matrix Analysis
- 4.5. Supply Chain Analysis
- 4.6. Regulatory Landscape
- 4.7. Current Market Potential and Opportunity Assessment (TAM–SAM–SOM Framework)
- 4.8. NRP Analyst Note
- 4.1. Porters Five Forces
- 5. Market Analysis, Insights and Forecast 2021-2033
- 5.1. Market Analysis, Insights and Forecast - by Application
- 5.1.1. Coatings & Printing Ink
- 5.1.2. Feed Additive and Spice
- 5.1.3. Pharmaceutical and Pesticide
- 5.1.4. Daily Necessities and Others
- 5.2. Market Analysis, Insights and Forecast - by Type
- 5.2.1. Ethylene Hydrogenation Method
- 5.2.2. Other Compounds Byproduct Method
- 5.3. Market Analysis, Insights and Forecast - by Region
- 5.3.1. North America
- 5.3.2. South America
- 5.3.3. Europe
- 5.3.4. Middle East & Africa
- 5.3.5. Asia Pacific
- 5.1. Market Analysis, Insights and Forecast - by Application
- 6. Global N Propanol Analysis, Insights and Forecast, 2021-2033
- 6.1. Market Analysis, Insights and Forecast - by Application
- 6.1.1. Coatings & Printing Ink
- 6.1.2. Feed Additive and Spice
- 6.1.3. Pharmaceutical and Pesticide
- 6.1.4. Daily Necessities and Others
- 6.2. Market Analysis, Insights and Forecast - by Type
- 6.2.1. Ethylene Hydrogenation Method
- 6.2.2. Other Compounds Byproduct Method
- 6.1. Market Analysis, Insights and Forecast - by Application
- 7. North America N Propanol Analysis, Insights and Forecast, 2020-2032
- 7.1. Market Analysis, Insights and Forecast - by Application
- 7.1.1. Coatings & Printing Ink
- 7.1.2. Feed Additive and Spice
- 7.1.3. Pharmaceutical and Pesticide
- 7.1.4. Daily Necessities and Others
- 7.2. Market Analysis, Insights and Forecast - by Type
- 7.2.1. Ethylene Hydrogenation Method
- 7.2.2. Other Compounds Byproduct Method
- 7.1. Market Analysis, Insights and Forecast - by Application
- 8. South America N Propanol Analysis, Insights and Forecast, 2020-2032
- 8.1. Market Analysis, Insights and Forecast - by Application
- 8.1.1. Coatings & Printing Ink
- 8.1.2. Feed Additive and Spice
- 8.1.3. Pharmaceutical and Pesticide
- 8.1.4. Daily Necessities and Others
- 8.2. Market Analysis, Insights and Forecast - by Type
- 8.2.1. Ethylene Hydrogenation Method
- 8.2.2. Other Compounds Byproduct Method
- 8.1. Market Analysis, Insights and Forecast - by Application
- 9. Europe N Propanol Analysis, Insights and Forecast, 2020-2032
- 9.1. Market Analysis, Insights and Forecast - by Application
- 9.1.1. Coatings & Printing Ink
- 9.1.2. Feed Additive and Spice
- 9.1.3. Pharmaceutical and Pesticide
- 9.1.4. Daily Necessities and Others
- 9.2. Market Analysis, Insights and Forecast - by Type
- 9.2.1. Ethylene Hydrogenation Method
- 9.2.2. Other Compounds Byproduct Method
- 9.1. Market Analysis, Insights and Forecast - by Application
- 10. Middle East & Africa N Propanol Analysis, Insights and Forecast, 2020-2032
- 10.1. Market Analysis, Insights and Forecast - by Application
- 10.1.1. Coatings & Printing Ink
- 10.1.2. Feed Additive and Spice
- 10.1.3. Pharmaceutical and Pesticide
- 10.1.4. Daily Necessities and Others
- 10.2. Market Analysis, Insights and Forecast - by Type
- 10.2.1. Ethylene Hydrogenation Method
- 10.2.2. Other Compounds Byproduct Method
- 10.1. Market Analysis, Insights and Forecast - by Application
- 11. Asia Pacific N Propanol Analysis, Insights and Forecast, 2020-2032
- 11.1. Market Analysis, Insights and Forecast - by Application
- 11.1.1. Coatings & Printing Ink
- 11.1.2. Feed Additive and Spice
- 11.1.3. Pharmaceutical and Pesticide
- 11.1.4. Daily Necessities and Others
- 11.2. Market Analysis, Insights and Forecast - by Type
- 11.2.1. Ethylene Hydrogenation Method
- 11.2.2. Other Compounds Byproduct Method
- 11.1. Market Analysis, Insights and Forecast - by Application
- 12. Competitive Analysis
- 12.1. Company Profiles
- 12.1.1 BASF
- 12.1.1.1. Company Overview
- 12.1.1.2. Products
- 12.1.1.3. Company Financials
- 12.1.1.4. SWOT Analysis
- 12.1.2 DuPont
- 12.1.2.1. Company Overview
- 12.1.2.2. Products
- 12.1.2.3. Company Financials
- 12.1.2.4. SWOT Analysis
- 12.1.3 Eastman
- 12.1.3.1. Company Overview
- 12.1.3.2. Products
- 12.1.3.3. Company Financials
- 12.1.3.4. SWOT Analysis
- 12.1.4 OXEA
- 12.1.4.1. Company Overview
- 12.1.4.2. Products
- 12.1.4.3. Company Financials
- 12.1.4.4. SWOT Analysis
- 12.1.5 Sasol
- 12.1.5.1. Company Overview
- 12.1.5.2. Products
- 12.1.5.3. Company Financials
- 12.1.5.4. SWOT Analysis
- 12.1.6 Wu Jiang Chemical
- 12.1.6.1. Company Overview
- 12.1.6.2. Products
- 12.1.6.3. Company Financials
- 12.1.6.4. SWOT Analysis
- 12.1.7 Zibo Nalcohol Chemical
- 12.1.7.1. Company Overview
- 12.1.7.2. Products
- 12.1.7.3. Company Financials
- 12.1.7.4. SWOT Analysis
- 12.1.8 DAIREN CHEMICAL
- 12.1.8.1. Company Overview
- 12.1.8.2. Products
- 12.1.8.3. Company Financials
- 12.1.8.4. SWOT Analysis
- 12.1.1 BASF
- 12.2. Market Entropy
- 12.2.1 Company's Key Areas Served
- 12.2.2 Recent Developments
- 12.3. Company Market Share Analysis 2025
- 12.3.1 Top 5 Companies Market Share Analysis
- 12.3.2 Top 3 Companies Market Share Analysis
- 12.4. List of Potential Customers
- 13. Research Methodology
List of Figures
- Figure 1: Global N Propanol Revenue Breakdown (million, %) by Region 2025 & 2033
- Figure 2: North America N Propanol Revenue (million), by Application 2025 & 2033
- Figure 3: North America N Propanol Revenue Share (%), by Application 2025 & 2033
- Figure 4: North America N Propanol Revenue (million), by Type 2025 & 2033
- Figure 5: North America N Propanol Revenue Share (%), by Type 2025 & 2033
- Figure 6: North America N Propanol Revenue (million), by Country 2025 & 2033
- Figure 7: North America N Propanol Revenue Share (%), by Country 2025 & 2033
- Figure 8: South America N Propanol Revenue (million), by Application 2025 & 2033
- Figure 9: South America N Propanol Revenue Share (%), by Application 2025 & 2033
- Figure 10: South America N Propanol Revenue (million), by Type 2025 & 2033
- Figure 11: South America N Propanol Revenue Share (%), by Type 2025 & 2033
- Figure 12: South America N Propanol Revenue (million), by Country 2025 & 2033
- Figure 13: South America N Propanol Revenue Share (%), by Country 2025 & 2033
- Figure 14: Europe N Propanol Revenue (million), by Application 2025 & 2033
- Figure 15: Europe N Propanol Revenue Share (%), by Application 2025 & 2033
- Figure 16: Europe N Propanol Revenue (million), by Type 2025 & 2033
- Figure 17: Europe N Propanol Revenue Share (%), by Type 2025 & 2033
- Figure 18: Europe N Propanol Revenue (million), by Country 2025 & 2033
- Figure 19: Europe N Propanol Revenue Share (%), by Country 2025 & 2033
- Figure 20: Middle East & Africa N Propanol Revenue (million), by Application 2025 & 2033
- Figure 21: Middle East & Africa N Propanol Revenue Share (%), by Application 2025 & 2033
- Figure 22: Middle East & Africa N Propanol Revenue (million), by Type 2025 & 2033
- Figure 23: Middle East & Africa N Propanol Revenue Share (%), by Type 2025 & 2033
- Figure 24: Middle East & Africa N Propanol Revenue (million), by Country 2025 & 2033
- Figure 25: Middle East & Africa N Propanol Revenue Share (%), by Country 2025 & 2033
- Figure 26: Asia Pacific N Propanol Revenue (million), by Application 2025 & 2033
- Figure 27: Asia Pacific N Propanol Revenue Share (%), by Application 2025 & 2033
- Figure 28: Asia Pacific N Propanol Revenue (million), by Type 2025 & 2033
- Figure 29: Asia Pacific N Propanol Revenue Share (%), by Type 2025 & 2033
- Figure 30: Asia Pacific N Propanol Revenue (million), by Country 2025 & 2033
- Figure 31: Asia Pacific N Propanol Revenue Share (%), by Country 2025 & 2033
List of Tables
- Table 1: Global N Propanol Revenue million Forecast, by Application 2020 & 2033
- Table 2: Global N Propanol Revenue million Forecast, by Type 2020 & 2033
- Table 3: Global N Propanol Revenue million Forecast, by Region 2020 & 2033
- Table 4: Global N Propanol Revenue million Forecast, by Application 2020 & 2033
- Table 5: Global N Propanol Revenue million Forecast, by Type 2020 & 2033
- Table 6: Global N Propanol Revenue million Forecast, by Country 2020 & 2033
- Table 7: United States N Propanol Revenue (million) Forecast, by Application 2020 & 2033
- Table 8: Canada N Propanol Revenue (million) Forecast, by Application 2020 & 2033
- Table 9: Mexico N Propanol Revenue (million) Forecast, by Application 2020 & 2033
- Table 10: Global N Propanol Revenue million Forecast, by Application 2020 & 2033
- Table 11: Global N Propanol Revenue million Forecast, by Type 2020 & 2033
- Table 12: Global N Propanol Revenue million Forecast, by Country 2020 & 2033
- Table 13: Brazil N Propanol Revenue (million) Forecast, by Application 2020 & 2033
- Table 14: Argentina N Propanol Revenue (million) Forecast, by Application 2020 & 2033
- Table 15: Rest of South America N Propanol Revenue (million) Forecast, by Application 2020 & 2033
- Table 16: Global N Propanol Revenue million Forecast, by Application 2020 & 2033
- Table 17: Global N Propanol Revenue million Forecast, by Type 2020 & 2033
- Table 18: Global N Propanol Revenue million Forecast, by Country 2020 & 2033
- Table 19: United Kingdom N Propanol Revenue (million) Forecast, by Application 2020 & 2033
- Table 20: Germany N Propanol Revenue (million) Forecast, by Application 2020 & 2033
- Table 21: France N Propanol Revenue (million) Forecast, by Application 2020 & 2033
- Table 22: Italy N Propanol Revenue (million) Forecast, by Application 2020 & 2033
- Table 23: Spain N Propanol Revenue (million) Forecast, by Application 2020 & 2033
- Table 24: Russia N Propanol Revenue (million) Forecast, by Application 2020 & 2033
- Table 25: Benelux N Propanol Revenue (million) Forecast, by Application 2020 & 2033
- Table 26: Nordics N Propanol Revenue (million) Forecast, by Application 2020 & 2033
- Table 27: Rest of Europe N Propanol Revenue (million) Forecast, by Application 2020 & 2033
- Table 28: Global N Propanol Revenue million Forecast, by Application 2020 & 2033
- Table 29: Global N Propanol Revenue million Forecast, by Type 2020 & 2033
- Table 30: Global N Propanol Revenue million Forecast, by Country 2020 & 2033
- Table 31: Turkey N Propanol Revenue (million) Forecast, by Application 2020 & 2033
- Table 32: Israel N Propanol Revenue (million) Forecast, by Application 2020 & 2033
- Table 33: GCC N Propanol Revenue (million) Forecast, by Application 2020 & 2033
- Table 34: North Africa N Propanol Revenue (million) Forecast, by Application 2020 & 2033
- Table 35: South Africa N Propanol Revenue (million) Forecast, by Application 2020 & 2033
- Table 36: Rest of Middle East & Africa N Propanol Revenue (million) Forecast, by Application 2020 & 2033
- Table 37: Global N Propanol Revenue million Forecast, by Application 2020 & 2033
- Table 38: Global N Propanol Revenue million Forecast, by Type 2020 & 2033
- Table 39: Global N Propanol Revenue million Forecast, by Country 2020 & 2033
- Table 40: China N Propanol Revenue (million) Forecast, by Application 2020 & 2033
- Table 41: India N Propanol Revenue (million) Forecast, by Application 2020 & 2033
- Table 42: Japan N Propanol Revenue (million) Forecast, by Application 2020 & 2033
- Table 43: South Korea N Propanol Revenue (million) Forecast, by Application 2020 & 2033
- Table 44: ASEAN N Propanol Revenue (million) Forecast, by Application 2020 & 2033
- Table 45: Oceania N Propanol Revenue (million) Forecast, by Application 2020 & 2033
- Table 46: Rest of Asia Pacific N Propanol Revenue (million) Forecast, by Application 2020 & 2033
Frequently Asked Questions
1. What is the projected Compound Annual Growth Rate (CAGR) of the N Propanol?
The projected CAGR is approximately 2.9%.
2. Which companies are prominent players in the N Propanol?
Key companies in the market include BASF, DuPont, Eastman, OXEA, Sasol, Wu Jiang Chemical, Zibo Nalcohol Chemical, DAIREN CHEMICAL.
3. What are the main segments of the N Propanol?
The market segments include Application, Type.
4. Can you provide details about the market size?
The market size is estimated to be USD 1149 million as of 2022.
5. What are some drivers contributing to market growth?
N/A
6. What are the notable trends driving market growth?
N/A
7. Are there any restraints impacting market growth?
N/A
8. Can you provide examples of recent developments in the market?
N/A
9. What pricing options are available for accessing the report?
Pricing options include single-user, multi-user, and enterprise licenses priced at USD 4250.00, USD 6375.00, and USD 8500.00 respectively.
10. Is the market size provided in terms of value or volume?
The market size is provided in terms of value, measured in million.
11. Are there any specific market keywords associated with the report?
Yes, the market keyword associated with the report is "N Propanol," which aids in identifying and referencing the specific market segment covered.
12. How do I determine which pricing option suits my needs best?
The pricing options vary based on user requirements and access needs. Individual users may opt for single-user licenses, while businesses requiring broader access may choose multi-user or enterprise licenses for cost-effective access to the report.
13. Are there any additional resources or data provided in the N Propanol report?
While the report offers comprehensive insights, it's advisable to review the specific contents or supplementary materials provided to ascertain if additional resources or data are available.
14. How can I stay updated on further developments or reports in the N Propanol?
To stay informed about further developments, trends, and reports in the N Propanol, consider subscribing to industry newsletters, following relevant companies and organizations, or regularly checking reputable industry news sources and publications.
Methodology
Step 1 - Identification of Relevant Samples Size from Population Database


Step 2 - Approaches for Defining Global Market Size (Value, Volume* & Price*)

Note*: In applicable scenarios
Step 3 - Data Sources
Primary Research
- Web Analytics
- Survey Reports
- Research Institute
- Latest Research Reports
- Opinion Leaders
Secondary Research
- Annual Reports
- White Paper
- Latest Press Release
- Industry Association
- Paid Database
- Investor Presentations

Step 4 - Data Triangulation
Involves using different sources of information in order to increase the validity of a study
These sources are likely to be stakeholders in a program - participants, other researchers, program staff, other community members, and so on.
Then we put all data in single framework & apply various statistical tools to find out the dynamic on the market.
During the analysis stage, feedback from the stakeholder groups would be compared to determine areas of agreement as well as areas of divergence