

Key Insights
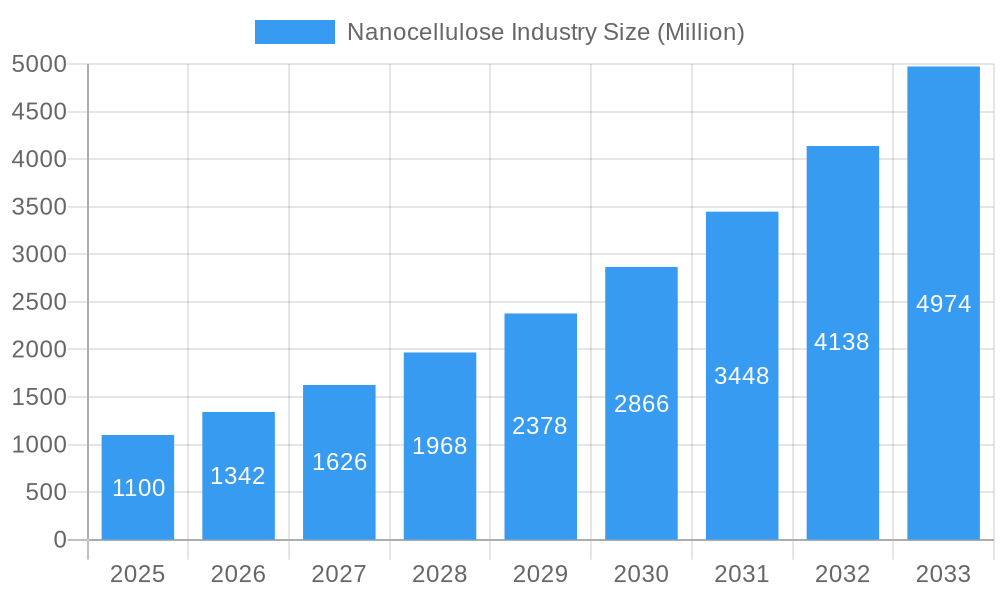
The nanocellulose industry is experiencing robust growth, projected to reach a market size of $1.1 billion in 2025 and maintain a Compound Annual Growth Rate (CAGR) exceeding 20% through 2033. This rapid expansion is driven by the material's unique properties – high strength, lightweight nature, biodegradability, and renewability – making it a compelling alternative to traditional materials in various applications. Key drivers include increasing demand for sustainable and eco-friendly materials across diverse sectors like packaging, construction, automotive, and biomedical engineering. Emerging trends such as advancements in nanocellulose production techniques, leading to lower manufacturing costs and improved material properties, further propel market growth. While challenges exist, such as scaling up production to meet rising demand and establishing consistent quality control, the industry is actively addressing these restraints through ongoing research and development initiatives and strategic collaborations between research institutions and industry players. The diverse applications and ongoing innovations ensure sustained growth across various segments, including films, fibers, and hydrogels. Leading players like GranBio Technologies, Borregaard, and CelluForce are actively investing in capacity expansion and product diversification to capitalize on this burgeoning market.
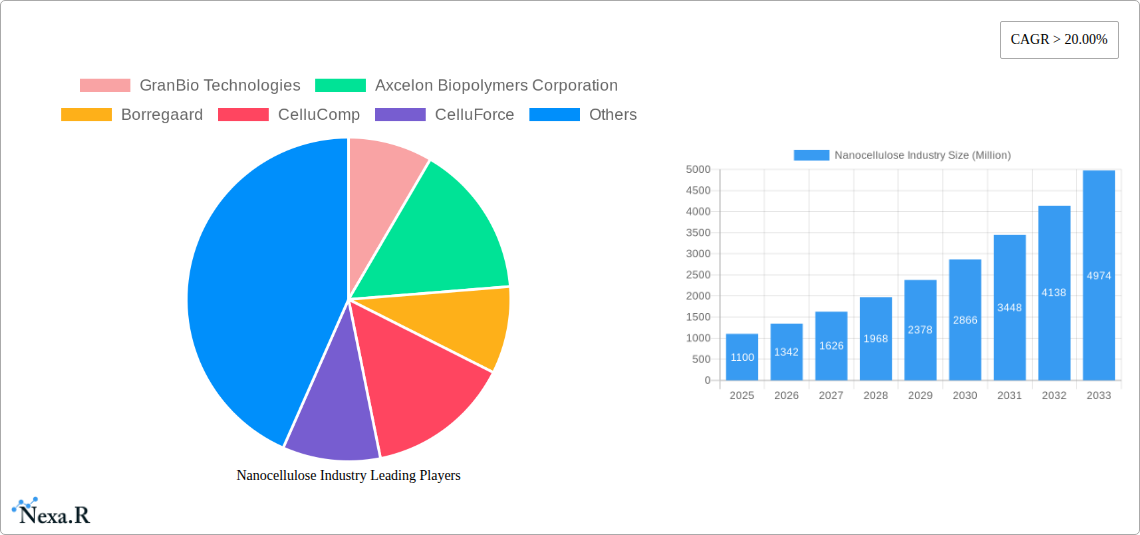
Nanocellulose Industry Market Size (In Billion)
The competitive landscape is characterized by a mix of established players and emerging companies. Established players leverage their existing infrastructure and expertise to maintain market share, while innovative startups introduce novel products and applications. Geographic distribution is expected to be broadly spread, with North America and Europe holding significant market shares initially, followed by a rise in Asia-Pacific due to increasing demand and manufacturing activities. The forecast period (2025-2033) will witness a continued surge in nanocellulose adoption, driven by sustained technological advancements, favorable regulatory environments promoting sustainable materials, and growing consumer awareness of environmentally friendly products. This will result in significant market expansion across different segments and geographies.
Nanocellulose Industry Company Market Share
Nanocellulose Industry Market Report: 2019-2033
This comprehensive report provides an in-depth analysis of the Nanocellulose Industry, encompassing market dynamics, growth trends, regional dominance, product landscape, key challenges, emerging opportunities, and key players. The study period covers 2019-2033, with a base year of 2025 and a forecast period of 2025-2033. The report leverages extensive primary and secondary research to deliver actionable insights for industry professionals, investors, and stakeholders. The parent market is the broader bio-based materials sector, while the child market focuses specifically on nanocellulose applications across various industries. The total market size in 2025 is estimated at $xx Million, projected to reach $xx Million by 2033.
Nanocellulose Industry Market Dynamics & Structure
The nanocellulose market is characterized by a dynamic interplay of forces. While currently exhibiting moderate concentration, it is a landscape ripe for disruption by emerging technologies and strategic consolidations. Key players are actively engaged in a race for market share, driven primarily by relentless technological innovation. Advancements in both the production methods of nanocellulose and the discovery of novel applications are not just growth drivers but are fundamentally reshaping the industry.
Furthermore, the growing global imperative for sustainability is a significant tailwind for nanocellulose. Stringent environmental regulations worldwide are increasingly pushing industries towards bio-based and biodegradable materials, with nanocellulose emerging as a frontrunner. However, the market is not without its challenges. The availability of competitive substitutes, including advanced synthetic polymers and other bio-based materials, necessitates continuous innovation and cost-effectiveness. Simultaneously, end-user demographics are rapidly expanding, with an ever-increasing demand emanating from a diverse array of sectors seeking enhanced material performance and environmental credentials. M&A activity, though currently moderate, is strategically focused on enhancing technological capabilities, securing intellectual property, and expanding global market reach.
- Market Concentration: Moderately Concentrated, with significant opportunities for both established and emerging players to capture market share. (Estimated xx% market share held by top 5 players in 2025, subject to change with industry evolution).
- Technological Innovation: A cornerstone of market evolution, with continuous, significant advancements in production techniques (e.g., enzymatic, mechanical, templating methods) and groundbreaking application development across various sectors.
- Regulatory Framework: Increasingly stringent environmental regulations globally are a powerful catalyst, favoring the adoption of sustainable, bio-based alternatives like nanocellulose and driving demand for circular economy solutions.
- Competitive Substitutes: A dynamic competitive landscape includes advanced synthetic polymers, other bio-based materials (e.g., starch, lignin, chitin), and traditional materials. Innovation and performance differentiation are key to maintaining market position.
- End-User Demographics: Rapidly expanding demand from a widening array of sectors, including high-growth areas like advanced packaging, lightweight construction materials, automotive components, textiles, electronics, and biomedical applications.
- M&A Trends: Moderate but strategic M&A activity, focused on acquiring cutting-edge technologies, consolidating value chains, expanding production capacity, and strengthening market presence. (Estimated xx M&A deals observed between 2019-2024, indicating an active consolidation phase).
Nanocellulose Industry Growth Trends & Insights
The global nanocellulose market has demonstrated robust and significant growth throughout the historical period (2019-2024), a trend driven by the escalating demand for materials that are not only high-performing but also environmentally sustainable. Looking ahead, the market is poised for continued expansion, with projections indicating a Compound Annual Growth Rate (CAGR) of approximately xx% during the forecast period (2025-2033). This impressive growth trajectory is underpinned by several key factors: ongoing technological advancements in nanocellulose production and application, a burgeoning consumer awareness regarding the benefits of eco-friendly products, and supportive government initiatives worldwide that actively promote sustainable material solutions.
Disruptive technologies are playing a pivotal role in reshaping the market landscape. Innovations in more efficient and cost-effective nanocellulose production methods, alongside the development of novel applications in diverse fields, are key catalysts. Furthermore, a pronounced shift in consumer preferences towards sustainable and ethically produced goods is significantly accelerating the adoption of nanocellulose across various industries. Market penetration is expected to reach an impressive xx% by 2033, signifying its transition from a niche material to a mainstream component in a wide array of products.
Dominant Regions, Countries, or Segments in Nanocellulose Industry
Currently, North America stands as the dominant force in the nanocellulose market. This leadership is attributed to a confluence of factors, including robust government support for renewable and bio-based materials, substantial investments in research and development, and the significant presence of pioneering key players within the region. Europe and the Asia-Pacific region are also experiencing considerable and accelerating growth. This expansion is fueled by increasing industrialization, a heightened focus on sustainability and circular economy principles, and the growing adoption of advanced materials in manufacturing. Within these broader regions, specific countries such as Canada, Finland, and China are exhibiting particularly promising and dynamic growth potential, driven by their strategic investments and forward-thinking policies.
- Key Drivers by Region:
- North America: Strong government initiatives promoting renewable materials, substantial investments in R&D, and a well-established ecosystem of key industry players and research institutions.
- Europe: Stringent environmental regulations driving demand for sustainable products, a strong focus on the circular economy, and significant innovation in bio-based materials.
- Asia-Pacific: Rapid industrialization and economic growth, coupled with rising consumer awareness and government initiatives promoting sustainable and advanced materials.
- Dominance Factors: Market share, high growth potential, favorable regulatory environments, significant technological advancements, and strategic investments in R&D are key determinants of regional dominance and growth.
Nanocellulose Industry Product Landscape
The product landscape of nanocellulose is one of continuous innovation and diversification. Ongoing research and development are focused on enhancing a broad spectrum of material properties, including superior mechanical strength, improved flexibility, tailored biodegradability, enhanced barrier properties, and unique optical characteristics. These advancements are opening up a vast array of applications, ranging from next-generation advanced packaging materials and lightweight, high-performance biocomposites to advanced functional coatings, filtration membranes, and sophisticated biomedical applications.
The unique selling propositions of nanocellulose products are compelling, offering unparalleled strength-to-weight ratios, exceptional lightweight characteristics, and inherent renewability, making them a sustainable alternative to conventional materials. Technological progress is not only focused on improving production efficiency and reducing costs but also on the sophisticated functionalization of nanocellulose. This allows for precise tailoring of its properties to meet the highly specific requirements of diverse and demanding applications, further solidifying its position as a versatile and high-value material.
Key Drivers, Barriers & Challenges in Nanocellulose Industry
Key Drivers:
- Growing demand for sustainable materials in various sectors.
- Rising consumer awareness of environmental issues.
- Technological advancements in nanocellulose production and applications.
- Government initiatives supporting renewable materials.
Key Challenges:
- High production costs compared to traditional materials.
- Scalability challenges in manufacturing.
- Lack of standardized testing methods.
- Competition from synthetic polymers and other substitutes (xx% market share in 2025).
Emerging Opportunities in Nanocellulose Industry
Emerging opportunities exist in untapped markets such as biomedical applications (drug delivery systems, tissue engineering), advanced electronics (flexible displays, sensors), and water purification. Innovative applications, such as utilizing nanocellulose in sustainable construction materials and packaging solutions, offer significant potential. Evolving consumer preferences toward eco-friendly products are driving further growth opportunities.
Growth Accelerators in the Nanocellulose Industry
Technological breakthroughs in nanocellulose production, such as improved efficiency and cost reduction, are crucial growth accelerators. Strategic partnerships between nanocellulose producers and end-users are facilitating market expansion. Government incentives and policies promoting sustainable materials are further driving market growth. Expansion into new markets and applications, especially in high-growth sectors, will significantly contribute to long-term growth.
Key Players Shaping the Nanocellulose Industry Market
- GranBio Technologies
- Axcelon Biopolymers Corporation
- Borregaard
- CelluComp
- CelluForce
- Chuetsu Pulp and Paper Co Ltd
- Daicel Finechem Ltd
- Fiberlean Technologies
- Melodea Ltd
- Nippon Paper Industries Co Ltd
- Norske Skog ASA
- Oji Holdings Corporation
- Sappi Ltd
- University of Maine
- *This list is not exhaustive and represents a selection of prominent entities in the evolving nanocellulose market.
Notable Milestones in Nanocellulose Industry Sector
- May 2022: Norske Skog ASA officially opened a new biocomposite plant, commercializing its nanocellulose product CEBINA.
- September 2023: Researchers from Nanjing Forestry University developed a nanocellulosic aerogel film for building cooling applications.
In-Depth Nanocellulose Industry Market Outlook
The nanocellulose industry is poised for substantial growth, driven by ongoing technological advancements, increasing demand for sustainable materials, and expanding applications across diverse sectors. Strategic partnerships, market expansion into new geographical areas, and the development of innovative products will play a crucial role in shaping the future of this dynamic market. The market's potential for significant expansion offers compelling investment opportunities and positions nanocellulose as a key player in the sustainable materials revolution.
Nanocellulose Industry Segmentation
-
1. End-user Industry
- 1.1. Paper Processing
- 1.2. Paints and Coatings
- 1.3. Oil and Gas
- 1.4. Food and Beverage
- 1.5. Composites
- 1.6. Pharmaceuticals and Cosmetics
- 1.7. Other End-user Industries
-
2. Product Type
- 2.1. Nanofibrillated Cellulose (NFC)
- 2.2. Nanocrystalline Cellulose (NCC)
- 2.3. Bacterial Cellulose
- 2.4. Microfibrillated Cellulose (MFC)
- 2.5. Other Product Types
Nanocellulose Industry Segmentation By Geography
-
1. Asia Pacific
- 1.1. China
- 1.2. India
- 1.3. Japan
- 1.4. South Korea
- 1.5. Malaysia
- 1.6. Thailand
- 1.7. Indonesia
- 1.8. Vietnam
- 1.9. Rest of Asia Pacific
-
2. North America
- 2.1. United States
- 2.2. Canada
- 2.3. Mexico
-
3. Europe
- 3.1. Germany
- 3.2. United Kingdom
- 3.3. France
- 3.4. Italy
- 3.5. Spain
- 3.6. NORDIC Countries
- 3.7. Turkey
- 3.8. Russia
- 3.9. Rest of Europe
-
4. South America
- 4.1. Brazil
- 4.2. Argentina
- 4.3. Colombia
- 4.4. Rest of South America
-
5. Middle East and Africa
- 5.1. Saudi Arabia
- 5.2. South Africa
- 5.3. Nigeria
- 5.4. Qatar
- 5.5. Egypt
- 5.6. United Arab Emirates
- 5.7. Rest of Middle East and Africa

Nanocellulose Industry Regional Market Share
Geographic Coverage of Nanocellulose Industry
Nanocellulose Industry REPORT HIGHLIGHTS
| Aspects | Details |
|---|---|
| Study Period | 2020-2034 |
| Base Year | 2025 |
| Estimated Year | 2026 |
| Forecast Period | 2026-2034 |
| Historical Period | 2020-2025 |
| Growth Rate | CAGR of > 20.00% from 2020-2034 |
| Segmentation |
|
Table of Contents
- 1. Introduction
- 1.1. Research Scope
- 1.2. Market Segmentation
- 1.3. Research Objective
- 1.4. Definitions and Assumptions
- 2. Executive Summary
- 2.1. Market Snapshot
- 3. Market Dynamics
- 3.1. Market Drivers
- 3.2. Market Restrains
- 3.3. Market Trends
- 3.4. Market Opportunities
- 4. Market Factor Analysis
- 4.1. Porters Five Forces
- 4.1.1. Bargaining Power of Suppliers
- 4.1.2. Bargaining Power of Buyers
- 4.1.3. Threat of New Entrants
- 4.1.4. Threat of Substitutes
- 4.1.5. Competitive Rivalry
- 4.2. PESTEL analysis
- 4.3. BCG Analysis
- 4.3.1. Stars (High Growth, High Market Share)
- 4.3.2. Cash Cows (Low Growth, High Market Share)
- 4.3.3. Question Mark (High Growth, Low Market Share)
- 4.3.4. Dogs (Low Growth, Low Market Share)
- 4.4. Ansoff Matrix Analysis
- 4.5. Supply Chain Analysis
- 4.6. Regulatory Landscape
- 4.7. Current Market Potential and Opportunity Assessment (TAM–SAM–SOM Framework)
- 4.8. NRP Analyst Note
- 4.1. Porters Five Forces
- 5. Market Analysis, Insights and Forecast 2021-2033
- 5.1. Market Analysis, Insights and Forecast - by End-user Industry
- 5.1.1. Paper Processing
- 5.1.2. Paints and Coatings
- 5.1.3. Oil and Gas
- 5.1.4. Food and Beverage
- 5.1.5. Composites
- 5.1.6. Pharmaceuticals and Cosmetics
- 5.1.7. Other End-user Industries
- 5.2. Market Analysis, Insights and Forecast - by Product Type
- 5.2.1. Nanofibrillated Cellulose (NFC)
- 5.2.2. Nanocrystalline Cellulose (NCC)
- 5.2.3. Bacterial Cellulose
- 5.2.4. Microfibrillated Cellulose (MFC)
- 5.2.5. Other Product Types
- 5.3. Market Analysis, Insights and Forecast - by Region
- 5.3.1. Asia Pacific
- 5.3.2. North America
- 5.3.3. Europe
- 5.3.4. South America
- 5.3.5. Middle East and Africa
- 5.1. Market Analysis, Insights and Forecast - by End-user Industry
- 6. Global Nanocellulose Industry Analysis, Insights and Forecast, 2021-2033
- 6.1. Market Analysis, Insights and Forecast - by End-user Industry
- 6.1.1. Paper Processing
- 6.1.2. Paints and Coatings
- 6.1.3. Oil and Gas
- 6.1.4. Food and Beverage
- 6.1.5. Composites
- 6.1.6. Pharmaceuticals and Cosmetics
- 6.1.7. Other End-user Industries
- 6.2. Market Analysis, Insights and Forecast - by Product Type
- 6.2.1. Nanofibrillated Cellulose (NFC)
- 6.2.2. Nanocrystalline Cellulose (NCC)
- 6.2.3. Bacterial Cellulose
- 6.2.4. Microfibrillated Cellulose (MFC)
- 6.2.5. Other Product Types
- 6.1. Market Analysis, Insights and Forecast - by End-user Industry
- 7. Asia Pacific Nanocellulose Industry Analysis, Insights and Forecast, 2020-2032
- 7.1. Market Analysis, Insights and Forecast - by End-user Industry
- 7.1.1. Paper Processing
- 7.1.2. Paints and Coatings
- 7.1.3. Oil and Gas
- 7.1.4. Food and Beverage
- 7.1.5. Composites
- 7.1.6. Pharmaceuticals and Cosmetics
- 7.1.7. Other End-user Industries
- 7.2. Market Analysis, Insights and Forecast - by Product Type
- 7.2.1. Nanofibrillated Cellulose (NFC)
- 7.2.2. Nanocrystalline Cellulose (NCC)
- 7.2.3. Bacterial Cellulose
- 7.2.4. Microfibrillated Cellulose (MFC)
- 7.2.5. Other Product Types
- 7.1. Market Analysis, Insights and Forecast - by End-user Industry
- 8. North America Nanocellulose Industry Analysis, Insights and Forecast, 2020-2032
- 8.1. Market Analysis, Insights and Forecast - by End-user Industry
- 8.1.1. Paper Processing
- 8.1.2. Paints and Coatings
- 8.1.3. Oil and Gas
- 8.1.4. Food and Beverage
- 8.1.5. Composites
- 8.1.6. Pharmaceuticals and Cosmetics
- 8.1.7. Other End-user Industries
- 8.2. Market Analysis, Insights and Forecast - by Product Type
- 8.2.1. Nanofibrillated Cellulose (NFC)
- 8.2.2. Nanocrystalline Cellulose (NCC)
- 8.2.3. Bacterial Cellulose
- 8.2.4. Microfibrillated Cellulose (MFC)
- 8.2.5. Other Product Types
- 8.1. Market Analysis, Insights and Forecast - by End-user Industry
- 9. Europe Nanocellulose Industry Analysis, Insights and Forecast, 2020-2032
- 9.1. Market Analysis, Insights and Forecast - by End-user Industry
- 9.1.1. Paper Processing
- 9.1.2. Paints and Coatings
- 9.1.3. Oil and Gas
- 9.1.4. Food and Beverage
- 9.1.5. Composites
- 9.1.6. Pharmaceuticals and Cosmetics
- 9.1.7. Other End-user Industries
- 9.2. Market Analysis, Insights and Forecast - by Product Type
- 9.2.1. Nanofibrillated Cellulose (NFC)
- 9.2.2. Nanocrystalline Cellulose (NCC)
- 9.2.3. Bacterial Cellulose
- 9.2.4. Microfibrillated Cellulose (MFC)
- 9.2.5. Other Product Types
- 9.1. Market Analysis, Insights and Forecast - by End-user Industry
- 10. South America Nanocellulose Industry Analysis, Insights and Forecast, 2020-2032
- 10.1. Market Analysis, Insights and Forecast - by End-user Industry
- 10.1.1. Paper Processing
- 10.1.2. Paints and Coatings
- 10.1.3. Oil and Gas
- 10.1.4. Food and Beverage
- 10.1.5. Composites
- 10.1.6. Pharmaceuticals and Cosmetics
- 10.1.7. Other End-user Industries
- 10.2. Market Analysis, Insights and Forecast - by Product Type
- 10.2.1. Nanofibrillated Cellulose (NFC)
- 10.2.2. Nanocrystalline Cellulose (NCC)
- 10.2.3. Bacterial Cellulose
- 10.2.4. Microfibrillated Cellulose (MFC)
- 10.2.5. Other Product Types
- 10.1. Market Analysis, Insights and Forecast - by End-user Industry
- 11. Middle East and Africa Nanocellulose Industry Analysis, Insights and Forecast, 2020-2032
- 11.1. Market Analysis, Insights and Forecast - by End-user Industry
- 11.1.1. Paper Processing
- 11.1.2. Paints and Coatings
- 11.1.3. Oil and Gas
- 11.1.4. Food and Beverage
- 11.1.5. Composites
- 11.1.6. Pharmaceuticals and Cosmetics
- 11.1.7. Other End-user Industries
- 11.2. Market Analysis, Insights and Forecast - by Product Type
- 11.2.1. Nanofibrillated Cellulose (NFC)
- 11.2.2. Nanocrystalline Cellulose (NCC)
- 11.2.3. Bacterial Cellulose
- 11.2.4. Microfibrillated Cellulose (MFC)
- 11.2.5. Other Product Types
- 11.1. Market Analysis, Insights and Forecast - by End-user Industry
- 12. Competitive Analysis
- 12.1. Company Profiles
- 12.1.1 GranBio Technologies
- 12.1.1.1. Company Overview
- 12.1.1.2. Products
- 12.1.1.3. Company Financials
- 12.1.1.4. SWOT Analysis
- 12.1.2 Axcelon Biopolymers Corporation
- 12.1.2.1. Company Overview
- 12.1.2.2. Products
- 12.1.2.3. Company Financials
- 12.1.2.4. SWOT Analysis
- 12.1.3 Borregaard
- 12.1.3.1. Company Overview
- 12.1.3.2. Products
- 12.1.3.3. Company Financials
- 12.1.3.4. SWOT Analysis
- 12.1.4 CelluComp
- 12.1.4.1. Company Overview
- 12.1.4.2. Products
- 12.1.4.3. Company Financials
- 12.1.4.4. SWOT Analysis
- 12.1.5 CelluForce
- 12.1.5.1. Company Overview
- 12.1.5.2. Products
- 12.1.5.3. Company Financials
- 12.1.5.4. SWOT Analysis
- 12.1.6 Chuetsu Pulp and Paper Co Ltd
- 12.1.6.1. Company Overview
- 12.1.6.2. Products
- 12.1.6.3. Company Financials
- 12.1.6.4. SWOT Analysis
- 12.1.7 Daicel Finechem Ltd
- 12.1.7.1. Company Overview
- 12.1.7.2. Products
- 12.1.7.3. Company Financials
- 12.1.7.4. SWOT Analysis
- 12.1.8 Fiberlean Technologies
- 12.1.8.1. Company Overview
- 12.1.8.2. Products
- 12.1.8.3. Company Financials
- 12.1.8.4. SWOT Analysis
- 12.1.9 Melodea Ltd
- 12.1.9.1. Company Overview
- 12.1.9.2. Products
- 12.1.9.3. Company Financials
- 12.1.9.4. SWOT Analysis
- 12.1.10 Nippon Paper Industries Co Ltd
- 12.1.10.1. Company Overview
- 12.1.10.2. Products
- 12.1.10.3. Company Financials
- 12.1.10.4. SWOT Analysis
- 12.1.11 Norske Skog ASA
- 12.1.11.1. Company Overview
- 12.1.11.2. Products
- 12.1.11.3. Company Financials
- 12.1.11.4. SWOT Analysis
- 12.1.12 Oji Holdings Corporation
- 12.1.12.1. Company Overview
- 12.1.12.2. Products
- 12.1.12.3. Company Financials
- 12.1.12.4. SWOT Analysis
- 12.1.13 Sappi Ltd
- 12.1.13.1. Company Overview
- 12.1.13.2. Products
- 12.1.13.3. Company Financials
- 12.1.13.4. SWOT Analysis
- 12.1.14 University of Maine*List Not Exhaustive
- 12.1.14.1. Company Overview
- 12.1.14.2. Products
- 12.1.14.3. Company Financials
- 12.1.14.4. SWOT Analysis
- 12.1.1 GranBio Technologies
- 12.2. Market Entropy
- 12.2.1 Company's Key Areas Served
- 12.2.2 Recent Developments
- 12.3. Company Market Share Analysis 2025
- 12.3.1 Top 5 Companies Market Share Analysis
- 12.3.2 Top 3 Companies Market Share Analysis
- 12.4. List of Potential Customers
- 13. Research Methodology
List of Figures
- Figure 1: Global Nanocellulose Industry Revenue Breakdown (Million, %) by Region 2025 & 2033
- Figure 2: Global Nanocellulose Industry Volume Breakdown (Billion, %) by Region 2025 & 2033
- Figure 3: Asia Pacific Nanocellulose Industry Revenue (Million), by End-user Industry 2025 & 2033
- Figure 4: Asia Pacific Nanocellulose Industry Volume (Billion), by End-user Industry 2025 & 2033
- Figure 5: Asia Pacific Nanocellulose Industry Revenue Share (%), by End-user Industry 2025 & 2033
- Figure 6: Asia Pacific Nanocellulose Industry Volume Share (%), by End-user Industry 2025 & 2033
- Figure 7: Asia Pacific Nanocellulose Industry Revenue (Million), by Product Type 2025 & 2033
- Figure 8: Asia Pacific Nanocellulose Industry Volume (Billion), by Product Type 2025 & 2033
- Figure 9: Asia Pacific Nanocellulose Industry Revenue Share (%), by Product Type 2025 & 2033
- Figure 10: Asia Pacific Nanocellulose Industry Volume Share (%), by Product Type 2025 & 2033
- Figure 11: Asia Pacific Nanocellulose Industry Revenue (Million), by Country 2025 & 2033
- Figure 12: Asia Pacific Nanocellulose Industry Volume (Billion), by Country 2025 & 2033
- Figure 13: Asia Pacific Nanocellulose Industry Revenue Share (%), by Country 2025 & 2033
- Figure 14: Asia Pacific Nanocellulose Industry Volume Share (%), by Country 2025 & 2033
- Figure 15: North America Nanocellulose Industry Revenue (Million), by End-user Industry 2025 & 2033
- Figure 16: North America Nanocellulose Industry Volume (Billion), by End-user Industry 2025 & 2033
- Figure 17: North America Nanocellulose Industry Revenue Share (%), by End-user Industry 2025 & 2033
- Figure 18: North America Nanocellulose Industry Volume Share (%), by End-user Industry 2025 & 2033
- Figure 19: North America Nanocellulose Industry Revenue (Million), by Product Type 2025 & 2033
- Figure 20: North America Nanocellulose Industry Volume (Billion), by Product Type 2025 & 2033
- Figure 21: North America Nanocellulose Industry Revenue Share (%), by Product Type 2025 & 2033
- Figure 22: North America Nanocellulose Industry Volume Share (%), by Product Type 2025 & 2033
- Figure 23: North America Nanocellulose Industry Revenue (Million), by Country 2025 & 2033
- Figure 24: North America Nanocellulose Industry Volume (Billion), by Country 2025 & 2033
- Figure 25: North America Nanocellulose Industry Revenue Share (%), by Country 2025 & 2033
- Figure 26: North America Nanocellulose Industry Volume Share (%), by Country 2025 & 2033
- Figure 27: Europe Nanocellulose Industry Revenue (Million), by End-user Industry 2025 & 2033
- Figure 28: Europe Nanocellulose Industry Volume (Billion), by End-user Industry 2025 & 2033
- Figure 29: Europe Nanocellulose Industry Revenue Share (%), by End-user Industry 2025 & 2033
- Figure 30: Europe Nanocellulose Industry Volume Share (%), by End-user Industry 2025 & 2033
- Figure 31: Europe Nanocellulose Industry Revenue (Million), by Product Type 2025 & 2033
- Figure 32: Europe Nanocellulose Industry Volume (Billion), by Product Type 2025 & 2033
- Figure 33: Europe Nanocellulose Industry Revenue Share (%), by Product Type 2025 & 2033
- Figure 34: Europe Nanocellulose Industry Volume Share (%), by Product Type 2025 & 2033
- Figure 35: Europe Nanocellulose Industry Revenue (Million), by Country 2025 & 2033
- Figure 36: Europe Nanocellulose Industry Volume (Billion), by Country 2025 & 2033
- Figure 37: Europe Nanocellulose Industry Revenue Share (%), by Country 2025 & 2033
- Figure 38: Europe Nanocellulose Industry Volume Share (%), by Country 2025 & 2033
- Figure 39: South America Nanocellulose Industry Revenue (Million), by End-user Industry 2025 & 2033
- Figure 40: South America Nanocellulose Industry Volume (Billion), by End-user Industry 2025 & 2033
- Figure 41: South America Nanocellulose Industry Revenue Share (%), by End-user Industry 2025 & 2033
- Figure 42: South America Nanocellulose Industry Volume Share (%), by End-user Industry 2025 & 2033
- Figure 43: South America Nanocellulose Industry Revenue (Million), by Product Type 2025 & 2033
- Figure 44: South America Nanocellulose Industry Volume (Billion), by Product Type 2025 & 2033
- Figure 45: South America Nanocellulose Industry Revenue Share (%), by Product Type 2025 & 2033
- Figure 46: South America Nanocellulose Industry Volume Share (%), by Product Type 2025 & 2033
- Figure 47: South America Nanocellulose Industry Revenue (Million), by Country 2025 & 2033
- Figure 48: South America Nanocellulose Industry Volume (Billion), by Country 2025 & 2033
- Figure 49: South America Nanocellulose Industry Revenue Share (%), by Country 2025 & 2033
- Figure 50: South America Nanocellulose Industry Volume Share (%), by Country 2025 & 2033
- Figure 51: Middle East and Africa Nanocellulose Industry Revenue (Million), by End-user Industry 2025 & 2033
- Figure 52: Middle East and Africa Nanocellulose Industry Volume (Billion), by End-user Industry 2025 & 2033
- Figure 53: Middle East and Africa Nanocellulose Industry Revenue Share (%), by End-user Industry 2025 & 2033
- Figure 54: Middle East and Africa Nanocellulose Industry Volume Share (%), by End-user Industry 2025 & 2033
- Figure 55: Middle East and Africa Nanocellulose Industry Revenue (Million), by Product Type 2025 & 2033
- Figure 56: Middle East and Africa Nanocellulose Industry Volume (Billion), by Product Type 2025 & 2033
- Figure 57: Middle East and Africa Nanocellulose Industry Revenue Share (%), by Product Type 2025 & 2033
- Figure 58: Middle East and Africa Nanocellulose Industry Volume Share (%), by Product Type 2025 & 2033
- Figure 59: Middle East and Africa Nanocellulose Industry Revenue (Million), by Country 2025 & 2033
- Figure 60: Middle East and Africa Nanocellulose Industry Volume (Billion), by Country 2025 & 2033
- Figure 61: Middle East and Africa Nanocellulose Industry Revenue Share (%), by Country 2025 & 2033
- Figure 62: Middle East and Africa Nanocellulose Industry Volume Share (%), by Country 2025 & 2033
List of Tables
- Table 1: Global Nanocellulose Industry Revenue Million Forecast, by End-user Industry 2020 & 2033
- Table 2: Global Nanocellulose Industry Volume Billion Forecast, by End-user Industry 2020 & 2033
- Table 3: Global Nanocellulose Industry Revenue Million Forecast, by Product Type 2020 & 2033
- Table 4: Global Nanocellulose Industry Volume Billion Forecast, by Product Type 2020 & 2033
- Table 5: Global Nanocellulose Industry Revenue Million Forecast, by Region 2020 & 2033
- Table 6: Global Nanocellulose Industry Volume Billion Forecast, by Region 2020 & 2033
- Table 7: Global Nanocellulose Industry Revenue Million Forecast, by End-user Industry 2020 & 2033
- Table 8: Global Nanocellulose Industry Volume Billion Forecast, by End-user Industry 2020 & 2033
- Table 9: Global Nanocellulose Industry Revenue Million Forecast, by Product Type 2020 & 2033
- Table 10: Global Nanocellulose Industry Volume Billion Forecast, by Product Type 2020 & 2033
- Table 11: Global Nanocellulose Industry Revenue Million Forecast, by Country 2020 & 2033
- Table 12: Global Nanocellulose Industry Volume Billion Forecast, by Country 2020 & 2033
- Table 13: China Nanocellulose Industry Revenue (Million) Forecast, by Application 2020 & 2033
- Table 14: China Nanocellulose Industry Volume (Billion) Forecast, by Application 2020 & 2033
- Table 15: India Nanocellulose Industry Revenue (Million) Forecast, by Application 2020 & 2033
- Table 16: India Nanocellulose Industry Volume (Billion) Forecast, by Application 2020 & 2033
- Table 17: Japan Nanocellulose Industry Revenue (Million) Forecast, by Application 2020 & 2033
- Table 18: Japan Nanocellulose Industry Volume (Billion) Forecast, by Application 2020 & 2033
- Table 19: South Korea Nanocellulose Industry Revenue (Million) Forecast, by Application 2020 & 2033
- Table 20: South Korea Nanocellulose Industry Volume (Billion) Forecast, by Application 2020 & 2033
- Table 21: Malaysia Nanocellulose Industry Revenue (Million) Forecast, by Application 2020 & 2033
- Table 22: Malaysia Nanocellulose Industry Volume (Billion) Forecast, by Application 2020 & 2033
- Table 23: Thailand Nanocellulose Industry Revenue (Million) Forecast, by Application 2020 & 2033
- Table 24: Thailand Nanocellulose Industry Volume (Billion) Forecast, by Application 2020 & 2033
- Table 25: Indonesia Nanocellulose Industry Revenue (Million) Forecast, by Application 2020 & 2033
- Table 26: Indonesia Nanocellulose Industry Volume (Billion) Forecast, by Application 2020 & 2033
- Table 27: Vietnam Nanocellulose Industry Revenue (Million) Forecast, by Application 2020 & 2033
- Table 28: Vietnam Nanocellulose Industry Volume (Billion) Forecast, by Application 2020 & 2033
- Table 29: Rest of Asia Pacific Nanocellulose Industry Revenue (Million) Forecast, by Application 2020 & 2033
- Table 30: Rest of Asia Pacific Nanocellulose Industry Volume (Billion) Forecast, by Application 2020 & 2033
- Table 31: Global Nanocellulose Industry Revenue Million Forecast, by End-user Industry 2020 & 2033
- Table 32: Global Nanocellulose Industry Volume Billion Forecast, by End-user Industry 2020 & 2033
- Table 33: Global Nanocellulose Industry Revenue Million Forecast, by Product Type 2020 & 2033
- Table 34: Global Nanocellulose Industry Volume Billion Forecast, by Product Type 2020 & 2033
- Table 35: Global Nanocellulose Industry Revenue Million Forecast, by Country 2020 & 2033
- Table 36: Global Nanocellulose Industry Volume Billion Forecast, by Country 2020 & 2033
- Table 37: United States Nanocellulose Industry Revenue (Million) Forecast, by Application 2020 & 2033
- Table 38: United States Nanocellulose Industry Volume (Billion) Forecast, by Application 2020 & 2033
- Table 39: Canada Nanocellulose Industry Revenue (Million) Forecast, by Application 2020 & 2033
- Table 40: Canada Nanocellulose Industry Volume (Billion) Forecast, by Application 2020 & 2033
- Table 41: Mexico Nanocellulose Industry Revenue (Million) Forecast, by Application 2020 & 2033
- Table 42: Mexico Nanocellulose Industry Volume (Billion) Forecast, by Application 2020 & 2033
- Table 43: Global Nanocellulose Industry Revenue Million Forecast, by End-user Industry 2020 & 2033
- Table 44: Global Nanocellulose Industry Volume Billion Forecast, by End-user Industry 2020 & 2033
- Table 45: Global Nanocellulose Industry Revenue Million Forecast, by Product Type 2020 & 2033
- Table 46: Global Nanocellulose Industry Volume Billion Forecast, by Product Type 2020 & 2033
- Table 47: Global Nanocellulose Industry Revenue Million Forecast, by Country 2020 & 2033
- Table 48: Global Nanocellulose Industry Volume Billion Forecast, by Country 2020 & 2033
- Table 49: Germany Nanocellulose Industry Revenue (Million) Forecast, by Application 2020 & 2033
- Table 50: Germany Nanocellulose Industry Volume (Billion) Forecast, by Application 2020 & 2033
- Table 51: United Kingdom Nanocellulose Industry Revenue (Million) Forecast, by Application 2020 & 2033
- Table 52: United Kingdom Nanocellulose Industry Volume (Billion) Forecast, by Application 2020 & 2033
- Table 53: France Nanocellulose Industry Revenue (Million) Forecast, by Application 2020 & 2033
- Table 54: France Nanocellulose Industry Volume (Billion) Forecast, by Application 2020 & 2033
- Table 55: Italy Nanocellulose Industry Revenue (Million) Forecast, by Application 2020 & 2033
- Table 56: Italy Nanocellulose Industry Volume (Billion) Forecast, by Application 2020 & 2033
- Table 57: Spain Nanocellulose Industry Revenue (Million) Forecast, by Application 2020 & 2033
- Table 58: Spain Nanocellulose Industry Volume (Billion) Forecast, by Application 2020 & 2033
- Table 59: NORDIC Countries Nanocellulose Industry Revenue (Million) Forecast, by Application 2020 & 2033
- Table 60: NORDIC Countries Nanocellulose Industry Volume (Billion) Forecast, by Application 2020 & 2033
- Table 61: Turkey Nanocellulose Industry Revenue (Million) Forecast, by Application 2020 & 2033
- Table 62: Turkey Nanocellulose Industry Volume (Billion) Forecast, by Application 2020 & 2033
- Table 63: Russia Nanocellulose Industry Revenue (Million) Forecast, by Application 2020 & 2033
- Table 64: Russia Nanocellulose Industry Volume (Billion) Forecast, by Application 2020 & 2033
- Table 65: Rest of Europe Nanocellulose Industry Revenue (Million) Forecast, by Application 2020 & 2033
- Table 66: Rest of Europe Nanocellulose Industry Volume (Billion) Forecast, by Application 2020 & 2033
- Table 67: Global Nanocellulose Industry Revenue Million Forecast, by End-user Industry 2020 & 2033
- Table 68: Global Nanocellulose Industry Volume Billion Forecast, by End-user Industry 2020 & 2033
- Table 69: Global Nanocellulose Industry Revenue Million Forecast, by Product Type 2020 & 2033
- Table 70: Global Nanocellulose Industry Volume Billion Forecast, by Product Type 2020 & 2033
- Table 71: Global Nanocellulose Industry Revenue Million Forecast, by Country 2020 & 2033
- Table 72: Global Nanocellulose Industry Volume Billion Forecast, by Country 2020 & 2033
- Table 73: Brazil Nanocellulose Industry Revenue (Million) Forecast, by Application 2020 & 2033
- Table 74: Brazil Nanocellulose Industry Volume (Billion) Forecast, by Application 2020 & 2033
- Table 75: Argentina Nanocellulose Industry Revenue (Million) Forecast, by Application 2020 & 2033
- Table 76: Argentina Nanocellulose Industry Volume (Billion) Forecast, by Application 2020 & 2033
- Table 77: Colombia Nanocellulose Industry Revenue (Million) Forecast, by Application 2020 & 2033
- Table 78: Colombia Nanocellulose Industry Volume (Billion) Forecast, by Application 2020 & 2033
- Table 79: Rest of South America Nanocellulose Industry Revenue (Million) Forecast, by Application 2020 & 2033
- Table 80: Rest of South America Nanocellulose Industry Volume (Billion) Forecast, by Application 2020 & 2033
- Table 81: Global Nanocellulose Industry Revenue Million Forecast, by End-user Industry 2020 & 2033
- Table 82: Global Nanocellulose Industry Volume Billion Forecast, by End-user Industry 2020 & 2033
- Table 83: Global Nanocellulose Industry Revenue Million Forecast, by Product Type 2020 & 2033
- Table 84: Global Nanocellulose Industry Volume Billion Forecast, by Product Type 2020 & 2033
- Table 85: Global Nanocellulose Industry Revenue Million Forecast, by Country 2020 & 2033
- Table 86: Global Nanocellulose Industry Volume Billion Forecast, by Country 2020 & 2033
- Table 87: Saudi Arabia Nanocellulose Industry Revenue (Million) Forecast, by Application 2020 & 2033
- Table 88: Saudi Arabia Nanocellulose Industry Volume (Billion) Forecast, by Application 2020 & 2033
- Table 89: South Africa Nanocellulose Industry Revenue (Million) Forecast, by Application 2020 & 2033
- Table 90: South Africa Nanocellulose Industry Volume (Billion) Forecast, by Application 2020 & 2033
- Table 91: Nigeria Nanocellulose Industry Revenue (Million) Forecast, by Application 2020 & 2033
- Table 92: Nigeria Nanocellulose Industry Volume (Billion) Forecast, by Application 2020 & 2033
- Table 93: Qatar Nanocellulose Industry Revenue (Million) Forecast, by Application 2020 & 2033
- Table 94: Qatar Nanocellulose Industry Volume (Billion) Forecast, by Application 2020 & 2033
- Table 95: Egypt Nanocellulose Industry Revenue (Million) Forecast, by Application 2020 & 2033
- Table 96: Egypt Nanocellulose Industry Volume (Billion) Forecast, by Application 2020 & 2033
- Table 97: United Arab Emirates Nanocellulose Industry Revenue (Million) Forecast, by Application 2020 & 2033
- Table 98: United Arab Emirates Nanocellulose Industry Volume (Billion) Forecast, by Application 2020 & 2033
- Table 99: Rest of Middle East and Africa Nanocellulose Industry Revenue (Million) Forecast, by Application 2020 & 2033
- Table 100: Rest of Middle East and Africa Nanocellulose Industry Volume (Billion) Forecast, by Application 2020 & 2033
Frequently Asked Questions
1. What is the projected Compound Annual Growth Rate (CAGR) of the Nanocellulose Industry?
The projected CAGR is approximately > 20.00%.
2. Which companies are prominent players in the Nanocellulose Industry?
Key companies in the market include GranBio Technologies, Axcelon Biopolymers Corporation, Borregaard, CelluComp, CelluForce, Chuetsu Pulp and Paper Co Ltd, Daicel Finechem Ltd, Fiberlean Technologies, Melodea Ltd, Nippon Paper Industries Co Ltd, Norske Skog ASA, Oji Holdings Corporation, Sappi Ltd, University of Maine*List Not Exhaustive.
3. What are the main segments of the Nanocellulose Industry?
The market segments include End-user Industry, Product Type.
4. Can you provide details about the market size?
The market size is estimated to be USD 1.10 Million as of 2022.
5. What are some drivers contributing to market growth?
Superior Properties of Nanocellulose; Increasing Adoption of Flexible Packaging Aids; Other Drivers.
6. What are the notable trends driving market growth?
The Composites Segment is Expected to Dominate the Market.
7. Are there any restraints impacting market growth?
Superior Properties of Nanocellulose; Increasing Adoption of Flexible Packaging Aids; Other Drivers.
8. Can you provide examples of recent developments in the market?
September 2023: The world’s demand for cooling increased significantly. In particular, ACs and electric fans consume almost 20% of a building's electricity consumption. As a result, research into eco-friendly, sustainable cooling technologies offers promising opportunities to combat global warming and reduce energy consumption. In line with this, a group of researchers from the Nanjing Forestry University in China have developed the nanocellulosic aerogel film to keep buildings cooler.
9. What pricing options are available for accessing the report?
Pricing options include single-user, multi-user, and enterprise licenses priced at USD 4750, USD 5250, and USD 8750 respectively.
10. Is the market size provided in terms of value or volume?
The market size is provided in terms of value, measured in Million and volume, measured in Billion.
11. Are there any specific market keywords associated with the report?
Yes, the market keyword associated with the report is "Nanocellulose Industry," which aids in identifying and referencing the specific market segment covered.
12. How do I determine which pricing option suits my needs best?
The pricing options vary based on user requirements and access needs. Individual users may opt for single-user licenses, while businesses requiring broader access may choose multi-user or enterprise licenses for cost-effective access to the report.
13. Are there any additional resources or data provided in the Nanocellulose Industry report?
While the report offers comprehensive insights, it's advisable to review the specific contents or supplementary materials provided to ascertain if additional resources or data are available.
14. How can I stay updated on further developments or reports in the Nanocellulose Industry?
To stay informed about further developments, trends, and reports in the Nanocellulose Industry, consider subscribing to industry newsletters, following relevant companies and organizations, or regularly checking reputable industry news sources and publications.
Methodology
Step 1 - Identification of Relevant Samples Size from Population Database


Step 2 - Approaches for Defining Global Market Size (Value, Volume* & Price*)

Note*: In applicable scenarios
Step 3 - Data Sources
Primary Research
- Web Analytics
- Survey Reports
- Research Institute
- Latest Research Reports
- Opinion Leaders
Secondary Research
- Annual Reports
- White Paper
- Latest Press Release
- Industry Association
- Paid Database
- Investor Presentations

Step 4 - Data Triangulation
Involves using different sources of information in order to increase the validity of a study
These sources are likely to be stakeholders in a program - participants, other researchers, program staff, other community members, and so on.
Then we put all data in single framework & apply various statistical tools to find out the dynamic on the market.
During the analysis stage, feedback from the stakeholder groups would be compared to determine areas of agreement as well as areas of divergence