

Key Insights
The global nanoparticles market is exhibiting substantial expansion, driven by widespread adoption across key sectors like healthcare and electronics. Enhanced drug delivery, advanced diagnostics, and improved medical imaging are key drivers within the healthcare industry, while the electronics sector benefits from nanoparticles in semiconductors and flexible displays. Continuous innovation in synthesis and characterization techniques further fuels this growth. The market is segmented by application (imaging, targeted drug delivery, sensors, in vitro diagnostics, probes, catalysis) and end-user industry (electronics, healthcare, chemicals). Despite regulatory and toxicity challenges, ongoing R&D is fostering market progression. Key growth regions include North America, Europe, and Asia-Pacific, supported by robust R&D investments and expanding manufacturing capabilities. The competitive environment comprises both established leaders and innovative newcomers.
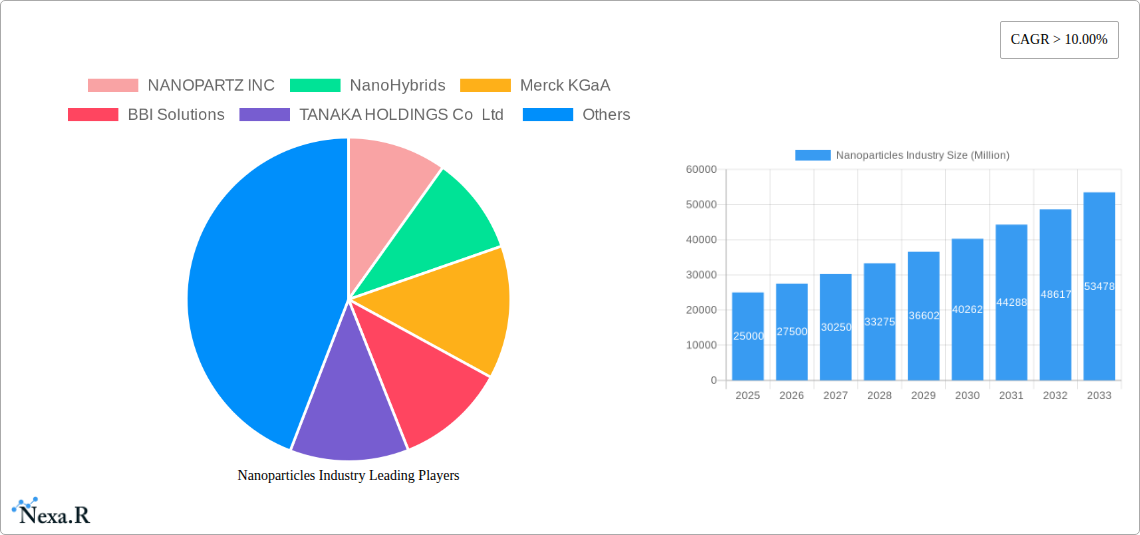
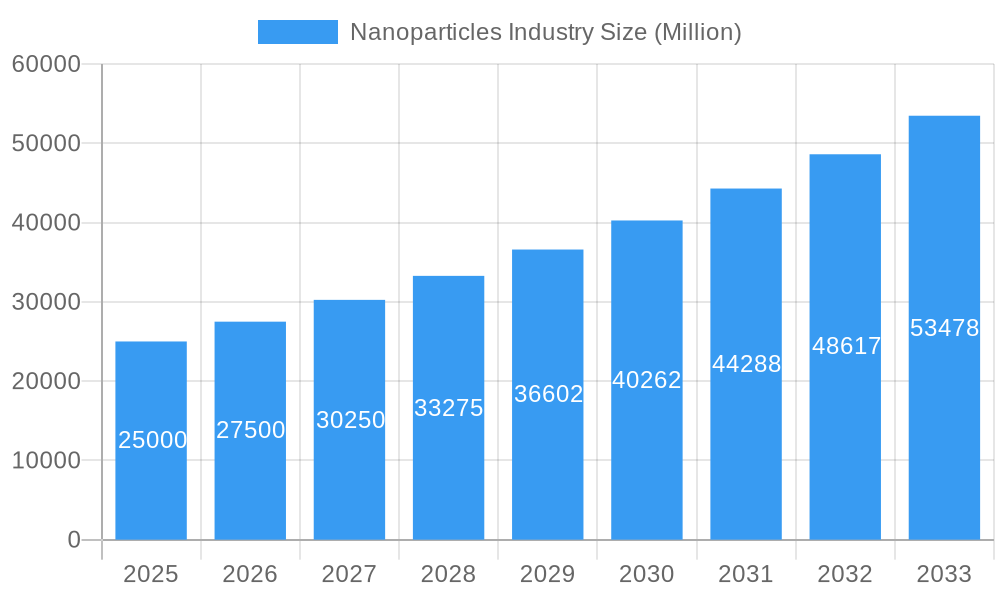
Nanoparticles Industry Market Size (In Billion)
The global nanoparticles market is projected to reach $1.37 billion by 2025, with a Compound Annual Growth Rate (CAGR) of 8.07%. This growth trajectory is sustained by persistent high demand and ongoing technological advancements. While precise regional and segmental market sizes are unavailable, a balanced distribution across North America, Europe, and Asia-Pacific is anticipated, with North America potentially leading due to its strong technological infrastructure. The healthcare and electronics sectors are expected to be the primary application segments, with catalysis and sensors also showing significant potential. The competitive landscape is dynamic, characterized by contributions from both multinational corporations and emerging startups.
Nanoparticles Industry Company Market Share
Nanoparticles Industry Market Report: 2019-2033
This comprehensive report provides an in-depth analysis of the global nanoparticles industry, encompassing market dynamics, growth trends, regional dominance, product landscape, key players, and future outlook. The study covers the period from 2019 to 2033, with a base year of 2025 and a forecast period of 2025-2033. This report is an essential resource for industry professionals, investors, and researchers seeking to understand the current state and future trajectory of this rapidly evolving market. Market values are presented in million units.
Nanoparticles Industry Market Dynamics & Structure
The nanoparticles market is characterized by moderate concentration, with several key players holding significant market share. Technological innovation, particularly in synthesis techniques and functionalization, is a primary growth driver. Stringent regulatory frameworks governing nanoparticle safety and application vary across regions, impacting market entry and product development. Competitive pressure stems from the emergence of substitute materials and continuous improvements in existing technologies. The end-user demographics are diverse, spanning healthcare, electronics, and chemicals, each with unique demand profiles. Mergers and acquisitions (M&A) activity is relatively high, with larger players acquiring smaller firms to expand their product portfolios and market reach. During the historical period (2019-2024), the annual M&A deal volume averaged xx deals, with a notable surge in xx.
- Market Concentration: Moderately concentrated, with top 5 players holding xx% market share in 2025 (estimated).
- Technological Innovation: Driven by advancements in nanomaterials synthesis, functionalization, and characterization.
- Regulatory Framework: Stringent regulations vary geographically, impacting market access.
- Competitive Substitutes: Growing competition from alternative materials limits market growth.
- End-User Demographics: Primarily driven by the electronics, healthcare, and chemical industries.
- M&A Trends: Increased consolidation through acquisitions, leading to market expansion for larger companies.
Nanoparticles Industry Growth Trends & Insights
The global nanoparticles market witnessed significant growth during the historical period (2019-2024), expanding from xx million in 2019 to xx million in 2024, driven by increasing demand across various applications. This expansion is projected to continue at a Compound Annual Growth Rate (CAGR) of xx% during the forecast period (2025-2033), reaching xx million by 2033. Market penetration is highest in the healthcare sector, where nanoparticles find extensive use in drug delivery and diagnostics. The adoption rate is influenced by factors such as technological advancements, regulatory approvals, and cost-effectiveness. Significant technological disruptions, such as the development of novel synthesis methods and advanced characterization techniques, are fueling market expansion. Consumer behavior shifts toward sustainable and eco-friendly products are further driving the demand for bio-based nanoparticles.
Dominant Regions, Countries, or Segments in Nanoparticles Industry
North America currently holds the largest market share, driven by significant investments in research and development, a robust healthcare infrastructure, and stringent regulatory frameworks. Europe and Asia-Pacific follow, with significant regional variations. The healthcare segment is the leading application area, contributing xx% of the total market revenue in 2025 (estimated), followed by electronics and chemicals.
- North America: Strong R&D investments and established healthcare infrastructure contribute to high market share.
- Europe: Stringent environmental regulations stimulate growth, particularly in green nanotechnology.
- Asia-Pacific: Rapid industrialization and growing healthcare spending fuel market expansion, particularly in countries like China and India.
- Leading Application Segment: Healthcare (Imaging, Targeted Drug Delivery, In Vitro Diagnostics) accounts for the highest revenue.
- Leading End-user Industry: Electronics is a key driver due to its diverse applications in semiconductors and displays.
Nanoparticles Industry Product Landscape
The nanoparticles market offers a wide array of products with diverse functionalities, including metal nanoparticles (gold, silver, etc.), metal oxide nanoparticles (TiO2, ZnO, etc.), polymer nanoparticles, carbon nanotubes, and quantum dots. These products are engineered for various applications, tailored to specific properties like size, shape, surface modification, and functionalization. Continuous improvements in synthesis techniques lead to higher purity, enhanced performance, and cost-effectiveness. Unique selling propositions include improved efficacy, biocompatibility, and targeted delivery capabilities.
Key Drivers, Barriers & Challenges in Nanoparticles Industry
Key Drivers: Increasing demand from healthcare and electronics sectors; advancements in nanotechnology; supportive government policies promoting nanomaterial research.
Key Challenges: High production costs; stringent safety and regulatory requirements; potential environmental and health risks; competitive landscape. Supply chain disruptions, particularly during the COVID-19 pandemic, further limited market growth in 2020-2021, impacting production by xx%.
Emerging Opportunities in Nanoparticles Industry
Emerging opportunities lie in the development of innovative applications, such as targeted cancer therapies, advanced diagnostics, and sustainable materials. Untapped markets in developing countries offer significant growth potential. The rising demand for biodegradable and biocompatible nanoparticles further presents attractive prospects.
Growth Accelerators in the Nanoparticles Industry
Technological breakthroughs in synthesis and characterization techniques, along with strategic partnerships and collaborations between research institutions and industry players, are key growth accelerators. Market expansion into new applications and geographies will significantly fuel long-term growth.
Key Players Shaping the Nanoparticles Industry Market
- NANOPARTZ INC
- NanoHybrids
- Merck KGaA
- BBI Solutions
- TANAKA HOLDINGS Co Ltd
- Sona Nanotech
- Cline Scientific AB
- nanoComposix
- Aurion
- Meliorum Technologies Inc
- Cytodiagnostics Inc
Notable Milestones in Nanoparticles Industry Sector
- 2020: Several key players launched new nanoparticle-based diagnostic products.
- 2021: Increased focus on sustainable and biocompatible nanoparticles.
- 2022: Significant investments in R&D for next-generation nanomaterials.
- 2023: Several major M&A deals reshaped the industry landscape.
In-Depth Nanoparticles Industry Market Outlook
The nanoparticles industry is poised for substantial growth over the next decade, driven by continuous technological advancements, expanding applications, and increasing investments. Strategic partnerships and collaborations will further accelerate market expansion, presenting significant opportunities for players across the value chain. The focus on sustainability and biocompatibility will shape the future product landscape, creating a market that is both innovative and environmentally responsible.
Nanoparticles Industry Segmentation
-
1. Application
- 1.1. Imaging
- 1.2. Targeted Drug Delivery
- 1.3. Sensors
- 1.4. In Vitro Diagnostics
- 1.5. Probes
- 1.6. Catalysis
- 1.7. Other Applications
-
2. End-user Industry
- 2.1. Electronics
- 2.2. Healthcare
- 2.3. Chemicals
- 2.4. Other End-user Industries
-
3. Product Type
- 3.1. Metal Nanoparticles
- 3.2. Ceramic Nanoparticles
- 3.3. Polymer Nanoparticles
Nanoparticles Industry Segmentation By Geography
-
1. Asia Pacific
- 1.1. China
- 1.2. India
- 1.3. Japan
- 1.4. South Korea
- 1.5. Rest of Asia Pacific
-
2. North America
- 2.1. United States
- 2.2. Canada
- 2.3. Mexico
-
3. Europe
- 3.1. Germany
- 3.2. United Kingdom
- 3.3. Italy
- 3.4. France
- 3.5. Rest of Europe
-
4. Rest of the World
- 4.1. South America
- 4.2. Middle East and Africa

Nanoparticles Industry Regional Market Share
Geographic Coverage of Nanoparticles Industry
Nanoparticles Industry REPORT HIGHLIGHTS
| Aspects | Details |
|---|---|
| Study Period | 2020-2034 |
| Base Year | 2025 |
| Estimated Year | 2026 |
| Forecast Period | 2026-2034 |
| Historical Period | 2020-2025 |
| Growth Rate | CAGR of 8.07% from 2020-2034 |
| Segmentation |
|
Table of Contents
- 1. Introduction
- 1.1. Research Scope
- 1.2. Market Segmentation
- 1.3. Research Objective
- 1.4. Definitions and Assumptions
- 2. Executive Summary
- 2.1. Market Snapshot
- 3. Market Dynamics
- 3.1. Market Drivers
- 3.2. Market Restrains
- 3.3. Market Trends
- 3.4. Market Opportunities
- 4. Market Factor Analysis
- 4.1. Porters Five Forces
- 4.1.1. Bargaining Power of Suppliers
- 4.1.2. Bargaining Power of Buyers
- 4.1.3. Threat of New Entrants
- 4.1.4. Threat of Substitutes
- 4.1.5. Competitive Rivalry
- 4.2. PESTEL analysis
- 4.3. BCG Analysis
- 4.3.1. Stars (High Growth, High Market Share)
- 4.3.2. Cash Cows (Low Growth, High Market Share)
- 4.3.3. Question Mark (High Growth, Low Market Share)
- 4.3.4. Dogs (Low Growth, Low Market Share)
- 4.4. Ansoff Matrix Analysis
- 4.5. Supply Chain Analysis
- 4.6. Regulatory Landscape
- 4.7. Current Market Potential and Opportunity Assessment (TAM–SAM–SOM Framework)
- 4.8. NRP Analyst Note
- 4.1. Porters Five Forces
- 5. Market Analysis, Insights and Forecast 2021-2033
- 5.1. Market Analysis, Insights and Forecast - by Application
- 5.1.1. Imaging
- 5.1.2. Targeted Drug Delivery
- 5.1.3. Sensors
- 5.1.4. In Vitro Diagnostics
- 5.1.5. Probes
- 5.1.6. Catalysis
- 5.1.7. Other Applications
- 5.2. Market Analysis, Insights and Forecast - by End-user Industry
- 5.2.1. Electronics
- 5.2.2. Healthcare
- 5.2.3. Chemicals
- 5.2.4. Other End-user Industries
- 5.3. Market Analysis, Insights and Forecast - by Product Type
- 5.3.1. Metal Nanoparticles
- 5.3.2. Ceramic Nanoparticles
- 5.3.3. Polymer Nanoparticles
- 5.4. Market Analysis, Insights and Forecast - by Region
- 5.4.1. Asia Pacific
- 5.4.2. North America
- 5.4.3. Europe
- 5.4.4. Rest of the World
- 5.1. Market Analysis, Insights and Forecast - by Application
- 6. Global Nanoparticles Industry Analysis, Insights and Forecast, 2021-2033
- 6.1. Market Analysis, Insights and Forecast - by Application
- 6.1.1. Imaging
- 6.1.2. Targeted Drug Delivery
- 6.1.3. Sensors
- 6.1.4. In Vitro Diagnostics
- 6.1.5. Probes
- 6.1.6. Catalysis
- 6.1.7. Other Applications
- 6.2. Market Analysis, Insights and Forecast - by End-user Industry
- 6.2.1. Electronics
- 6.2.2. Healthcare
- 6.2.3. Chemicals
- 6.2.4. Other End-user Industries
- 6.3. Market Analysis, Insights and Forecast - by Product Type
- 6.3.1. Metal Nanoparticles
- 6.3.2. Ceramic Nanoparticles
- 6.3.3. Polymer Nanoparticles
- 6.1. Market Analysis, Insights and Forecast - by Application
- 7. Asia Pacific Nanoparticles Industry Analysis, Insights and Forecast, 2020-2032
- 7.1. Market Analysis, Insights and Forecast - by Application
- 7.1.1. Imaging
- 7.1.2. Targeted Drug Delivery
- 7.1.3. Sensors
- 7.1.4. In Vitro Diagnostics
- 7.1.5. Probes
- 7.1.6. Catalysis
- 7.1.7. Other Applications
- 7.2. Market Analysis, Insights and Forecast - by End-user Industry
- 7.2.1. Electronics
- 7.2.2. Healthcare
- 7.2.3. Chemicals
- 7.2.4. Other End-user Industries
- 7.3. Market Analysis, Insights and Forecast - by Product Type
- 7.3.1. Metal Nanoparticles
- 7.3.2. Ceramic Nanoparticles
- 7.3.3. Polymer Nanoparticles
- 7.1. Market Analysis, Insights and Forecast - by Application
- 8. North America Nanoparticles Industry Analysis, Insights and Forecast, 2020-2032
- 8.1. Market Analysis, Insights and Forecast - by Application
- 8.1.1. Imaging
- 8.1.2. Targeted Drug Delivery
- 8.1.3. Sensors
- 8.1.4. In Vitro Diagnostics
- 8.1.5. Probes
- 8.1.6. Catalysis
- 8.1.7. Other Applications
- 8.2. Market Analysis, Insights and Forecast - by End-user Industry
- 8.2.1. Electronics
- 8.2.2. Healthcare
- 8.2.3. Chemicals
- 8.2.4. Other End-user Industries
- 8.3. Market Analysis, Insights and Forecast - by Product Type
- 8.3.1. Metal Nanoparticles
- 8.3.2. Ceramic Nanoparticles
- 8.3.3. Polymer Nanoparticles
- 8.1. Market Analysis, Insights and Forecast - by Application
- 9. Europe Nanoparticles Industry Analysis, Insights and Forecast, 2020-2032
- 9.1. Market Analysis, Insights and Forecast - by Application
- 9.1.1. Imaging
- 9.1.2. Targeted Drug Delivery
- 9.1.3. Sensors
- 9.1.4. In Vitro Diagnostics
- 9.1.5. Probes
- 9.1.6. Catalysis
- 9.1.7. Other Applications
- 9.2. Market Analysis, Insights and Forecast - by End-user Industry
- 9.2.1. Electronics
- 9.2.2. Healthcare
- 9.2.3. Chemicals
- 9.2.4. Other End-user Industries
- 9.3. Market Analysis, Insights and Forecast - by Product Type
- 9.3.1. Metal Nanoparticles
- 9.3.2. Ceramic Nanoparticles
- 9.3.3. Polymer Nanoparticles
- 9.1. Market Analysis, Insights and Forecast - by Application
- 10. Rest of the World Nanoparticles Industry Analysis, Insights and Forecast, 2020-2032
- 10.1. Market Analysis, Insights and Forecast - by Application
- 10.1.1. Imaging
- 10.1.2. Targeted Drug Delivery
- 10.1.3. Sensors
- 10.1.4. In Vitro Diagnostics
- 10.1.5. Probes
- 10.1.6. Catalysis
- 10.1.7. Other Applications
- 10.2. Market Analysis, Insights and Forecast - by End-user Industry
- 10.2.1. Electronics
- 10.2.2. Healthcare
- 10.2.3. Chemicals
- 10.2.4. Other End-user Industries
- 10.3. Market Analysis, Insights and Forecast - by Product Type
- 10.3.1. Metal Nanoparticles
- 10.3.2. Ceramic Nanoparticles
- 10.3.3. Polymer Nanoparticles
- 10.1. Market Analysis, Insights and Forecast - by Application
- 11. Competitive Analysis
- 11.1. Company Profiles
- 11.1.1 NANOPARTZ INC
- 11.1.1.1. Company Overview
- 11.1.1.2. Products
- 11.1.1.3. Company Financials
- 11.1.1.4. SWOT Analysis
- 11.1.2 NanoHybrids
- 11.1.2.1. Company Overview
- 11.1.2.2. Products
- 11.1.2.3. Company Financials
- 11.1.2.4. SWOT Analysis
- 11.1.3 Merck KGaA
- 11.1.3.1. Company Overview
- 11.1.3.2. Products
- 11.1.3.3. Company Financials
- 11.1.3.4. SWOT Analysis
- 11.1.4 BBI Solutions
- 11.1.4.1. Company Overview
- 11.1.4.2. Products
- 11.1.4.3. Company Financials
- 11.1.4.4. SWOT Analysis
- 11.1.5 TANAKA HOLDINGS Co Ltd
- 11.1.5.1. Company Overview
- 11.1.5.2. Products
- 11.1.5.3. Company Financials
- 11.1.5.4. SWOT Analysis
- 11.1.6 Sona Nanotech
- 11.1.6.1. Company Overview
- 11.1.6.2. Products
- 11.1.6.3. Company Financials
- 11.1.6.4. SWOT Analysis
- 11.1.7 Cline Scientific AB
- 11.1.7.1. Company Overview
- 11.1.7.2. Products
- 11.1.7.3. Company Financials
- 11.1.7.4. SWOT Analysis
- 11.1.8 nanoComposix
- 11.1.8.1. Company Overview
- 11.1.8.2. Products
- 11.1.8.3. Company Financials
- 11.1.8.4. SWOT Analysis
- 11.1.9 Aurion
- 11.1.9.1. Company Overview
- 11.1.9.2. Products
- 11.1.9.3. Company Financials
- 11.1.9.4. SWOT Analysis
- 11.1.10 Meliorum Technologies Inc
- 11.1.10.1. Company Overview
- 11.1.10.2. Products
- 11.1.10.3. Company Financials
- 11.1.10.4. SWOT Analysis
- 11.1.11 Cytodiagnostics Inc
- 11.1.11.1. Company Overview
- 11.1.11.2. Products
- 11.1.11.3. Company Financials
- 11.1.11.4. SWOT Analysis
- 11.1.1 NANOPARTZ INC
- 11.2. Market Entropy
- 11.2.1 Company's Key Areas Served
- 11.2.2 Recent Developments
- 11.3. Company Market Share Analysis 2025
- 11.3.1 Top 5 Companies Market Share Analysis
- 11.3.2 Top 3 Companies Market Share Analysis
- 11.4. List of Potential Customers
- 12. Research Methodology
List of Figures
- Figure 1: Global Nanoparticles Industry Revenue Breakdown (billion, %) by Region 2025 & 2033
- Figure 2: Global Nanoparticles Industry Volume Breakdown (K Tons, %) by Region 2025 & 2033
- Figure 3: Asia Pacific Nanoparticles Industry Revenue (billion), by Application 2025 & 2033
- Figure 4: Asia Pacific Nanoparticles Industry Volume (K Tons), by Application 2025 & 2033
- Figure 5: Asia Pacific Nanoparticles Industry Revenue Share (%), by Application 2025 & 2033
- Figure 6: Asia Pacific Nanoparticles Industry Volume Share (%), by Application 2025 & 2033
- Figure 7: Asia Pacific Nanoparticles Industry Revenue (billion), by End-user Industry 2025 & 2033
- Figure 8: Asia Pacific Nanoparticles Industry Volume (K Tons), by End-user Industry 2025 & 2033
- Figure 9: Asia Pacific Nanoparticles Industry Revenue Share (%), by End-user Industry 2025 & 2033
- Figure 10: Asia Pacific Nanoparticles Industry Volume Share (%), by End-user Industry 2025 & 2033
- Figure 11: Asia Pacific Nanoparticles Industry Revenue (billion), by Product Type 2025 & 2033
- Figure 12: Asia Pacific Nanoparticles Industry Volume (K Tons), by Product Type 2025 & 2033
- Figure 13: Asia Pacific Nanoparticles Industry Revenue Share (%), by Product Type 2025 & 2033
- Figure 14: Asia Pacific Nanoparticles Industry Volume Share (%), by Product Type 2025 & 2033
- Figure 15: Asia Pacific Nanoparticles Industry Revenue (billion), by Country 2025 & 2033
- Figure 16: Asia Pacific Nanoparticles Industry Volume (K Tons), by Country 2025 & 2033
- Figure 17: Asia Pacific Nanoparticles Industry Revenue Share (%), by Country 2025 & 2033
- Figure 18: Asia Pacific Nanoparticles Industry Volume Share (%), by Country 2025 & 2033
- Figure 19: North America Nanoparticles Industry Revenue (billion), by Application 2025 & 2033
- Figure 20: North America Nanoparticles Industry Volume (K Tons), by Application 2025 & 2033
- Figure 21: North America Nanoparticles Industry Revenue Share (%), by Application 2025 & 2033
- Figure 22: North America Nanoparticles Industry Volume Share (%), by Application 2025 & 2033
- Figure 23: North America Nanoparticles Industry Revenue (billion), by End-user Industry 2025 & 2033
- Figure 24: North America Nanoparticles Industry Volume (K Tons), by End-user Industry 2025 & 2033
- Figure 25: North America Nanoparticles Industry Revenue Share (%), by End-user Industry 2025 & 2033
- Figure 26: North America Nanoparticles Industry Volume Share (%), by End-user Industry 2025 & 2033
- Figure 27: North America Nanoparticles Industry Revenue (billion), by Product Type 2025 & 2033
- Figure 28: North America Nanoparticles Industry Volume (K Tons), by Product Type 2025 & 2033
- Figure 29: North America Nanoparticles Industry Revenue Share (%), by Product Type 2025 & 2033
- Figure 30: North America Nanoparticles Industry Volume Share (%), by Product Type 2025 & 2033
- Figure 31: North America Nanoparticles Industry Revenue (billion), by Country 2025 & 2033
- Figure 32: North America Nanoparticles Industry Volume (K Tons), by Country 2025 & 2033
- Figure 33: North America Nanoparticles Industry Revenue Share (%), by Country 2025 & 2033
- Figure 34: North America Nanoparticles Industry Volume Share (%), by Country 2025 & 2033
- Figure 35: Europe Nanoparticles Industry Revenue (billion), by Application 2025 & 2033
- Figure 36: Europe Nanoparticles Industry Volume (K Tons), by Application 2025 & 2033
- Figure 37: Europe Nanoparticles Industry Revenue Share (%), by Application 2025 & 2033
- Figure 38: Europe Nanoparticles Industry Volume Share (%), by Application 2025 & 2033
- Figure 39: Europe Nanoparticles Industry Revenue (billion), by End-user Industry 2025 & 2033
- Figure 40: Europe Nanoparticles Industry Volume (K Tons), by End-user Industry 2025 & 2033
- Figure 41: Europe Nanoparticles Industry Revenue Share (%), by End-user Industry 2025 & 2033
- Figure 42: Europe Nanoparticles Industry Volume Share (%), by End-user Industry 2025 & 2033
- Figure 43: Europe Nanoparticles Industry Revenue (billion), by Product Type 2025 & 2033
- Figure 44: Europe Nanoparticles Industry Volume (K Tons), by Product Type 2025 & 2033
- Figure 45: Europe Nanoparticles Industry Revenue Share (%), by Product Type 2025 & 2033
- Figure 46: Europe Nanoparticles Industry Volume Share (%), by Product Type 2025 & 2033
- Figure 47: Europe Nanoparticles Industry Revenue (billion), by Country 2025 & 2033
- Figure 48: Europe Nanoparticles Industry Volume (K Tons), by Country 2025 & 2033
- Figure 49: Europe Nanoparticles Industry Revenue Share (%), by Country 2025 & 2033
- Figure 50: Europe Nanoparticles Industry Volume Share (%), by Country 2025 & 2033
- Figure 51: Rest of the World Nanoparticles Industry Revenue (billion), by Application 2025 & 2033
- Figure 52: Rest of the World Nanoparticles Industry Volume (K Tons), by Application 2025 & 2033
- Figure 53: Rest of the World Nanoparticles Industry Revenue Share (%), by Application 2025 & 2033
- Figure 54: Rest of the World Nanoparticles Industry Volume Share (%), by Application 2025 & 2033
- Figure 55: Rest of the World Nanoparticles Industry Revenue (billion), by End-user Industry 2025 & 2033
- Figure 56: Rest of the World Nanoparticles Industry Volume (K Tons), by End-user Industry 2025 & 2033
- Figure 57: Rest of the World Nanoparticles Industry Revenue Share (%), by End-user Industry 2025 & 2033
- Figure 58: Rest of the World Nanoparticles Industry Volume Share (%), by End-user Industry 2025 & 2033
- Figure 59: Rest of the World Nanoparticles Industry Revenue (billion), by Product Type 2025 & 2033
- Figure 60: Rest of the World Nanoparticles Industry Volume (K Tons), by Product Type 2025 & 2033
- Figure 61: Rest of the World Nanoparticles Industry Revenue Share (%), by Product Type 2025 & 2033
- Figure 62: Rest of the World Nanoparticles Industry Volume Share (%), by Product Type 2025 & 2033
- Figure 63: Rest of the World Nanoparticles Industry Revenue (billion), by Country 2025 & 2033
- Figure 64: Rest of the World Nanoparticles Industry Volume (K Tons), by Country 2025 & 2033
- Figure 65: Rest of the World Nanoparticles Industry Revenue Share (%), by Country 2025 & 2033
- Figure 66: Rest of the World Nanoparticles Industry Volume Share (%), by Country 2025 & 2033
List of Tables
- Table 1: Global Nanoparticles Industry Revenue billion Forecast, by Application 2020 & 2033
- Table 2: Global Nanoparticles Industry Volume K Tons Forecast, by Application 2020 & 2033
- Table 3: Global Nanoparticles Industry Revenue billion Forecast, by End-user Industry 2020 & 2033
- Table 4: Global Nanoparticles Industry Volume K Tons Forecast, by End-user Industry 2020 & 2033
- Table 5: Global Nanoparticles Industry Revenue billion Forecast, by Product Type 2020 & 2033
- Table 6: Global Nanoparticles Industry Volume K Tons Forecast, by Product Type 2020 & 2033
- Table 7: Global Nanoparticles Industry Revenue billion Forecast, by Region 2020 & 2033
- Table 8: Global Nanoparticles Industry Volume K Tons Forecast, by Region 2020 & 2033
- Table 9: Global Nanoparticles Industry Revenue billion Forecast, by Application 2020 & 2033
- Table 10: Global Nanoparticles Industry Volume K Tons Forecast, by Application 2020 & 2033
- Table 11: Global Nanoparticles Industry Revenue billion Forecast, by End-user Industry 2020 & 2033
- Table 12: Global Nanoparticles Industry Volume K Tons Forecast, by End-user Industry 2020 & 2033
- Table 13: Global Nanoparticles Industry Revenue billion Forecast, by Product Type 2020 & 2033
- Table 14: Global Nanoparticles Industry Volume K Tons Forecast, by Product Type 2020 & 2033
- Table 15: Global Nanoparticles Industry Revenue billion Forecast, by Country 2020 & 2033
- Table 16: Global Nanoparticles Industry Volume K Tons Forecast, by Country 2020 & 2033
- Table 17: China Nanoparticles Industry Revenue (billion) Forecast, by Application 2020 & 2033
- Table 18: China Nanoparticles Industry Volume (K Tons) Forecast, by Application 2020 & 2033
- Table 19: India Nanoparticles Industry Revenue (billion) Forecast, by Application 2020 & 2033
- Table 20: India Nanoparticles Industry Volume (K Tons) Forecast, by Application 2020 & 2033
- Table 21: Japan Nanoparticles Industry Revenue (billion) Forecast, by Application 2020 & 2033
- Table 22: Japan Nanoparticles Industry Volume (K Tons) Forecast, by Application 2020 & 2033
- Table 23: South Korea Nanoparticles Industry Revenue (billion) Forecast, by Application 2020 & 2033
- Table 24: South Korea Nanoparticles Industry Volume (K Tons) Forecast, by Application 2020 & 2033
- Table 25: Rest of Asia Pacific Nanoparticles Industry Revenue (billion) Forecast, by Application 2020 & 2033
- Table 26: Rest of Asia Pacific Nanoparticles Industry Volume (K Tons) Forecast, by Application 2020 & 2033
- Table 27: Global Nanoparticles Industry Revenue billion Forecast, by Application 2020 & 2033
- Table 28: Global Nanoparticles Industry Volume K Tons Forecast, by Application 2020 & 2033
- Table 29: Global Nanoparticles Industry Revenue billion Forecast, by End-user Industry 2020 & 2033
- Table 30: Global Nanoparticles Industry Volume K Tons Forecast, by End-user Industry 2020 & 2033
- Table 31: Global Nanoparticles Industry Revenue billion Forecast, by Product Type 2020 & 2033
- Table 32: Global Nanoparticles Industry Volume K Tons Forecast, by Product Type 2020 & 2033
- Table 33: Global Nanoparticles Industry Revenue billion Forecast, by Country 2020 & 2033
- Table 34: Global Nanoparticles Industry Volume K Tons Forecast, by Country 2020 & 2033
- Table 35: United States Nanoparticles Industry Revenue (billion) Forecast, by Application 2020 & 2033
- Table 36: United States Nanoparticles Industry Volume (K Tons) Forecast, by Application 2020 & 2033
- Table 37: Canada Nanoparticles Industry Revenue (billion) Forecast, by Application 2020 & 2033
- Table 38: Canada Nanoparticles Industry Volume (K Tons) Forecast, by Application 2020 & 2033
- Table 39: Mexico Nanoparticles Industry Revenue (billion) Forecast, by Application 2020 & 2033
- Table 40: Mexico Nanoparticles Industry Volume (K Tons) Forecast, by Application 2020 & 2033
- Table 41: Global Nanoparticles Industry Revenue billion Forecast, by Application 2020 & 2033
- Table 42: Global Nanoparticles Industry Volume K Tons Forecast, by Application 2020 & 2033
- Table 43: Global Nanoparticles Industry Revenue billion Forecast, by End-user Industry 2020 & 2033
- Table 44: Global Nanoparticles Industry Volume K Tons Forecast, by End-user Industry 2020 & 2033
- Table 45: Global Nanoparticles Industry Revenue billion Forecast, by Product Type 2020 & 2033
- Table 46: Global Nanoparticles Industry Volume K Tons Forecast, by Product Type 2020 & 2033
- Table 47: Global Nanoparticles Industry Revenue billion Forecast, by Country 2020 & 2033
- Table 48: Global Nanoparticles Industry Volume K Tons Forecast, by Country 2020 & 2033
- Table 49: Germany Nanoparticles Industry Revenue (billion) Forecast, by Application 2020 & 2033
- Table 50: Germany Nanoparticles Industry Volume (K Tons) Forecast, by Application 2020 & 2033
- Table 51: United Kingdom Nanoparticles Industry Revenue (billion) Forecast, by Application 2020 & 2033
- Table 52: United Kingdom Nanoparticles Industry Volume (K Tons) Forecast, by Application 2020 & 2033
- Table 53: Italy Nanoparticles Industry Revenue (billion) Forecast, by Application 2020 & 2033
- Table 54: Italy Nanoparticles Industry Volume (K Tons) Forecast, by Application 2020 & 2033
- Table 55: France Nanoparticles Industry Revenue (billion) Forecast, by Application 2020 & 2033
- Table 56: France Nanoparticles Industry Volume (K Tons) Forecast, by Application 2020 & 2033
- Table 57: Rest of Europe Nanoparticles Industry Revenue (billion) Forecast, by Application 2020 & 2033
- Table 58: Rest of Europe Nanoparticles Industry Volume (K Tons) Forecast, by Application 2020 & 2033
- Table 59: Global Nanoparticles Industry Revenue billion Forecast, by Application 2020 & 2033
- Table 60: Global Nanoparticles Industry Volume K Tons Forecast, by Application 2020 & 2033
- Table 61: Global Nanoparticles Industry Revenue billion Forecast, by End-user Industry 2020 & 2033
- Table 62: Global Nanoparticles Industry Volume K Tons Forecast, by End-user Industry 2020 & 2033
- Table 63: Global Nanoparticles Industry Revenue billion Forecast, by Product Type 2020 & 2033
- Table 64: Global Nanoparticles Industry Volume K Tons Forecast, by Product Type 2020 & 2033
- Table 65: Global Nanoparticles Industry Revenue billion Forecast, by Country 2020 & 2033
- Table 66: Global Nanoparticles Industry Volume K Tons Forecast, by Country 2020 & 2033
- Table 67: South America Nanoparticles Industry Revenue (billion) Forecast, by Application 2020 & 2033
- Table 68: South America Nanoparticles Industry Volume (K Tons) Forecast, by Application 2020 & 2033
- Table 69: Middle East and Africa Nanoparticles Industry Revenue (billion) Forecast, by Application 2020 & 2033
- Table 70: Middle East and Africa Nanoparticles Industry Volume (K Tons) Forecast, by Application 2020 & 2033
Frequently Asked Questions
1. What is the projected Compound Annual Growth Rate (CAGR) of the Nanoparticles Industry?
The projected CAGR is approximately 8.07%.
2. Which companies are prominent players in the Nanoparticles Industry?
Key companies in the market include NANOPARTZ INC, NanoHybrids, Merck KGaA, BBI Solutions, TANAKA HOLDINGS Co Ltd , Sona Nanotech, Cline Scientific AB, nanoComposix, Aurion, Meliorum Technologies Inc, Cytodiagnostics Inc.
3. What are the main segments of the Nanoparticles Industry?
The market segments include Application, End-user Industry, Product Type.
4. Can you provide details about the market size?
The market size is estimated to be USD 1.37 billion as of 2022.
5. What are some drivers contributing to market growth?
Rising Nanotechnology Applications in the Medical Industry; Rising Demand from the High-end Electronics Sector.
6. What are the notable trends driving market growth?
Targeted Drug Delivery to Dominate the Market.
7. Are there any restraints impacting market growth?
Volatility in Price of Gold.
8. Can you provide examples of recent developments in the market?
N/A
9. What pricing options are available for accessing the report?
Pricing options include single-user, multi-user, and enterprise licenses priced at USD 4750, USD 5250, and USD 8750 respectively.
10. Is the market size provided in terms of value or volume?
The market size is provided in terms of value, measured in billion and volume, measured in K Tons.
11. Are there any specific market keywords associated with the report?
Yes, the market keyword associated with the report is "Nanoparticles Industry," which aids in identifying and referencing the specific market segment covered.
12. How do I determine which pricing option suits my needs best?
The pricing options vary based on user requirements and access needs. Individual users may opt for single-user licenses, while businesses requiring broader access may choose multi-user or enterprise licenses for cost-effective access to the report.
13. Are there any additional resources or data provided in the Nanoparticles Industry report?
While the report offers comprehensive insights, it's advisable to review the specific contents or supplementary materials provided to ascertain if additional resources or data are available.
14. How can I stay updated on further developments or reports in the Nanoparticles Industry?
To stay informed about further developments, trends, and reports in the Nanoparticles Industry, consider subscribing to industry newsletters, following relevant companies and organizations, or regularly checking reputable industry news sources and publications.
Methodology
Step 1 - Identification of Relevant Samples Size from Population Database


Step 2 - Approaches for Defining Global Market Size (Value, Volume* & Price*)

Note*: In applicable scenarios
Step 3 - Data Sources
Primary Research
- Web Analytics
- Survey Reports
- Research Institute
- Latest Research Reports
- Opinion Leaders
Secondary Research
- Annual Reports
- White Paper
- Latest Press Release
- Industry Association
- Paid Database
- Investor Presentations

Step 4 - Data Triangulation
Involves using different sources of information in order to increase the validity of a study
These sources are likely to be stakeholders in a program - participants, other researchers, program staff, other community members, and so on.
Then we put all data in single framework & apply various statistical tools to find out the dynamic on the market.
During the analysis stage, feedback from the stakeholder groups would be compared to determine areas of agreement as well as areas of divergence