

Key Insights
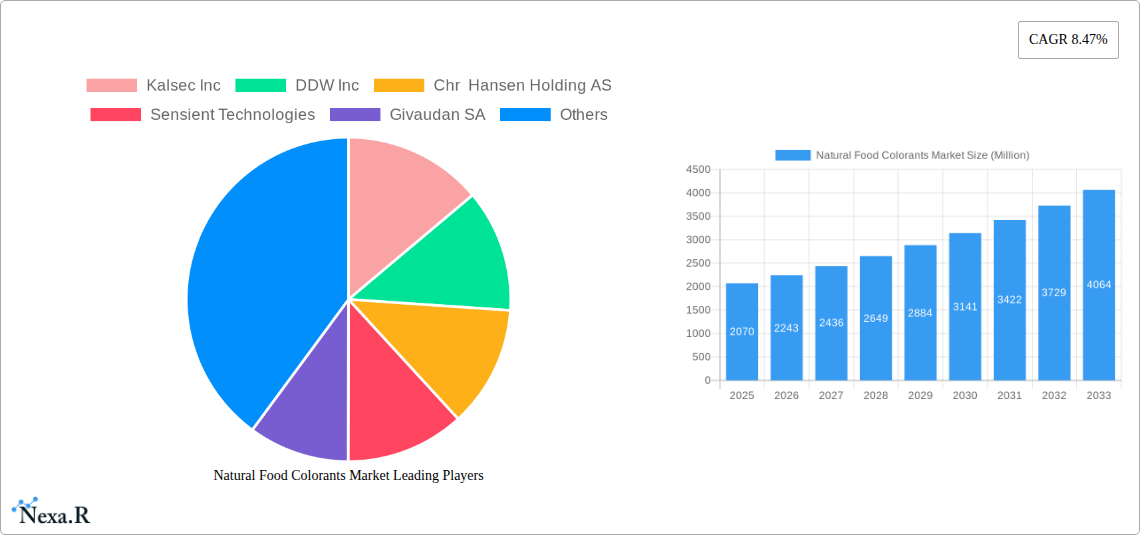
The global natural food colorants market, valued at $2.07 billion in 2025, is projected to experience robust growth, driven by the increasing consumer demand for clean-label products and the rising awareness of the adverse health effects associated with synthetic colorants. The market's Compound Annual Growth Rate (CAGR) of 8.47% from 2019 to 2024 indicates a consistently expanding market, poised for continued expansion through 2033. Key drivers include the burgeoning health and wellness sector, the growing preference for natural and organic food products, and the increasing adoption of natural food colorants across various food and beverage applications, particularly in bakery, dairy, confectionery, and beverages. The market is segmented by application, with bakery and dairy-based products currently dominating, but significant growth is anticipated in nutraceuticals and snacks and cereals segments due to the increasing demand for functional foods. While regulatory changes and the relatively higher cost compared to synthetic counterparts present some restraints, the overall market trajectory remains positive, fueled by innovation in extraction techniques and the development of new and vibrant natural colorants derived from various sources such as fruits, vegetables, and algae. Leading players like Kalsec Inc., DDW Inc., and Chr. Hansen Holding AS are actively involved in research and development, aiming to expand their product portfolio and cater to the growing demand for diverse and high-quality natural colorants. Geographic expansion, particularly in the Asia-Pacific region driven by rising disposable incomes and changing consumer preferences, is anticipated to further contribute to market growth.
The forecast period of 2025-2033 promises continued market expansion, propelled by several factors. Technological advancements are leading to more efficient and cost-effective extraction methods, making natural colorants more competitive. Furthermore, the rise of veganism and vegetarianism fuels the demand for natural and plant-based colorants. Increased consumer awareness regarding the potential health risks of synthetic additives is significantly shifting market preferences towards natural alternatives. The growing popularity of personalized nutrition and functional foods, coupled with heightened demand for clean labels, further solidifies the prospects for growth in the natural food colorants market. Competition among existing players will likely intensify, leading to further innovation and product diversification. However, consistent supply chain management and addressing potential fluctuations in raw material prices will remain crucial challenges for market players.
Natural Food Colorants Market Report: 2019-2033
This comprehensive report provides a detailed analysis of the Natural Food Colorants Market, encompassing market dynamics, growth trends, regional performance, and competitive landscapes. The study period spans from 2019 to 2033, with 2025 serving as the base and estimated year. The report examines the parent market of Food Additives and the child market of Natural Food Colorants, offering invaluable insights for industry professionals, investors, and stakeholders. The market size is projected to reach xx Million by 2033.
Natural Food Colorants Market Dynamics & Structure
The Natural Food Colorants Market is characterized by moderate concentration, with key players such as Kalsec Inc, DDW Inc, Chr. Hansen Holding AS, Sensient Technologies, Givaudan SA, Koninklijke DSM NV, Synthite Industries Private Ltd, Symrise AG, and Archer Daniels Midland Company holding significant market share. However, the market also features several smaller players and emerging companies, driving competition.
Technological innovation is a significant driver, with companies continuously developing new natural color solutions to meet evolving consumer preferences and regulatory requirements. Stringent regulatory frameworks concerning food safety and labeling influence product development and market access. The market faces competition from synthetic colorants, but the increasing consumer demand for natural and clean-label products is a powerful counterbalance. Mergers and acquisitions (M&A) activity is relatively frequent, reflecting the industry's dynamic nature and the desire for expansion and technological enhancement.
- Market Concentration: Moderately concentrated, with top 10 players holding approximately xx% market share in 2025.
- Technological Innovation: Focus on developing sustainable, stable, and vibrant natural color solutions.
- Regulatory Frameworks: Stringent regulations regarding purity, safety, and labeling are key market influencers.
- Competitive Substitutes: Synthetic colorants pose a major challenge, but consumer preference for natural options is a significant driver.
- M&A Activity: Moderate level of M&A activity observed during the historical period, with an estimated xx deals between 2019 and 2024.
Natural Food Colorants Market Growth Trends & Insights
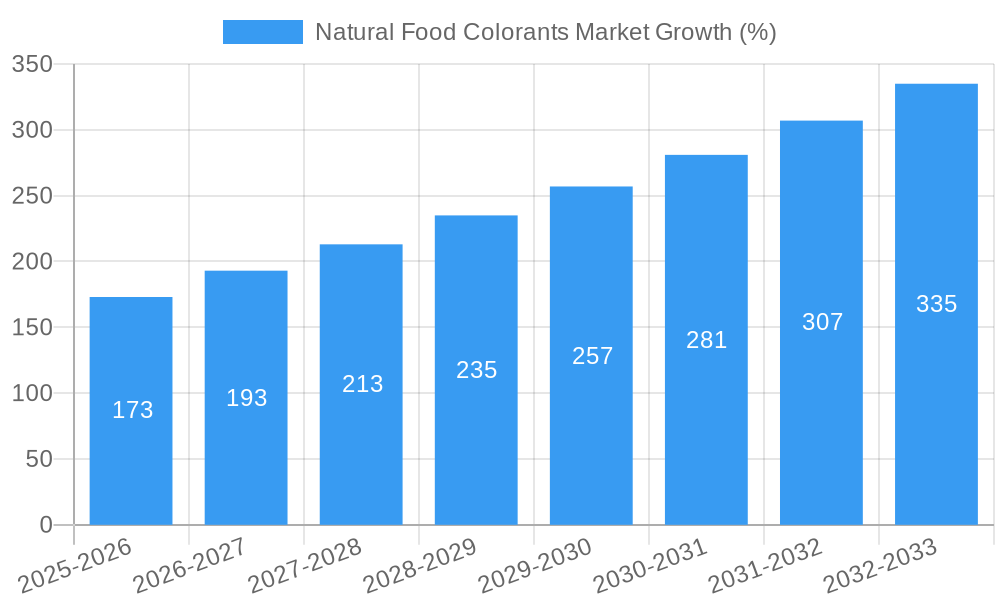
The Natural Food Colorants Market has experienced significant growth from 2019 to 2024, driven by increasing health consciousness among consumers and the growing demand for natural and clean-label food products. The market is anticipated to maintain a robust Compound Annual Growth Rate (CAGR) of xx% during the forecast period (2025-2033). This growth is attributed to several key factors, including the rising popularity of natural and organic foods, increased consumer awareness of the potential health risks associated with artificial colorants, and the growing demand for functional foods and beverages. Technological advancements in extraction, processing, and formulation techniques have also contributed to the market expansion, enabling the creation of more stable, vibrant, and cost-effective natural color solutions. The shift towards plant-based diets and the increased use of natural colorants in various food and beverage applications further fuel market growth. Market penetration of natural colorants within the food and beverage industry is steadily increasing, projected to reach xx% by 2033. The market is also witnessing the emergence of innovative products, such as encapsulated and encapsulated natural color solutions, that offer improved stability and performance characteristics.
Dominant Regions, Countries, or Segments in Natural Food Colorants Market
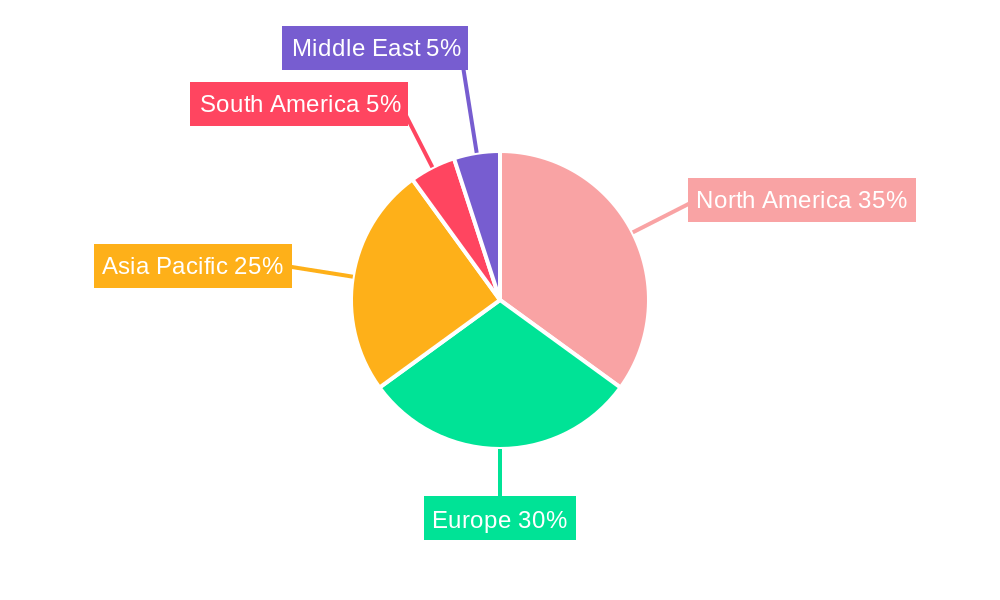
North America and Europe currently dominate the Natural Food Colorants Market, driven by high consumer awareness of health and wellness and strong regulatory frameworks promoting natural ingredients. However, the Asia-Pacific region demonstrates significant growth potential owing to the rising disposable incomes, changing dietary habits, and a burgeoning food and beverage industry.
Within applications, the Bakery segment holds the largest market share in 2025, followed by Dairy-based Products and Beverages. The Nutraceuticals and Confectionery segments are also experiencing rapid growth due to increased demand for naturally colored functional foods and snacks.
- North America: High consumer awareness of natural ingredients and strong regulatory support.
- Europe: Similar to North America, a strong preference for natural products and robust regulatory frameworks.
- Asia-Pacific: Rapid economic growth, changing dietary preferences, and a booming food processing industry drive high growth potential.
- Bakery: Largest application segment due to high volume consumption of baked goods.
- Dairy-based Products: Significant demand for naturally colored dairy products, such as yogurt and ice cream.
Natural Food Colorants Market Product Landscape
The natural food colorants market offers a diverse range of products derived from various natural sources, including fruits, vegetables, algae, and insects. These colorants provide a wide spectrum of hues and are characterized by varying degrees of stability, solubility, and intensity. Recent innovations focus on enhancing color stability, improving processing characteristics, and expanding the range of available shades, particularly in the challenging blue and green hues. The use of encapsulation technologies and novel extraction methods further contributes to the expansion of product offerings and performance capabilities. Unique selling propositions often center on improved color intensity, enhanced stability across different pH levels and processing conditions, and clean-label certifications.
Key Drivers, Barriers & Challenges in Natural Food Colorants Market
Key Drivers:
- Growing consumer preference for natural and clean-label products.
- Increasing health awareness and concerns over the potential health effects of synthetic colorants.
- Rising demand for functional foods and beverages containing natural colorants.
- Technological advancements in extraction and processing techniques.
Key Challenges:
- Higher costs compared to synthetic colorants.
- Variability in color intensity and stability depending on the source and processing method.
- Limited availability of certain colors, particularly vibrant blues and greens.
- Stringent regulatory requirements and compliance issues impacting market access. This results in approximately xx Million in additional compliance costs annually.
Emerging Opportunities in Natural Food Colorants Market
- Expansion into emerging markets with growing consumer demand for natural food products.
- Development of novel natural colorants from sustainable and readily available sources.
- Exploration of innovative applications in areas such as nutraceuticals, personal care, and pharmaceuticals.
- Creation of new product formulations that leverage the synergistic effects of combining different natural colorants.
Growth Accelerators in the Natural Food Colorants Market Industry
Technological breakthroughs in extraction and encapsulation technologies are creating more stable and cost-effective natural colorants, accelerating market expansion. Strategic partnerships between colorant manufacturers and food and beverage companies are fostering innovation and product development. The increasing focus on sustainable sourcing and environmentally friendly production methods is further driving market growth.
Key Players Shaping the Natural Food Colorants Market Market
- Kalsec Inc
- DDW Inc
- Chr. Hansen Holding AS
- Sensient Technologies
- Givaudan SA
- Koninklijke DSM NV
- Synthite Industries Private Ltd
- Symrise AG
- Archer Daniels Midland Company
Notable Milestones in Natural Food Colorants Market Sector
- January 2021: GNT Group launched EXBERRY® Shade Pink - OD, expanding its range of fat-based colorants.
- October 2020: Chr. Hansen Natural Colors opened an R&D center in Montpellier, France, focusing on green, blue, and brown hues.
- September 2018: Givaudan SA acquired Naturex, enhancing its natural ingredient portfolio.
- April 2016: Sensient Technologies launched SupraRed™, a heat-stable natural red colorant.
In-Depth Natural Food Colorants Market Market Outlook
The Natural Food Colorants Market is poised for substantial growth over the forecast period, driven by ongoing consumer demand for natural and healthy food options. Strategic partnerships, technological advancements, and expansion into new markets will fuel this growth. Companies focusing on sustainability and innovation will be best positioned to capture market share and achieve significant long-term success. The market is projected to reach xx Million by 2033, presenting significant opportunities for both established players and emerging companies.
Natural Food Colorants Market Segmentation
-
1. Application
- 1.1. Bakery
-
1.2. Dairy-based Products
- 1.2.1. Ice Cream
- 1.2.2. Other Products
-
1.3. Beverages
- 1.3.1. Alcoholic Beverages
- 1.3.2. Non-alcoholic Beverages
- 1.4. Confectionery
- 1.5. Nutraceuticals
- 1.6. Snacks and Cereals
- 1.7. Other Applications
Natural Food Colorants Market Segmentation By Geography
-
1. North America
- 1.1. United States
- 1.2. Canada
- 1.3. Mexico
- 1.4. Rest of North America
-
2. Europe
- 2.1. United Kingdom
- 2.2. Germany
- 2.3. Italy
- 2.4. Russia
- 2.5. Spain
- 2.6. France
- 2.7. Rest of Europe
-
3. Asia Pacific
- 3.1. China
- 3.2. Japan
- 3.3. India
- 3.4. Australia
- 3.5. Rest of Asia Pacific
-
4. South America
- 4.1. Brazil
- 4.2. Argentina
- 4.3. Rest of South America
- 5. Middle East
-
6. United Arab Emirates
- 6.1. Saudi Arabia
- 6.2. Egypt
- 6.3. South Africa
- 6.4. Rest of Middle East
Natural Food Colorants Market REPORT HIGHLIGHTS
| Aspects | Details |
|---|---|
| Study Period | 2019-2033 |
| Base Year | 2024 |
| Estimated Year | 2025 |
| Forecast Period | 2025-2033 |
| Historical Period | 2019-2024 |
| Growth Rate | CAGR of 8.47% from 2019-2033 |
| Segmentation |
|
Table of Contents
- 1. Introduction
- 1.1. Research Scope
- 1.2. Market Segmentation
- 1.3. Research Methodology
- 1.4. Definitions and Assumptions
- 2. Executive Summary
- 2.1. Introduction
- 3. Market Dynamics
- 3.1. Introduction
- 3.2. Market Drivers
- 3.2.1. Rising Health Consciousness among consumer
- 3.3. Market Restrains
- 3.3.1. High Cost of natural Ingredients
- 3.4. Market Trends
- 3.4.1. Brightening Spotlight on Coloring Foodstuff
- 4. Market Factor Analysis
- 4.1. Porters Five Forces
- 4.2. Supply/Value Chain
- 4.3. PESTEL analysis
- 4.4. Market Entropy
- 4.5. Patent/Trademark Analysis
- 5. Global Natural Food Colorants Market Analysis, Insights and Forecast, 2019-2031
- 5.1. Market Analysis, Insights and Forecast - by Application
- 5.1.1. Bakery
- 5.1.2. Dairy-based Products
- 5.1.2.1. Ice Cream
- 5.1.2.2. Other Products
- 5.1.3. Beverages
- 5.1.3.1. Alcoholic Beverages
- 5.1.3.2. Non-alcoholic Beverages
- 5.1.4. Confectionery
- 5.1.5. Nutraceuticals
- 5.1.6. Snacks and Cereals
- 5.1.7. Other Applications
- 5.2. Market Analysis, Insights and Forecast - by Region
- 5.2.1. North America
- 5.2.2. Europe
- 5.2.3. Asia Pacific
- 5.2.4. South America
- 5.2.5. Middle East
- 5.2.6. United Arab Emirates
- 5.1. Market Analysis, Insights and Forecast - by Application
- 6. North America Natural Food Colorants Market Analysis, Insights and Forecast, 2019-2031
- 6.1. Market Analysis, Insights and Forecast - by Application
- 6.1.1. Bakery
- 6.1.2. Dairy-based Products
- 6.1.2.1. Ice Cream
- 6.1.2.2. Other Products
- 6.1.3. Beverages
- 6.1.3.1. Alcoholic Beverages
- 6.1.3.2. Non-alcoholic Beverages
- 6.1.4. Confectionery
- 6.1.5. Nutraceuticals
- 6.1.6. Snacks and Cereals
- 6.1.7. Other Applications
- 6.1. Market Analysis, Insights and Forecast - by Application
- 7. Europe Natural Food Colorants Market Analysis, Insights and Forecast, 2019-2031
- 7.1. Market Analysis, Insights and Forecast - by Application
- 7.1.1. Bakery
- 7.1.2. Dairy-based Products
- 7.1.2.1. Ice Cream
- 7.1.2.2. Other Products
- 7.1.3. Beverages
- 7.1.3.1. Alcoholic Beverages
- 7.1.3.2. Non-alcoholic Beverages
- 7.1.4. Confectionery
- 7.1.5. Nutraceuticals
- 7.1.6. Snacks and Cereals
- 7.1.7. Other Applications
- 7.1. Market Analysis, Insights and Forecast - by Application
- 8. Asia Pacific Natural Food Colorants Market Analysis, Insights and Forecast, 2019-2031
- 8.1. Market Analysis, Insights and Forecast - by Application
- 8.1.1. Bakery
- 8.1.2. Dairy-based Products
- 8.1.2.1. Ice Cream
- 8.1.2.2. Other Products
- 8.1.3. Beverages
- 8.1.3.1. Alcoholic Beverages
- 8.1.3.2. Non-alcoholic Beverages
- 8.1.4. Confectionery
- 8.1.5. Nutraceuticals
- 8.1.6. Snacks and Cereals
- 8.1.7. Other Applications
- 8.1. Market Analysis, Insights and Forecast - by Application
- 9. South America Natural Food Colorants Market Analysis, Insights and Forecast, 2019-2031
- 9.1. Market Analysis, Insights and Forecast - by Application
- 9.1.1. Bakery
- 9.1.2. Dairy-based Products
- 9.1.2.1. Ice Cream
- 9.1.2.2. Other Products
- 9.1.3. Beverages
- 9.1.3.1. Alcoholic Beverages
- 9.1.3.2. Non-alcoholic Beverages
- 9.1.4. Confectionery
- 9.1.5. Nutraceuticals
- 9.1.6. Snacks and Cereals
- 9.1.7. Other Applications
- 9.1. Market Analysis, Insights and Forecast - by Application
- 10. Middle East Natural Food Colorants Market Analysis, Insights and Forecast, 2019-2031
- 10.1. Market Analysis, Insights and Forecast - by Application
- 10.1.1. Bakery
- 10.1.2. Dairy-based Products
- 10.1.2.1. Ice Cream
- 10.1.2.2. Other Products
- 10.1.3. Beverages
- 10.1.3.1. Alcoholic Beverages
- 10.1.3.2. Non-alcoholic Beverages
- 10.1.4. Confectionery
- 10.1.5. Nutraceuticals
- 10.1.6. Snacks and Cereals
- 10.1.7. Other Applications
- 10.1. Market Analysis, Insights and Forecast - by Application
- 11. United Arab Emirates Natural Food Colorants Market Analysis, Insights and Forecast, 2019-2031
- 11.1. Market Analysis, Insights and Forecast - by Application
- 11.1.1. Bakery
- 11.1.2. Dairy-based Products
- 11.1.2.1. Ice Cream
- 11.1.2.2. Other Products
- 11.1.3. Beverages
- 11.1.3.1. Alcoholic Beverages
- 11.1.3.2. Non-alcoholic Beverages
- 11.1.4. Confectionery
- 11.1.5. Nutraceuticals
- 11.1.6. Snacks and Cereals
- 11.1.7. Other Applications
- 11.1. Market Analysis, Insights and Forecast - by Application
- 12. North America Natural Food Colorants Market Analysis, Insights and Forecast, 2019-2031
- 12.1. Market Analysis, Insights and Forecast - By Country/Sub-region
- 12.1.1 United States
- 12.1.2 Canada
- 12.1.3 Mexico
- 12.1.4 Rest of North America
- 13. Europe Natural Food Colorants Market Analysis, Insights and Forecast, 2019-2031
- 13.1. Market Analysis, Insights and Forecast - By Country/Sub-region
- 13.1.1 United Kingdom
- 13.1.2 Germany
- 13.1.3 Italy
- 13.1.4 Russia
- 13.1.5 Spain
- 13.1.6 France
- 13.1.7 Rest of Europe
- 14. Asia Pacific Natural Food Colorants Market Analysis, Insights and Forecast, 2019-2031
- 14.1. Market Analysis, Insights and Forecast - By Country/Sub-region
- 14.1.1 China
- 14.1.2 Japan
- 14.1.3 India
- 14.1.4 Australia
- 14.1.5 Rest of Asia Pacific
- 15. South America Natural Food Colorants Market Analysis, Insights and Forecast, 2019-2031
- 15.1. Market Analysis, Insights and Forecast - By Country/Sub-region
- 15.1.1 Brazil
- 15.1.2 Argentina
- 15.1.3 Rest of South America
- 16. Middle East Natural Food Colorants Market Analysis, Insights and Forecast, 2019-2031
- 16.1. Market Analysis, Insights and Forecast - By Country/Sub-region
- 16.1.1.
- 17. United Arab Emirates Natural Food Colorants Market Analysis, Insights and Forecast, 2019-2031
- 17.1. Market Analysis, Insights and Forecast - By Country/Sub-region
- 17.1.1 Saudi Arabia
- 17.1.2 Egypt
- 17.1.3 South Africa
- 17.1.4 Rest of Middle East
- 18. Competitive Analysis
- 18.1. Global Market Share Analysis 2024
- 18.2. Company Profiles
- 18.2.1 Kalsec Inc
- 18.2.1.1. Overview
- 18.2.1.2. Products
- 18.2.1.3. SWOT Analysis
- 18.2.1.4. Recent Developments
- 18.2.1.5. Financials (Based on Availability)
- 18.2.2 DDW Inc
- 18.2.2.1. Overview
- 18.2.2.2. Products
- 18.2.2.3. SWOT Analysis
- 18.2.2.4. Recent Developments
- 18.2.2.5. Financials (Based on Availability)
- 18.2.3 Chr Hansen Holding AS
- 18.2.3.1. Overview
- 18.2.3.2. Products
- 18.2.3.3. SWOT Analysis
- 18.2.3.4. Recent Developments
- 18.2.3.5. Financials (Based on Availability)
- 18.2.4 Sensient Technologies
- 18.2.4.1. Overview
- 18.2.4.2. Products
- 18.2.4.3. SWOT Analysis
- 18.2.4.4. Recent Developments
- 18.2.4.5. Financials (Based on Availability)
- 18.2.5 Givaudan SA
- 18.2.5.1. Overview
- 18.2.5.2. Products
- 18.2.5.3. SWOT Analysis
- 18.2.5.4. Recent Developments
- 18.2.5.5. Financials (Based on Availability)
- 18.2.6 Koninklijke DSM NV
- 18.2.6.1. Overview
- 18.2.6.2. Products
- 18.2.6.3. SWOT Analysis
- 18.2.6.4. Recent Developments
- 18.2.6.5. Financials (Based on Availability)
- 18.2.7 Synthite Industries Private Ltd
- 18.2.7.1. Overview
- 18.2.7.2. Products
- 18.2.7.3. SWOT Analysis
- 18.2.7.4. Recent Developments
- 18.2.7.5. Financials (Based on Availability)
- 18.2.8 Symrise AG
- 18.2.8.1. Overview
- 18.2.8.2. Products
- 18.2.8.3. SWOT Analysis
- 18.2.8.4. Recent Developments
- 18.2.8.5. Financials (Based on Availability)
- 18.2.9 Archer Daniels Midland Company*List Not Exhaustive
- 18.2.9.1. Overview
- 18.2.9.2. Products
- 18.2.9.3. SWOT Analysis
- 18.2.9.4. Recent Developments
- 18.2.9.5. Financials (Based on Availability)
- 18.2.1 Kalsec Inc
List of Figures
- Figure 1: Global Natural Food Colorants Market Revenue Breakdown (Million, %) by Region 2024 & 2032
- Figure 2: North America Natural Food Colorants Market Revenue (Million), by Country 2024 & 2032
- Figure 3: North America Natural Food Colorants Market Revenue Share (%), by Country 2024 & 2032
- Figure 4: Europe Natural Food Colorants Market Revenue (Million), by Country 2024 & 2032
- Figure 5: Europe Natural Food Colorants Market Revenue Share (%), by Country 2024 & 2032
- Figure 6: Asia Pacific Natural Food Colorants Market Revenue (Million), by Country 2024 & 2032
- Figure 7: Asia Pacific Natural Food Colorants Market Revenue Share (%), by Country 2024 & 2032
- Figure 8: South America Natural Food Colorants Market Revenue (Million), by Country 2024 & 2032
- Figure 9: South America Natural Food Colorants Market Revenue Share (%), by Country 2024 & 2032
- Figure 10: Middle East Natural Food Colorants Market Revenue (Million), by Country 2024 & 2032
- Figure 11: Middle East Natural Food Colorants Market Revenue Share (%), by Country 2024 & 2032
- Figure 12: United Arab Emirates Natural Food Colorants Market Revenue (Million), by Country 2024 & 2032
- Figure 13: United Arab Emirates Natural Food Colorants Market Revenue Share (%), by Country 2024 & 2032
- Figure 14: North America Natural Food Colorants Market Revenue (Million), by Application 2024 & 2032
- Figure 15: North America Natural Food Colorants Market Revenue Share (%), by Application 2024 & 2032
- Figure 16: North America Natural Food Colorants Market Revenue (Million), by Country 2024 & 2032
- Figure 17: North America Natural Food Colorants Market Revenue Share (%), by Country 2024 & 2032
- Figure 18: Europe Natural Food Colorants Market Revenue (Million), by Application 2024 & 2032
- Figure 19: Europe Natural Food Colorants Market Revenue Share (%), by Application 2024 & 2032
- Figure 20: Europe Natural Food Colorants Market Revenue (Million), by Country 2024 & 2032
- Figure 21: Europe Natural Food Colorants Market Revenue Share (%), by Country 2024 & 2032
- Figure 22: Asia Pacific Natural Food Colorants Market Revenue (Million), by Application 2024 & 2032
- Figure 23: Asia Pacific Natural Food Colorants Market Revenue Share (%), by Application 2024 & 2032
- Figure 24: Asia Pacific Natural Food Colorants Market Revenue (Million), by Country 2024 & 2032
- Figure 25: Asia Pacific Natural Food Colorants Market Revenue Share (%), by Country 2024 & 2032
- Figure 26: South America Natural Food Colorants Market Revenue (Million), by Application 2024 & 2032
- Figure 27: South America Natural Food Colorants Market Revenue Share (%), by Application 2024 & 2032
- Figure 28: South America Natural Food Colorants Market Revenue (Million), by Country 2024 & 2032
- Figure 29: South America Natural Food Colorants Market Revenue Share (%), by Country 2024 & 2032
- Figure 30: Middle East Natural Food Colorants Market Revenue (Million), by Application 2024 & 2032
- Figure 31: Middle East Natural Food Colorants Market Revenue Share (%), by Application 2024 & 2032
- Figure 32: Middle East Natural Food Colorants Market Revenue (Million), by Country 2024 & 2032
- Figure 33: Middle East Natural Food Colorants Market Revenue Share (%), by Country 2024 & 2032
- Figure 34: United Arab Emirates Natural Food Colorants Market Revenue (Million), by Application 2024 & 2032
- Figure 35: United Arab Emirates Natural Food Colorants Market Revenue Share (%), by Application 2024 & 2032
- Figure 36: United Arab Emirates Natural Food Colorants Market Revenue (Million), by Country 2024 & 2032
- Figure 37: United Arab Emirates Natural Food Colorants Market Revenue Share (%), by Country 2024 & 2032
List of Tables
- Table 1: Global Natural Food Colorants Market Revenue Million Forecast, by Region 2019 & 2032
- Table 2: Global Natural Food Colorants Market Revenue Million Forecast, by Application 2019 & 2032
- Table 3: Global Natural Food Colorants Market Revenue Million Forecast, by Region 2019 & 2032
- Table 4: Global Natural Food Colorants Market Revenue Million Forecast, by Country 2019 & 2032
- Table 5: United States Natural Food Colorants Market Revenue (Million) Forecast, by Application 2019 & 2032
- Table 6: Canada Natural Food Colorants Market Revenue (Million) Forecast, by Application 2019 & 2032
- Table 7: Mexico Natural Food Colorants Market Revenue (Million) Forecast, by Application 2019 & 2032
- Table 8: Rest of North America Natural Food Colorants Market Revenue (Million) Forecast, by Application 2019 & 2032
- Table 9: Global Natural Food Colorants Market Revenue Million Forecast, by Country 2019 & 2032
- Table 10: United Kingdom Natural Food Colorants Market Revenue (Million) Forecast, by Application 2019 & 2032
- Table 11: Germany Natural Food Colorants Market Revenue (Million) Forecast, by Application 2019 & 2032
- Table 12: Italy Natural Food Colorants Market Revenue (Million) Forecast, by Application 2019 & 2032
- Table 13: Russia Natural Food Colorants Market Revenue (Million) Forecast, by Application 2019 & 2032
- Table 14: Spain Natural Food Colorants Market Revenue (Million) Forecast, by Application 2019 & 2032
- Table 15: France Natural Food Colorants Market Revenue (Million) Forecast, by Application 2019 & 2032
- Table 16: Rest of Europe Natural Food Colorants Market Revenue (Million) Forecast, by Application 2019 & 2032
- Table 17: Global Natural Food Colorants Market Revenue Million Forecast, by Country 2019 & 2032
- Table 18: China Natural Food Colorants Market Revenue (Million) Forecast, by Application 2019 & 2032
- Table 19: Japan Natural Food Colorants Market Revenue (Million) Forecast, by Application 2019 & 2032
- Table 20: India Natural Food Colorants Market Revenue (Million) Forecast, by Application 2019 & 2032
- Table 21: Australia Natural Food Colorants Market Revenue (Million) Forecast, by Application 2019 & 2032
- Table 22: Rest of Asia Pacific Natural Food Colorants Market Revenue (Million) Forecast, by Application 2019 & 2032
- Table 23: Global Natural Food Colorants Market Revenue Million Forecast, by Country 2019 & 2032
- Table 24: Brazil Natural Food Colorants Market Revenue (Million) Forecast, by Application 2019 & 2032
- Table 25: Argentina Natural Food Colorants Market Revenue (Million) Forecast, by Application 2019 & 2032
- Table 26: Rest of South America Natural Food Colorants Market Revenue (Million) Forecast, by Application 2019 & 2032
- Table 27: Global Natural Food Colorants Market Revenue Million Forecast, by Country 2019 & 2032
- Table 28: Natural Food Colorants Market Revenue (Million) Forecast, by Application 2019 & 2032
- Table 29: Global Natural Food Colorants Market Revenue Million Forecast, by Country 2019 & 2032
- Table 30: Saudi Arabia Natural Food Colorants Market Revenue (Million) Forecast, by Application 2019 & 2032
- Table 31: Egypt Natural Food Colorants Market Revenue (Million) Forecast, by Application 2019 & 2032
- Table 32: South Africa Natural Food Colorants Market Revenue (Million) Forecast, by Application 2019 & 2032
- Table 33: Rest of Middle East Natural Food Colorants Market Revenue (Million) Forecast, by Application 2019 & 2032
- Table 34: Global Natural Food Colorants Market Revenue Million Forecast, by Application 2019 & 2032
- Table 35: Global Natural Food Colorants Market Revenue Million Forecast, by Country 2019 & 2032
- Table 36: United States Natural Food Colorants Market Revenue (Million) Forecast, by Application 2019 & 2032
- Table 37: Canada Natural Food Colorants Market Revenue (Million) Forecast, by Application 2019 & 2032
- Table 38: Mexico Natural Food Colorants Market Revenue (Million) Forecast, by Application 2019 & 2032
- Table 39: Rest of North America Natural Food Colorants Market Revenue (Million) Forecast, by Application 2019 & 2032
- Table 40: Global Natural Food Colorants Market Revenue Million Forecast, by Application 2019 & 2032
- Table 41: Global Natural Food Colorants Market Revenue Million Forecast, by Country 2019 & 2032
- Table 42: United Kingdom Natural Food Colorants Market Revenue (Million) Forecast, by Application 2019 & 2032
- Table 43: Germany Natural Food Colorants Market Revenue (Million) Forecast, by Application 2019 & 2032
- Table 44: Italy Natural Food Colorants Market Revenue (Million) Forecast, by Application 2019 & 2032
- Table 45: Russia Natural Food Colorants Market Revenue (Million) Forecast, by Application 2019 & 2032
- Table 46: Spain Natural Food Colorants Market Revenue (Million) Forecast, by Application 2019 & 2032
- Table 47: France Natural Food Colorants Market Revenue (Million) Forecast, by Application 2019 & 2032
- Table 48: Rest of Europe Natural Food Colorants Market Revenue (Million) Forecast, by Application 2019 & 2032
- Table 49: Global Natural Food Colorants Market Revenue Million Forecast, by Application 2019 & 2032
- Table 50: Global Natural Food Colorants Market Revenue Million Forecast, by Country 2019 & 2032
- Table 51: China Natural Food Colorants Market Revenue (Million) Forecast, by Application 2019 & 2032
- Table 52: Japan Natural Food Colorants Market Revenue (Million) Forecast, by Application 2019 & 2032
- Table 53: India Natural Food Colorants Market Revenue (Million) Forecast, by Application 2019 & 2032
- Table 54: Australia Natural Food Colorants Market Revenue (Million) Forecast, by Application 2019 & 2032
- Table 55: Rest of Asia Pacific Natural Food Colorants Market Revenue (Million) Forecast, by Application 2019 & 2032
- Table 56: Global Natural Food Colorants Market Revenue Million Forecast, by Application 2019 & 2032
- Table 57: Global Natural Food Colorants Market Revenue Million Forecast, by Country 2019 & 2032
- Table 58: Brazil Natural Food Colorants Market Revenue (Million) Forecast, by Application 2019 & 2032
- Table 59: Argentina Natural Food Colorants Market Revenue (Million) Forecast, by Application 2019 & 2032
- Table 60: Rest of South America Natural Food Colorants Market Revenue (Million) Forecast, by Application 2019 & 2032
- Table 61: Global Natural Food Colorants Market Revenue Million Forecast, by Application 2019 & 2032
- Table 62: Global Natural Food Colorants Market Revenue Million Forecast, by Country 2019 & 2032
- Table 63: Global Natural Food Colorants Market Revenue Million Forecast, by Application 2019 & 2032
- Table 64: Global Natural Food Colorants Market Revenue Million Forecast, by Country 2019 & 2032
- Table 65: Saudi Arabia Natural Food Colorants Market Revenue (Million) Forecast, by Application 2019 & 2032
- Table 66: Egypt Natural Food Colorants Market Revenue (Million) Forecast, by Application 2019 & 2032
- Table 67: South Africa Natural Food Colorants Market Revenue (Million) Forecast, by Application 2019 & 2032
- Table 68: Rest of Middle East Natural Food Colorants Market Revenue (Million) Forecast, by Application 2019 & 2032
Frequently Asked Questions
1. What is the projected Compound Annual Growth Rate (CAGR) of the Natural Food Colorants Market?
The projected CAGR is approximately 8.47%.
2. Which companies are prominent players in the Natural Food Colorants Market?
Key companies in the market include Kalsec Inc, DDW Inc, Chr Hansen Holding AS, Sensient Technologies, Givaudan SA, Koninklijke DSM NV, Synthite Industries Private Ltd, Symrise AG, Archer Daniels Midland Company*List Not Exhaustive.
3. What are the main segments of the Natural Food Colorants Market?
The market segments include Application.
4. Can you provide details about the market size?
The market size is estimated to be USD 2.07 Million as of 2022.
5. What are some drivers contributing to market growth?
Rising Health Consciousness among consumer.
6. What are the notable trends driving market growth?
Brightening Spotlight on Coloring Foodstuff.
7. Are there any restraints impacting market growth?
High Cost of natural Ingredients.
8. Can you provide examples of recent developments in the market?
In January 2021, GNT Group added a new pink shade coloring agent under its EXBERRY® brand with the name EXBERRY® Shade Pink - OD, which is developed for use in fat-based applications. It is also available in red, yellow, orange, blue, and green variants.
9. What pricing options are available for accessing the report?
Pricing options include single-user, multi-user, and enterprise licenses priced at USD 4750, USD 5250, and USD 8750 respectively.
10. Is the market size provided in terms of value or volume?
The market size is provided in terms of value, measured in Million.
11. Are there any specific market keywords associated with the report?
Yes, the market keyword associated with the report is "Natural Food Colorants Market," which aids in identifying and referencing the specific market segment covered.
12. How do I determine which pricing option suits my needs best?
The pricing options vary based on user requirements and access needs. Individual users may opt for single-user licenses, while businesses requiring broader access may choose multi-user or enterprise licenses for cost-effective access to the report.
13. Are there any additional resources or data provided in the Natural Food Colorants Market report?
While the report offers comprehensive insights, it's advisable to review the specific contents or supplementary materials provided to ascertain if additional resources or data are available.
14. How can I stay updated on further developments or reports in the Natural Food Colorants Market?
To stay informed about further developments, trends, and reports in the Natural Food Colorants Market, consider subscribing to industry newsletters, following relevant companies and organizations, or regularly checking reputable industry news sources and publications.
Methodology
Step 1 - Identification of Relevant Samples Size from Population Database


Step 2 - Approaches for Defining Global Market Size (Value, Volume* & Price*)

Note*: In applicable scenarios
Step 3 - Data Sources
Primary Research
- Web Analytics
- Survey Reports
- Research Institute
- Latest Research Reports
- Opinion Leaders
Secondary Research
- Annual Reports
- White Paper
- Latest Press Release
- Industry Association
- Paid Database
- Investor Presentations

Step 4 - Data Triangulation
Involves using different sources of information in order to increase the validity of a study
These sources are likely to be stakeholders in a program - participants, other researchers, program staff, other community members, and so on.
Then we put all data in single framework & apply various statistical tools to find out the dynamic on the market.
During the analysis stage, feedback from the stakeholder groups would be compared to determine areas of agreement as well as areas of divergence
