

Key Insights
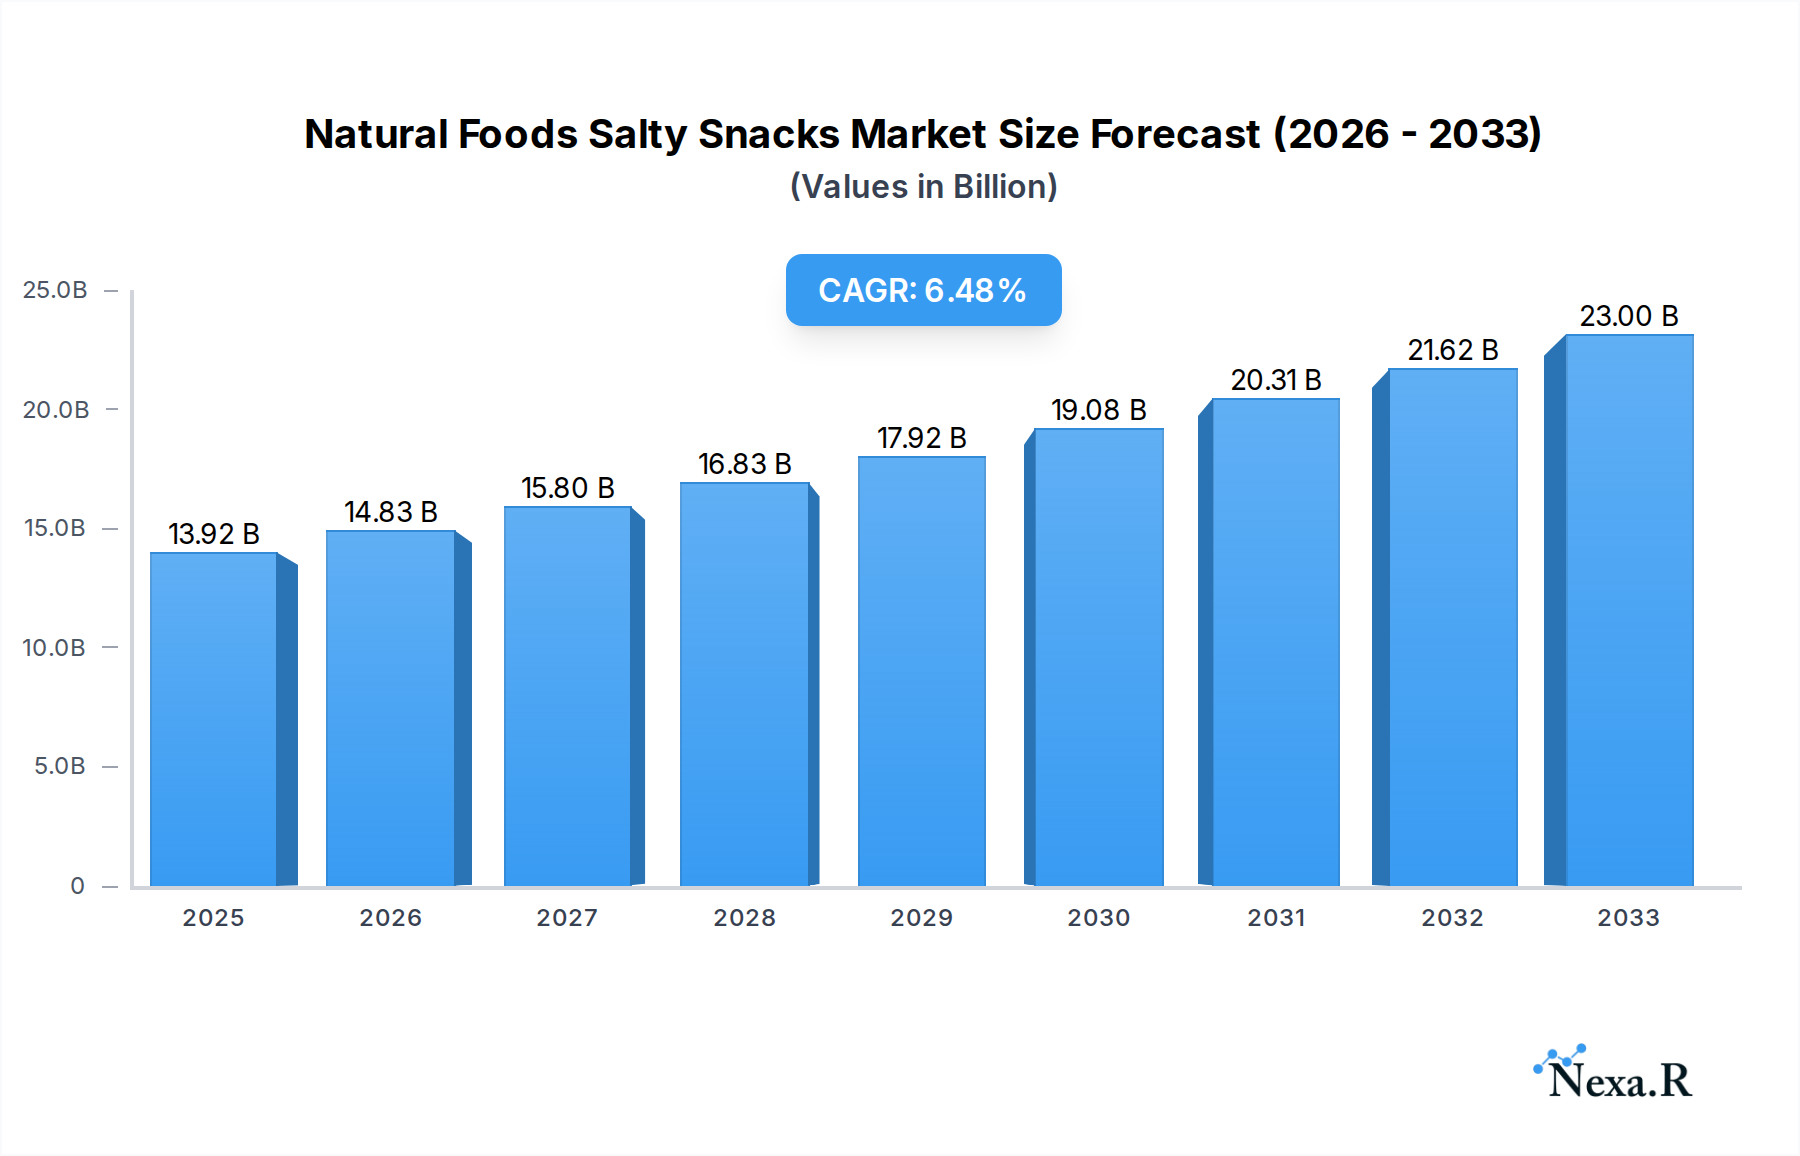
The Natural Foods Salty Snacks market is poised for significant expansion, currently valued at $13,920 million. This growth is fueled by a confluence of evolving consumer preferences and a heightened awareness of health and wellness. Consumers are increasingly seeking snack options that align with their dietary goals, moving away from traditional, heavily processed alternatives towards products perceived as cleaner, more nutritious, and free from artificial ingredients. This demand is driving innovation and the introduction of a wider variety of snacks made from natural ingredients like nuts, grains, and vegetables, offering a healthier alternative for on-the-go consumption and mindful indulgence. The market's robust trajectory is underscored by a projected Compound Annual Growth Rate (CAGR) of 6.6% over the forecast period, indicating sustained and dynamic growth. Key market drivers include the rising popularity of plant-based diets, the demand for transparent ingredient lists, and the expanding distribution channels, particularly the significant surge in online sales. This shift towards digital commerce allows for greater accessibility and a wider reach for natural food brands.

Natural Foods Salty Snacks Market Size (In Billion)
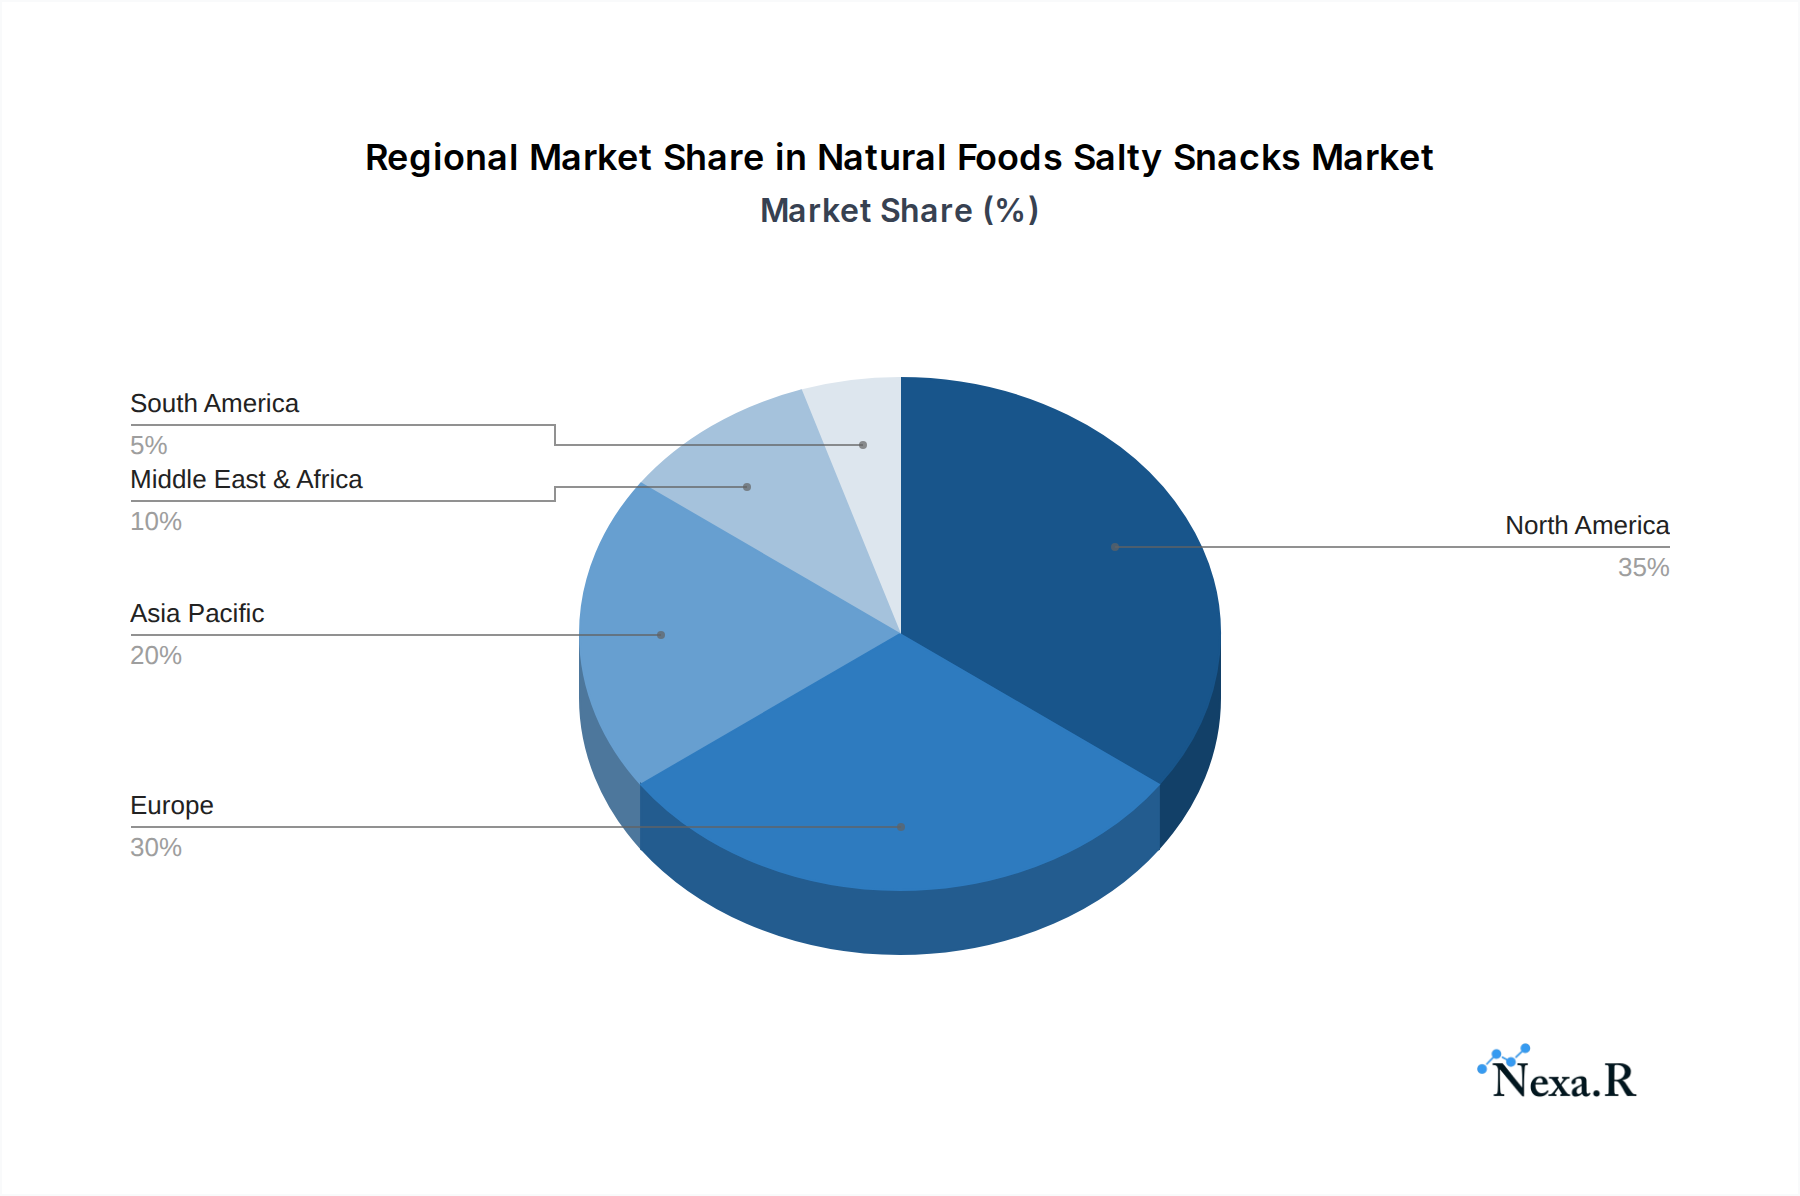
The competitive landscape is characterized by the presence of both established food giants and emerging niche players, all vying to capture market share by innovating in product formulation, packaging, and marketing. Companies are focusing on developing snacks that not only offer health benefits but also deliver appealing taste profiles and convenient formats. The market is segmented by application, with online sales showing particularly strong growth, and by product type, with nuts and grains forming substantial segments alongside a growing demand for vegetable-based options. Geographically, North America and Europe are leading the market, driven by developed economies with a high consumer propensity for health-conscious products. However, the Asia Pacific region presents a substantial growth opportunity due to its burgeoning middle class and increasing adoption of Western dietary trends, coupled with a growing awareness of healthy eating habits. The strategic initiatives of leading companies like Mars, Mondelez, and PepsiCo, alongside specialized brands such as Siete Family Foods and Blue Diamond, are shaping the market's future, focusing on sustainability, ingredient sourcing, and product diversification.
Natural Foods Salty Snacks Company Market Share
Natural Foods Salty Snacks Market: Comprehensive Report Overview
This comprehensive report offers an in-depth analysis of the global Natural Foods Salty Snacks market, spanning from 2019 to 2033, with a base and estimated year of 2025. It meticulously dissects market dynamics, growth trends, regional dominance, product innovations, key drivers, barriers, emerging opportunities, and the competitive landscape, providing actionable insights for industry stakeholders. The report covers the parent market and child market segments, presenting all quantitative data in millions of units for clarity and ease of understanding.
Natural Foods Salty Snacks Market Dynamics & Structure
The Natural Foods Salty Snacks market exhibits a moderately consolidated structure, with a few key players holding significant market share while a growing number of smaller brands cater to niche consumer demands. Technological innovation is a primary driver, particularly in developing novel processing techniques for healthier ingredients, extended shelf life, and unique flavor profiles. Regulatory frameworks, focusing on ingredient transparency, nutritional labeling, and sustainable sourcing, are shaping product development and manufacturing processes. Competitive product substitutes, ranging from traditional snacks to healthier alternatives like fruit-based snacks and protein bars, continuously challenge the market's established players. End-user demographics are evolving, with a strong inclination towards health-conscious millennials and Gen Z consumers seeking transparent ingredient lists and functional benefits. Mergers and Acquisitions (M&A) trends are evident as larger companies seek to acquire innovative startups and expand their portfolio in the burgeoning healthy snacking segment. For instance, the M&A deal volume in the healthy snack sector has seen a significant uptick, estimated at approximately 30-40 deals annually over the historical period. Innovation barriers often relate to the higher cost of premium natural ingredients and the challenge of achieving desired taste and texture profiles without artificial additives.
- Market Concentration: Moderately consolidated with a mix of large corporations and agile startups.
- Technological Innovation Drivers: Healthier processing, extended shelf life, novel flavor development, and functional ingredient integration.
- Regulatory Frameworks: Focus on ingredient transparency, nutritional accuracy, and sustainable sourcing practices.
- Competitive Product Substitutes: Traditional snacks, fruit snacks, protein bars, and other health-oriented alternatives.
- End-User Demographics: Growing demand from health-conscious millennials, Gen Z, and families.
- M&A Trends: Strategic acquisitions by larger players to expand product portfolios and market reach.
- Innovation Barriers: Cost of premium ingredients, achieving desired taste/texture, and scaling production.
Natural Foods Salty Snacks Growth Trends & Insights
The global Natural Foods Salty Snacks market is projected to witness robust growth driven by an escalating consumer preference for healthier and ethically sourced food options. Over the historical period (2019-2024), the market size has expanded considerably, with an estimated CAGR of approximately 6.5%. This upward trajectory is expected to continue through the forecast period (2025-2033). The adoption rates for natural and organic snack options have surged, fueled by increasing awareness of the detrimental effects of artificial ingredients and processed foods. Technological disruptions, including advancements in plant-based ingredient sourcing, innovative snack formats, and sustainable packaging solutions, are further accelerating market penetration. Consumer behavior shifts are central to this growth, with consumers actively seeking out snacks that align with their wellness goals, dietary restrictions (e.g., gluten-free, vegan), and environmental values. The market penetration for natural salty snacks is estimated to have grown from around 18% in 2019 to an estimated 28% by the end of 2024, indicating a significant shift in consumer purchasing habits. The base year (2025) is expected to see market revenue reaching an estimated $75,000 million, with projections for continued expansion. The market is characterized by a strong emphasis on clean labels, reduced sodium content, and the incorporation of superfoods and functional ingredients, reflecting a deeper consumer understanding of nutrition and its impact on overall health. Online sales channels are playing an increasingly vital role in this evolution, offering consumers greater access to a wider variety of natural snack options and detailed product information. The market size evolution is a testament to the sustained demand for healthier snacking alternatives that cater to diverse dietary needs and ethical considerations.
Dominant Regions, Countries, or Segments in Natural Foods Salty Snacks
The North America region currently dominates the global Natural Foods Salty Snacks market, driven by a highly health-conscious consumer base, strong disposable incomes, and well-established distribution networks for natural and organic products. Within North America, the United States stands out as the leading country, accounting for a significant portion of regional sales. The Application: Online Sales segment is experiencing exponential growth, reflecting a broader shift in consumer purchasing behavior towards e-commerce platforms for convenience and wider product selection. This segment is projected to capture an increasing market share, estimated to grow from approximately 35% in 2023 to over 50% by 2033. The Type: Nuts segment holds a substantial market share within the natural salty snacks category, owing to their perceived nutritional benefits, versatility, and widespread availability. Nuts are a staple for health-conscious consumers seeking protein, healthy fats, and fiber. However, the Type: Grains segment, encompassing items like quinoa puffs, rice cakes, and whole-grain crackers, is also exhibiting strong growth, driven by innovation in gluten-free and whole-grain options.
Key drivers for North America's dominance include:
- Economic Policies: Favorable policies supporting organic and sustainable agriculture, coupled with robust economic growth, empower consumers to opt for premium natural snacks.
- Infrastructure: Highly developed retail infrastructure, including supermarkets, specialty health food stores, and a sophisticated online retail ecosystem, ensures widespread accessibility.
- Consumer Awareness: High levels of consumer education regarding health and wellness, coupled with proactive media campaigns, have fostered a strong demand for natural food products.
- Market Share: North America is estimated to hold around 40-45% of the global market share in 2024.
- Growth Potential: While mature, the region continues to see growth driven by product innovation and evolving consumer preferences for functional ingredients and unique flavor profiles.
The Type: Vegetables segment is also gaining traction, with innovations in dehydrated vegetable chips and crisps offering healthy and flavorful alternatives. The ongoing trend towards plant-based diets further bolsters the growth of vegetable-based snacks.
Natural Foods Salty Snacks Product Landscape
The product landscape of Natural Foods Salty Snacks is characterized by a dynamic evolution driven by innovation and a keen understanding of consumer demands. Key product innovations include the introduction of ancient grain-based snacks, such as sorghum and millet crackers, offering superior nutritional profiles. Plant-based protein snacks derived from peas, chickpeas, and lentils are gaining significant traction, catering to vegan and vegetarian consumers. Brands are increasingly focusing on transparency in sourcing, with many highlighting the origin of their ingredients and their commitment to sustainable farming practices. Performance metrics are steadily improving, with manufacturers focusing on reducing sodium content, eliminating artificial preservatives and flavors, and enhancing the overall nutritional value through fortification with vitamins and minerals. Unique selling propositions often revolve around unique flavor fusions, exotic spices, and international culinary influences. Technological advancements are enabling the creation of crisper textures and more appealing sensory experiences without compromising on health benefits.
Key Drivers, Barriers & Challenges in Natural Foods Salty Snacks
Key Drivers: The Natural Foods Salty Snacks market is propelled by several key forces. A growing global awareness of health and wellness is the primary driver, leading consumers to seek out healthier snacking alternatives. The rising demand for plant-based and vegan options further fuels growth, aligning with ethical and environmental concerns. Technological advancements in ingredient processing and product development allow for healthier, tastier, and more convenient snack options. Favorable regulatory landscapes that promote transparency and clean labeling also contribute significantly. The increasing disposable income in emerging economies also allows for greater consumer spending on premium, health-conscious products.
Key Barriers & Challenges: Despite strong growth, the market faces several challenges. The higher cost of premium natural and organic ingredients compared to conventional counterparts can lead to higher retail prices, potentially limiting accessibility for price-sensitive consumers. Supply chain complexities, particularly in sourcing specific natural ingredients consistently and sustainably, can pose significant operational hurdles. Intense competition from both established snack giants with natural product lines and numerous emerging startups creates a crowded marketplace. Stringent regulatory compliance for labeling, ingredient claims, and food safety can also be a considerable undertaking, especially for smaller manufacturers. Furthermore, achieving a balance between healthy attributes (e.g., low sodium, low fat) and desirable taste and texture profiles remains an ongoing challenge. The estimated impact of supply chain disruptions on product availability has been in the range of 5-10% over the past few years.
Emerging Opportunities in Natural Foods Salty Snacks
Emerging opportunities in the Natural Foods Salty Snacks sector are abundant, driven by evolving consumer preferences and innovative product development. The untapped potential in functional snacks, incorporating ingredients like probiotics, adaptogens, and nootropics for specific health benefits (e.g., gut health, stress relief), presents a significant avenue for growth. The expansion into emerging markets, particularly in Asia and Latin America, where the demand for healthy snacks is rapidly growing, offers substantial untapped potential. Innovations in sustainable packaging solutions, including biodegradable and compostable materials, are also becoming a key differentiator and an opportunity to appeal to environmentally conscious consumers. Furthermore, the development of personalized snack options, catering to specific dietary needs and preferences through direct-to-consumer models, represents a burgeoning opportunity.
Growth Accelerators in the Natural Foods Salty Snacks Industry
The long-term growth of the Natural Foods Salty Snacks industry is significantly accelerated by several key catalysts. Technological breakthroughs in areas like fermentation, extrusion, and air-frying are enabling the creation of healthier and more texturally appealing snacks with reduced fat and calorie content. Strategic partnerships between ingredient suppliers, manufacturers, and retailers are crucial for ensuring consistent supply chains, driving innovation, and expanding market reach. Market expansion strategies, including entering new geographical regions and targeting diverse consumer segments, play a pivotal role in sustained growth. The increasing investment from venture capital firms into innovative natural food startups is also a significant growth accelerator, injecting capital for research, development, and market penetration.
Key Players Shaping the Natural Foods Salty Snacks Market
- Mars
- Popchips
- The Hain Celestial Group
- Simply 7
- Late July
- Siete Family Foods
- Mondelez
- Blue Diamond
- The Wonderful Company
- Brami
- Yumi's
- Propercorn
- Inka Crops
- Campbell Soup Company
- PepsiCo
- Kellogg's
- General Mills
- Calbee
- The Kraft Heinz Company
- Hormel Foods
Notable Milestones in Natural Foods Salty Snacks Sector
- 2020: Launch of plant-based protein crisps by several emerging brands, capitalizing on the vegan trend.
- 2021: Increased focus on sustainable packaging solutions, with major players committing to reduce plastic usage.
- 2022: Introduction of functional snacks incorporating adaptogens and prebiotics to cater to the wellness market.
- 2023: Significant M&A activity as larger corporations acquire innovative natural snack startups to expand their portfolios.
- 2024: Rising popularity of ancient grain-based snacks, offering unique textures and nutritional benefits.
In-Depth Natural Foods Salty Snacks Market Outlook
The future outlook for the Natural Foods Salty Snacks market is exceptionally bright, driven by an unwavering consumer shift towards healthier and more sustainable food choices. Growth accelerators such as ongoing technological innovation in healthier processing techniques and the development of novel plant-based ingredients will continue to shape product offerings. Strategic partnerships between ingredient innovators and established snack manufacturers are expected to drive wider adoption and accessibility. Furthermore, strategic market expansion into developing economies, coupled with a growing awareness of the benefits of natural foods, will unlock new revenue streams. The market is poised for sustained expansion, presenting significant opportunities for companies that can effectively cater to the evolving demands for transparency, functionality, and ethical production in the global snack industry.
Natural Foods Salty Snacks Segmentation
-
1. Application
- 1.1. Online Sales
- 1.2. Offline Sales
-
2. Type
- 2.1. Nuts
- 2.2. Grains
- 2.3. Vegetables
- 2.4. Others
Natural Foods Salty Snacks Segmentation By Geography
-
1. North America
- 1.1. United States
- 1.2. Canada
- 1.3. Mexico
-
2. South America
- 2.1. Brazil
- 2.2. Argentina
- 2.3. Rest of South America
-
3. Europe
- 3.1. United Kingdom
- 3.2. Germany
- 3.3. France
- 3.4. Italy
- 3.5. Spain
- 3.6. Russia
- 3.7. Benelux
- 3.8. Nordics
- 3.9. Rest of Europe
-
4. Middle East & Africa
- 4.1. Turkey
- 4.2. Israel
- 4.3. GCC
- 4.4. North Africa
- 4.5. South Africa
- 4.6. Rest of Middle East & Africa
-
5. Asia Pacific
- 5.1. China
- 5.2. India
- 5.3. Japan
- 5.4. South Korea
- 5.5. ASEAN
- 5.6. Oceania
- 5.7. Rest of Asia Pacific
Natural Foods Salty Snacks Regional Market Share
Geographic Coverage of Natural Foods Salty Snacks
Natural Foods Salty Snacks REPORT HIGHLIGHTS
| Aspects | Details |
|---|---|
| Study Period | 2020-2034 |
| Base Year | 2025 |
| Estimated Year | 2026 |
| Forecast Period | 2026-2034 |
| Historical Period | 2020-2025 |
| Growth Rate | CAGR of 6.6% from 2020-2034 |
| Segmentation |
|
Table of Contents
- 1. Introduction
- 1.1. Research Scope
- 1.2. Market Segmentation
- 1.3. Research Methodology
- 1.4. Definitions and Assumptions
- 2. Executive Summary
- 2.1. Introduction
- 3. Market Dynamics
- 3.1. Introduction
- 3.2. Market Drivers
- 3.3. Market Restrains
- 3.4. Market Trends
- 4. Market Factor Analysis
- 4.1. Porters Five Forces
- 4.2. Supply/Value Chain
- 4.3. PESTEL analysis
- 4.4. Market Entropy
- 4.5. Patent/Trademark Analysis
- 5. Global Natural Foods Salty Snacks Analysis, Insights and Forecast, 2020-2032
- 5.1. Market Analysis, Insights and Forecast - by Application
- 5.1.1. Online Sales
- 5.1.2. Offline Sales
- 5.2. Market Analysis, Insights and Forecast - by Type
- 5.2.1. Nuts
- 5.2.2. Grains
- 5.2.3. Vegetables
- 5.2.4. Others
- 5.3. Market Analysis, Insights and Forecast - by Region
- 5.3.1. North America
- 5.3.2. South America
- 5.3.3. Europe
- 5.3.4. Middle East & Africa
- 5.3.5. Asia Pacific
- 5.1. Market Analysis, Insights and Forecast - by Application
- 6. North America Natural Foods Salty Snacks Analysis, Insights and Forecast, 2020-2032
- 6.1. Market Analysis, Insights and Forecast - by Application
- 6.1.1. Online Sales
- 6.1.2. Offline Sales
- 6.2. Market Analysis, Insights and Forecast - by Type
- 6.2.1. Nuts
- 6.2.2. Grains
- 6.2.3. Vegetables
- 6.2.4. Others
- 6.1. Market Analysis, Insights and Forecast - by Application
- 7. South America Natural Foods Salty Snacks Analysis, Insights and Forecast, 2020-2032
- 7.1. Market Analysis, Insights and Forecast - by Application
- 7.1.1. Online Sales
- 7.1.2. Offline Sales
- 7.2. Market Analysis, Insights and Forecast - by Type
- 7.2.1. Nuts
- 7.2.2. Grains
- 7.2.3. Vegetables
- 7.2.4. Others
- 7.1. Market Analysis, Insights and Forecast - by Application
- 8. Europe Natural Foods Salty Snacks Analysis, Insights and Forecast, 2020-2032
- 8.1. Market Analysis, Insights and Forecast - by Application
- 8.1.1. Online Sales
- 8.1.2. Offline Sales
- 8.2. Market Analysis, Insights and Forecast - by Type
- 8.2.1. Nuts
- 8.2.2. Grains
- 8.2.3. Vegetables
- 8.2.4. Others
- 8.1. Market Analysis, Insights and Forecast - by Application
- 9. Middle East & Africa Natural Foods Salty Snacks Analysis, Insights and Forecast, 2020-2032
- 9.1. Market Analysis, Insights and Forecast - by Application
- 9.1.1. Online Sales
- 9.1.2. Offline Sales
- 9.2. Market Analysis, Insights and Forecast - by Type
- 9.2.1. Nuts
- 9.2.2. Grains
- 9.2.3. Vegetables
- 9.2.4. Others
- 9.1. Market Analysis, Insights and Forecast - by Application
- 10. Asia Pacific Natural Foods Salty Snacks Analysis, Insights and Forecast, 2020-2032
- 10.1. Market Analysis, Insights and Forecast - by Application
- 10.1.1. Online Sales
- 10.1.2. Offline Sales
- 10.2. Market Analysis, Insights and Forecast - by Type
- 10.2.1. Nuts
- 10.2.2. Grains
- 10.2.3. Vegetables
- 10.2.4. Others
- 10.1. Market Analysis, Insights and Forecast - by Application
- 11. Competitive Analysis
- 11.1. Global Market Share Analysis 2025
- 11.2. Company Profiles
- 11.2.1 Mars
- 11.2.1.1. Overview
- 11.2.1.2. Products
- 11.2.1.3. SWOT Analysis
- 11.2.1.4. Recent Developments
- 11.2.1.5. Financials (Based on Availability)
- 11.2.2 Popchips
- 11.2.2.1. Overview
- 11.2.2.2. Products
- 11.2.2.3. SWOT Analysis
- 11.2.2.4. Recent Developments
- 11.2.2.5. Financials (Based on Availability)
- 11.2.3 The Hain Celestial Group
- 11.2.3.1. Overview
- 11.2.3.2. Products
- 11.2.3.3. SWOT Analysis
- 11.2.3.4. Recent Developments
- 11.2.3.5. Financials (Based on Availability)
- 11.2.4 Simply 7
- 11.2.4.1. Overview
- 11.2.4.2. Products
- 11.2.4.3. SWOT Analysis
- 11.2.4.4. Recent Developments
- 11.2.4.5. Financials (Based on Availability)
- 11.2.5 Late July
- 11.2.5.1. Overview
- 11.2.5.2. Products
- 11.2.5.3. SWOT Analysis
- 11.2.5.4. Recent Developments
- 11.2.5.5. Financials (Based on Availability)
- 11.2.6 Siete Family Foods
- 11.2.6.1. Overview
- 11.2.6.2. Products
- 11.2.6.3. SWOT Analysis
- 11.2.6.4. Recent Developments
- 11.2.6.5. Financials (Based on Availability)
- 11.2.7 Mondelez
- 11.2.7.1. Overview
- 11.2.7.2. Products
- 11.2.7.3. SWOT Analysis
- 11.2.7.4. Recent Developments
- 11.2.7.5. Financials (Based on Availability)
- 11.2.8 Blue Diamond
- 11.2.8.1. Overview
- 11.2.8.2. Products
- 11.2.8.3. SWOT Analysis
- 11.2.8.4. Recent Developments
- 11.2.8.5. Financials (Based on Availability)
- 11.2.9 The Wonderful Company
- 11.2.9.1. Overview
- 11.2.9.2. Products
- 11.2.9.3. SWOT Analysis
- 11.2.9.4. Recent Developments
- 11.2.9.5. Financials (Based on Availability)
- 11.2.10 Brami
- 11.2.10.1. Overview
- 11.2.10.2. Products
- 11.2.10.3. SWOT Analysis
- 11.2.10.4. Recent Developments
- 11.2.10.5. Financials (Based on Availability)
- 11.2.11 Yumi's
- 11.2.11.1. Overview
- 11.2.11.2. Products
- 11.2.11.3. SWOT Analysis
- 11.2.11.4. Recent Developments
- 11.2.11.5. Financials (Based on Availability)
- 11.2.12 Propercorn
- 11.2.12.1. Overview
- 11.2.12.2. Products
- 11.2.12.3. SWOT Analysis
- 11.2.12.4. Recent Developments
- 11.2.12.5. Financials (Based on Availability)
- 11.2.13 Inka Crops
- 11.2.13.1. Overview
- 11.2.13.2. Products
- 11.2.13.3. SWOT Analysis
- 11.2.13.4. Recent Developments
- 11.2.13.5. Financials (Based on Availability)
- 11.2.14 Campbell Soup Company
- 11.2.14.1. Overview
- 11.2.14.2. Products
- 11.2.14.3. SWOT Analysis
- 11.2.14.4. Recent Developments
- 11.2.14.5. Financials (Based on Availability)
- 11.2.15 PepsiCo
- 11.2.15.1. Overview
- 11.2.15.2. Products
- 11.2.15.3. SWOT Analysis
- 11.2.15.4. Recent Developments
- 11.2.15.5. Financials (Based on Availability)
- 11.2.16 Kellogg's
- 11.2.16.1. Overview
- 11.2.16.2. Products
- 11.2.16.3. SWOT Analysis
- 11.2.16.4. Recent Developments
- 11.2.16.5. Financials (Based on Availability)
- 11.2.17 General Mills
- 11.2.17.1. Overview
- 11.2.17.2. Products
- 11.2.17.3. SWOT Analysis
- 11.2.17.4. Recent Developments
- 11.2.17.5. Financials (Based on Availability)
- 11.2.18 Calbee
- 11.2.18.1. Overview
- 11.2.18.2. Products
- 11.2.18.3. SWOT Analysis
- 11.2.18.4. Recent Developments
- 11.2.18.5. Financials (Based on Availability)
- 11.2.19 The Kraft Heinz Company
- 11.2.19.1. Overview
- 11.2.19.2. Products
- 11.2.19.3. SWOT Analysis
- 11.2.19.4. Recent Developments
- 11.2.19.5. Financials (Based on Availability)
- 11.2.20 Hormel Foods
- 11.2.20.1. Overview
- 11.2.20.2. Products
- 11.2.20.3. SWOT Analysis
- 11.2.20.4. Recent Developments
- 11.2.20.5. Financials (Based on Availability)
- 11.2.1 Mars
List of Figures
- Figure 1: Global Natural Foods Salty Snacks Revenue Breakdown (million, %) by Region 2025 & 2033
- Figure 2: North America Natural Foods Salty Snacks Revenue (million), by Application 2025 & 2033
- Figure 3: North America Natural Foods Salty Snacks Revenue Share (%), by Application 2025 & 2033
- Figure 4: North America Natural Foods Salty Snacks Revenue (million), by Type 2025 & 2033
- Figure 5: North America Natural Foods Salty Snacks Revenue Share (%), by Type 2025 & 2033
- Figure 6: North America Natural Foods Salty Snacks Revenue (million), by Country 2025 & 2033
- Figure 7: North America Natural Foods Salty Snacks Revenue Share (%), by Country 2025 & 2033
- Figure 8: South America Natural Foods Salty Snacks Revenue (million), by Application 2025 & 2033
- Figure 9: South America Natural Foods Salty Snacks Revenue Share (%), by Application 2025 & 2033
- Figure 10: South America Natural Foods Salty Snacks Revenue (million), by Type 2025 & 2033
- Figure 11: South America Natural Foods Salty Snacks Revenue Share (%), by Type 2025 & 2033
- Figure 12: South America Natural Foods Salty Snacks Revenue (million), by Country 2025 & 2033
- Figure 13: South America Natural Foods Salty Snacks Revenue Share (%), by Country 2025 & 2033
- Figure 14: Europe Natural Foods Salty Snacks Revenue (million), by Application 2025 & 2033
- Figure 15: Europe Natural Foods Salty Snacks Revenue Share (%), by Application 2025 & 2033
- Figure 16: Europe Natural Foods Salty Snacks Revenue (million), by Type 2025 & 2033
- Figure 17: Europe Natural Foods Salty Snacks Revenue Share (%), by Type 2025 & 2033
- Figure 18: Europe Natural Foods Salty Snacks Revenue (million), by Country 2025 & 2033
- Figure 19: Europe Natural Foods Salty Snacks Revenue Share (%), by Country 2025 & 2033
- Figure 20: Middle East & Africa Natural Foods Salty Snacks Revenue (million), by Application 2025 & 2033
- Figure 21: Middle East & Africa Natural Foods Salty Snacks Revenue Share (%), by Application 2025 & 2033
- Figure 22: Middle East & Africa Natural Foods Salty Snacks Revenue (million), by Type 2025 & 2033
- Figure 23: Middle East & Africa Natural Foods Salty Snacks Revenue Share (%), by Type 2025 & 2033
- Figure 24: Middle East & Africa Natural Foods Salty Snacks Revenue (million), by Country 2025 & 2033
- Figure 25: Middle East & Africa Natural Foods Salty Snacks Revenue Share (%), by Country 2025 & 2033
- Figure 26: Asia Pacific Natural Foods Salty Snacks Revenue (million), by Application 2025 & 2033
- Figure 27: Asia Pacific Natural Foods Salty Snacks Revenue Share (%), by Application 2025 & 2033
- Figure 28: Asia Pacific Natural Foods Salty Snacks Revenue (million), by Type 2025 & 2033
- Figure 29: Asia Pacific Natural Foods Salty Snacks Revenue Share (%), by Type 2025 & 2033
- Figure 30: Asia Pacific Natural Foods Salty Snacks Revenue (million), by Country 2025 & 2033
- Figure 31: Asia Pacific Natural Foods Salty Snacks Revenue Share (%), by Country 2025 & 2033
List of Tables
- Table 1: Global Natural Foods Salty Snacks Revenue million Forecast, by Application 2020 & 2033
- Table 2: Global Natural Foods Salty Snacks Revenue million Forecast, by Type 2020 & 2033
- Table 3: Global Natural Foods Salty Snacks Revenue million Forecast, by Region 2020 & 2033
- Table 4: Global Natural Foods Salty Snacks Revenue million Forecast, by Application 2020 & 2033
- Table 5: Global Natural Foods Salty Snacks Revenue million Forecast, by Type 2020 & 2033
- Table 6: Global Natural Foods Salty Snacks Revenue million Forecast, by Country 2020 & 2033
- Table 7: United States Natural Foods Salty Snacks Revenue (million) Forecast, by Application 2020 & 2033
- Table 8: Canada Natural Foods Salty Snacks Revenue (million) Forecast, by Application 2020 & 2033
- Table 9: Mexico Natural Foods Salty Snacks Revenue (million) Forecast, by Application 2020 & 2033
- Table 10: Global Natural Foods Salty Snacks Revenue million Forecast, by Application 2020 & 2033
- Table 11: Global Natural Foods Salty Snacks Revenue million Forecast, by Type 2020 & 2033
- Table 12: Global Natural Foods Salty Snacks Revenue million Forecast, by Country 2020 & 2033
- Table 13: Brazil Natural Foods Salty Snacks Revenue (million) Forecast, by Application 2020 & 2033
- Table 14: Argentina Natural Foods Salty Snacks Revenue (million) Forecast, by Application 2020 & 2033
- Table 15: Rest of South America Natural Foods Salty Snacks Revenue (million) Forecast, by Application 2020 & 2033
- Table 16: Global Natural Foods Salty Snacks Revenue million Forecast, by Application 2020 & 2033
- Table 17: Global Natural Foods Salty Snacks Revenue million Forecast, by Type 2020 & 2033
- Table 18: Global Natural Foods Salty Snacks Revenue million Forecast, by Country 2020 & 2033
- Table 19: United Kingdom Natural Foods Salty Snacks Revenue (million) Forecast, by Application 2020 & 2033
- Table 20: Germany Natural Foods Salty Snacks Revenue (million) Forecast, by Application 2020 & 2033
- Table 21: France Natural Foods Salty Snacks Revenue (million) Forecast, by Application 2020 & 2033
- Table 22: Italy Natural Foods Salty Snacks Revenue (million) Forecast, by Application 2020 & 2033
- Table 23: Spain Natural Foods Salty Snacks Revenue (million) Forecast, by Application 2020 & 2033
- Table 24: Russia Natural Foods Salty Snacks Revenue (million) Forecast, by Application 2020 & 2033
- Table 25: Benelux Natural Foods Salty Snacks Revenue (million) Forecast, by Application 2020 & 2033
- Table 26: Nordics Natural Foods Salty Snacks Revenue (million) Forecast, by Application 2020 & 2033
- Table 27: Rest of Europe Natural Foods Salty Snacks Revenue (million) Forecast, by Application 2020 & 2033
- Table 28: Global Natural Foods Salty Snacks Revenue million Forecast, by Application 2020 & 2033
- Table 29: Global Natural Foods Salty Snacks Revenue million Forecast, by Type 2020 & 2033
- Table 30: Global Natural Foods Salty Snacks Revenue million Forecast, by Country 2020 & 2033
- Table 31: Turkey Natural Foods Salty Snacks Revenue (million) Forecast, by Application 2020 & 2033
- Table 32: Israel Natural Foods Salty Snacks Revenue (million) Forecast, by Application 2020 & 2033
- Table 33: GCC Natural Foods Salty Snacks Revenue (million) Forecast, by Application 2020 & 2033
- Table 34: North Africa Natural Foods Salty Snacks Revenue (million) Forecast, by Application 2020 & 2033
- Table 35: South Africa Natural Foods Salty Snacks Revenue (million) Forecast, by Application 2020 & 2033
- Table 36: Rest of Middle East & Africa Natural Foods Salty Snacks Revenue (million) Forecast, by Application 2020 & 2033
- Table 37: Global Natural Foods Salty Snacks Revenue million Forecast, by Application 2020 & 2033
- Table 38: Global Natural Foods Salty Snacks Revenue million Forecast, by Type 2020 & 2033
- Table 39: Global Natural Foods Salty Snacks Revenue million Forecast, by Country 2020 & 2033
- Table 40: China Natural Foods Salty Snacks Revenue (million) Forecast, by Application 2020 & 2033
- Table 41: India Natural Foods Salty Snacks Revenue (million) Forecast, by Application 2020 & 2033
- Table 42: Japan Natural Foods Salty Snacks Revenue (million) Forecast, by Application 2020 & 2033
- Table 43: South Korea Natural Foods Salty Snacks Revenue (million) Forecast, by Application 2020 & 2033
- Table 44: ASEAN Natural Foods Salty Snacks Revenue (million) Forecast, by Application 2020 & 2033
- Table 45: Oceania Natural Foods Salty Snacks Revenue (million) Forecast, by Application 2020 & 2033
- Table 46: Rest of Asia Pacific Natural Foods Salty Snacks Revenue (million) Forecast, by Application 2020 & 2033
Frequently Asked Questions
1. What is the projected Compound Annual Growth Rate (CAGR) of the Natural Foods Salty Snacks?
The projected CAGR is approximately 6.6%.
2. Which companies are prominent players in the Natural Foods Salty Snacks?
Key companies in the market include Mars, Popchips, The Hain Celestial Group, Simply 7, Late July, Siete Family Foods, Mondelez, Blue Diamond, The Wonderful Company, Brami, Yumi's, Propercorn, Inka Crops, Campbell Soup Company, PepsiCo, Kellogg's, General Mills, Calbee, The Kraft Heinz Company, Hormel Foods.
3. What are the main segments of the Natural Foods Salty Snacks?
The market segments include Application, Type.
4. Can you provide details about the market size?
The market size is estimated to be USD 13920 million as of 2022.
5. What are some drivers contributing to market growth?
N/A
6. What are the notable trends driving market growth?
N/A
7. Are there any restraints impacting market growth?
N/A
8. Can you provide examples of recent developments in the market?
N/A
9. What pricing options are available for accessing the report?
Pricing options include single-user, multi-user, and enterprise licenses priced at USD 4250.00, USD 6375.00, and USD 8500.00 respectively.
10. Is the market size provided in terms of value or volume?
The market size is provided in terms of value, measured in million.
11. Are there any specific market keywords associated with the report?
Yes, the market keyword associated with the report is "Natural Foods Salty Snacks," which aids in identifying and referencing the specific market segment covered.
12. How do I determine which pricing option suits my needs best?
The pricing options vary based on user requirements and access needs. Individual users may opt for single-user licenses, while businesses requiring broader access may choose multi-user or enterprise licenses for cost-effective access to the report.
13. Are there any additional resources or data provided in the Natural Foods Salty Snacks report?
While the report offers comprehensive insights, it's advisable to review the specific contents or supplementary materials provided to ascertain if additional resources or data are available.
14. How can I stay updated on further developments or reports in the Natural Foods Salty Snacks?
To stay informed about further developments, trends, and reports in the Natural Foods Salty Snacks, consider subscribing to industry newsletters, following relevant companies and organizations, or regularly checking reputable industry news sources and publications.
Methodology
Step 1 - Identification of Relevant Samples Size from Population Database


Step 2 - Approaches for Defining Global Market Size (Value, Volume* & Price*)

Note*: In applicable scenarios
Step 3 - Data Sources
Primary Research
- Web Analytics
- Survey Reports
- Research Institute
- Latest Research Reports
- Opinion Leaders
Secondary Research
- Annual Reports
- White Paper
- Latest Press Release
- Industry Association
- Paid Database
- Investor Presentations

Step 4 - Data Triangulation
Involves using different sources of information in order to increase the validity of a study
These sources are likely to be stakeholders in a program - participants, other researchers, program staff, other community members, and so on.
Then we put all data in single framework & apply various statistical tools to find out the dynamic on the market.
During the analysis stage, feedback from the stakeholder groups would be compared to determine areas of agreement as well as areas of divergence