

Key Insights
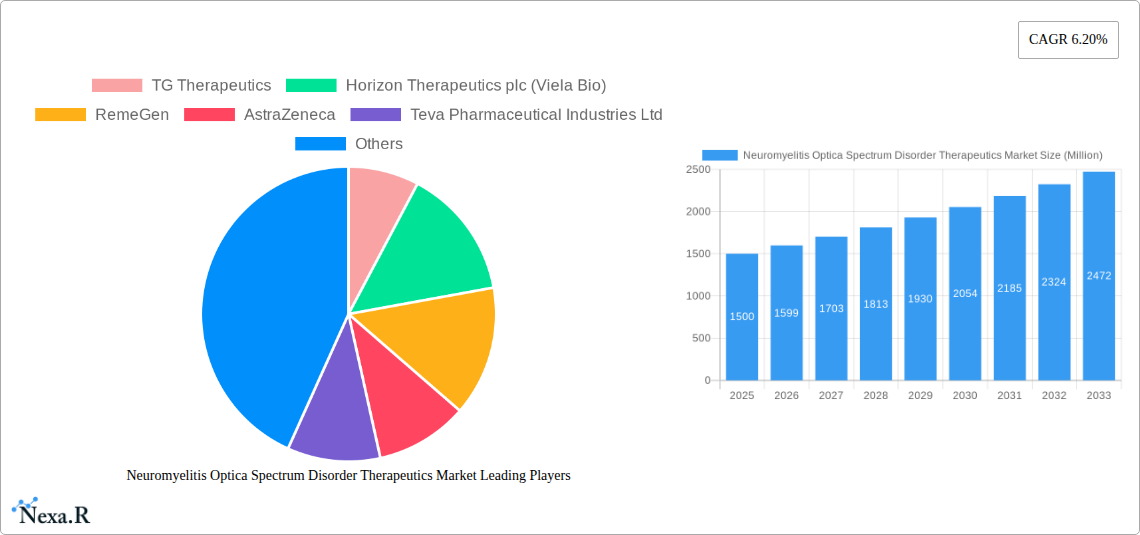
The Neuromyelitis Optica Spectrum Disorder (NMOSD) Therapeutics market is experiencing robust growth, driven by increasing prevalence of NMOSD, rising awareness among healthcare professionals and patients, and ongoing advancements in treatment modalities. The market, valued at approximately $1.5 billion in 2025, is projected to expand at a Compound Annual Growth Rate (CAGR) of 6.20% from 2025 to 2033. This growth is fueled by the introduction of novel therapies targeting specific disease mechanisms, such as monoclonal antibody drugs offering improved efficacy and safety profiles compared to older immunosuppressants. The North American region currently dominates the market due to high healthcare expenditure, robust clinical research infrastructure, and a relatively high prevalence of NMOSD. However, emerging economies in Asia-Pacific are expected to witness significant growth in the coming years due to rising healthcare awareness and increasing disposable incomes. The market is segmented by treatment type, with monoclonal antibody drugs holding the largest share, followed by immunosuppressive agents and plasma exchange therapy. Key players such as TG Therapeutics, Horizon Therapeutics, RemeGen, and AstraZeneca are actively engaged in research and development, driving innovation and competition within the market. While challenges remain, such as high treatment costs and the need for improved diagnostic tools, the overall market outlook for NMOSD therapeutics remains highly positive, driven by a growing understanding of the disease and the continued development of effective therapies.
The competitive landscape is characterized by a mix of established pharmaceutical companies and emerging biotech firms. Strategic alliances, collaborations, and licensing agreements are frequently employed to accelerate drug development and market penetration. Future growth will be influenced by factors such as the approval of new therapies, expanded reimbursement policies, and successful clinical trials demonstrating the efficacy and safety of emerging treatments. The increasing focus on personalized medicine and the development of biomarkers for early diagnosis are also expected to positively impact market growth. Regulatory approvals and pricing strategies will play a crucial role in shaping the market dynamics in the coming years. Furthermore, ongoing research to better understand the disease's pathophysiology and identify novel therapeutic targets will be key to unlocking further market expansion. The successful development and launch of novel therapies with improved efficacy and tolerability profiles will be pivotal in driving future growth and enhancing patient outcomes.
Neuromyelitis Optica Spectrum Disorder (NMOSD) Therapeutics Market: A Comprehensive Report (2019-2033)
This comprehensive report provides an in-depth analysis of the Neuromyelitis Optica Spectrum Disorder (NMOSD) Therapeutics market, encompassing market dynamics, growth trends, regional analysis, product landscape, key players, and future outlook. The report covers the period 2019-2033, with a focus on the 2025-2033 forecast period. The parent market is the broader neurological disorder therapeutics market, while the child market is specifically NMOSD treatments. The market size is estimated in million units.
Neuromyelitis Optica Spectrum Disorder Therapeutics Market Dynamics & Structure
This section analyzes the competitive landscape, technological advancements, regulatory influences, and market trends within the NMOSD therapeutics market. The market is characterized by a moderate level of concentration, with key players actively engaged in R&D and strategic partnerships. Technological innovation, particularly in the development of targeted therapies like monoclonal antibodies, is a major driver. Regulatory approvals and reimbursement policies significantly impact market access. The emergence of biosimilars and the development of novel treatment modalities present both opportunities and challenges. The frequency of M&A activities in the broader neurology sector suggests a potential for consolidation within the NMOSD therapeutics market.
- Market Concentration: Moderately concentrated, with top 5 players holding approximately xx% market share in 2025.
- Technological Innovation: Focus on monoclonal antibodies and other targeted therapies. xx% of new drug development is focused on monoclonal antibodies.
- Regulatory Framework: Stringent regulatory pathways for NMOSD drug approvals impact market entry and timelines.
- Competitive Substitutes: Limited effective substitutes currently available impacting treatment options.
- End-User Demographics: Primarily affects adults, with a prevalence of xx per 100,000 population globally.
- M&A Trends: xx M&A deals related to NMOSD therapeutics have been recorded between 2019-2024.
Neuromyelitis Optica Spectrum Disorder Therapeutics Market Growth Trends & Insights
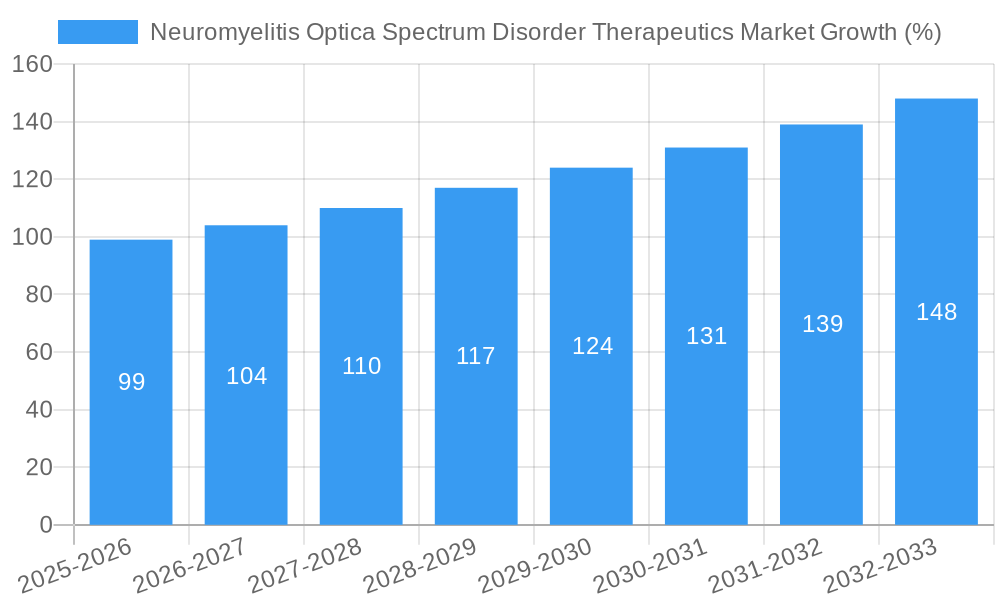
The NMOSD therapeutics market is experiencing significant growth driven by increasing prevalence of the disease, rising awareness, and the introduction of novel therapies. The market size is projected to reach xx million units by 2033, exhibiting a CAGR of xx% during the forecast period (2025-2033). This growth is further fueled by technological advancements, leading to improved treatment efficacy and safety profiles. Adoption rates are increasing due to improved understanding of the disease and better access to specialized healthcare. However, high treatment costs and limited access in certain regions could pose challenges. Shifting consumer preferences towards personalized medicine and targeted therapies also influence market growth.
Dominant Regions, Countries, or Segments in Neuromyelitis Optica Spectrum Disorder Therapeutics Market
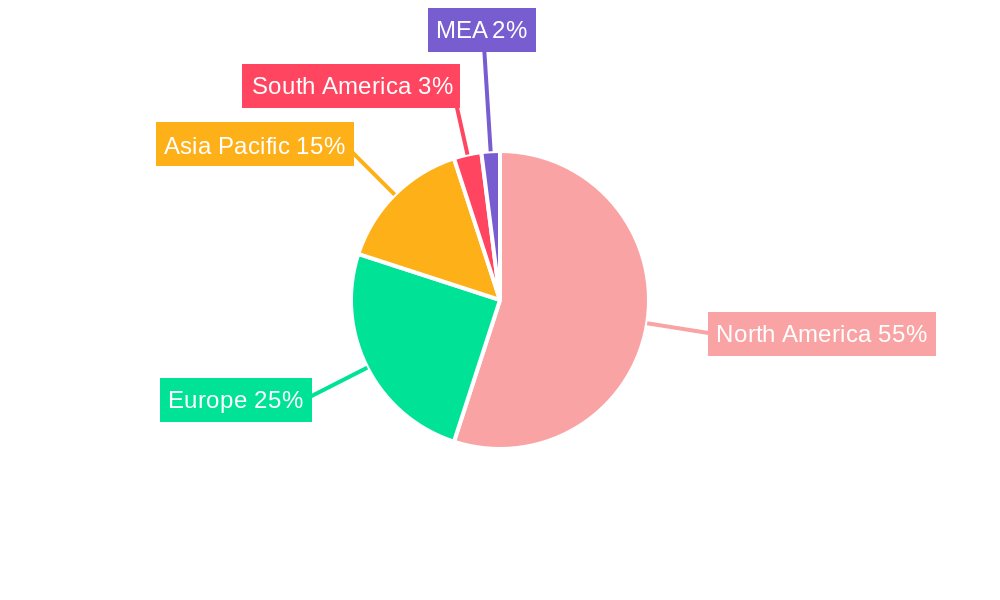
North America currently holds the largest market share in the NMOSD therapeutics market, driven by high healthcare expenditure, robust healthcare infrastructure, and a greater prevalence of the disease. Europe follows as a significant market, while Asia-Pacific is anticipated to show strong growth potential due to increasing awareness and rising disposable incomes. Within treatment segments, Monoclonal Antibody Drugs dominate the market, capturing xx% share in 2025, followed by Immunosuppressive Agents (xx%), Plasma Exchange Therapy (xx%), and Other Treatments (xx%). This dominance is attributed to the effectiveness and improved safety profiles of monoclonal antibody therapies.
- North America: High healthcare expenditure, advanced healthcare infrastructure, and high disease prevalence drive market dominance.
- Europe: Significant market presence with established healthcare systems and high adoption rates.
- Asia-Pacific: High growth potential driven by increasing disease awareness and rising healthcare spending.
- Monoclonal Antibody Drugs: Superior efficacy and safety profiles contribute to market leadership.
- Immunosuppressive Agents: A significant segment offering alternative therapeutic options.
Neuromyelitis Optica Spectrum Disorder Therapeutics Market Product Landscape
The NMOSD therapeutics market features a diverse range of products, including monoclonal antibodies, immunosuppressants, and plasma exchange therapies. Recent innovations focus on improving efficacy, reducing side effects, and offering more convenient administration methods. Companies are actively investing in R&D to develop novel therapies with improved treatment outcomes. This includes exploring personalized medicine approaches to tailor treatment to individual patient needs and genetic profiles. Key selling propositions include higher efficacy, better safety profiles, and improved convenience of administration.
Key Drivers, Barriers & Challenges in Neuromyelitis Optica Spectrum Disorder Therapeutics Market
Key Drivers:
- Increasing prevalence of NMOSD.
- Growing awareness and improved diagnosis.
- Technological advancements resulting in more effective therapies.
- Favorable regulatory landscape and reimbursement policies in key markets.
Key Barriers & Challenges:
- High cost of treatment limiting accessibility in certain regions.
- Complex treatment pathways requiring specialized healthcare infrastructure.
- Potential for adverse events with certain therapies.
- Competition from emerging biosimilars and novel treatment modalities. This leads to a price decrease of approximately xx% annually.
Emerging Opportunities in Neuromyelitis Optica Spectrum Disorder Therapeutics Market
- Development of novel therapies targeting unmet needs, such as those with limited treatment options.
- Expansion into emerging markets with high disease burden but limited access to care.
- Personalized medicine approaches tailored to individual patient characteristics.
- Development of cost-effective and accessible treatment solutions.
Growth Accelerators in the Neuromyelitis Optica Spectrum Disorder Therapeutics Market Industry
Long-term growth in the NMOSD therapeutics market will be driven by continued innovation in targeted therapies, strategic collaborations between pharmaceutical companies and research institutions, and expansion into underserved markets. Strategic partnerships will accelerate the development and commercialization of new treatments. Furthermore, the focus on improving patient access through optimized healthcare infrastructure and streamlined regulatory processes will fuel market expansion.
Key Players Shaping the Neuromyelitis Optica Spectrum Disorder Therapeutics Market Market
- TG Therapeutics
- Horizon Therapeutics plc (Viela Bio)
- RemeGen
- AstraZeneca
- Teva Pharmaceutical Industries Ltd
- Harbour BioMed
- Opexa Therapeutics
- Mitsubishi Tanabe Pharma
- Hoffmann-La Roche Ltd
- Horizon Therapeutics plc
Notable Milestones in Neuromyelitis Optica Spectrum Disorder Therapeutics Market Sector
- 2020/03: FDA approval of a new monoclonal antibody for NMOSD.
- 2021/10: Launch of a new clinical trial for a novel NMOSD treatment.
- 2022/06: Strategic partnership between two leading pharmaceutical companies to develop a novel therapy.
- 2023/01: Publication of landmark research on the epidemiology of NMOSD in a key region.
In-Depth Neuromyelitis Optica Spectrum Disorder Therapeutics Market Market Outlook
The NMOSD therapeutics market holds significant potential for future growth, driven by continuous innovation, increased awareness, and expanding access to treatment. Strategic opportunities exist in developing personalized therapies, penetrating underserved markets, and optimizing treatment pathways to improve patient outcomes. Continued investment in R&D and strategic partnerships will be crucial to realizing the full potential of this market. The future will see a greater emphasis on preventative strategies and personalized approaches, further driving market expansion and diversification.
Neuromyelitis Optica Spectrum Disorder Therapeutics Market Segmentation
-
1. Treatment
- 1.1. Monoclonal Antibody Drugs
- 1.2. Immunosuppressive Agents
- 1.3. Plasma Exchange Therapy
- 1.4. Other Treatments
Neuromyelitis Optica Spectrum Disorder Therapeutics Market Segmentation By Geography
-
1. North America
- 1.1. United States
- 1.2. Canada
- 1.3. Mexico
-
2. Europe
- 2.1. Germany
- 2.2. United Kingdom
- 2.3. France
- 2.4. Italy
- 2.5. Spain
- 2.6. Rest of Europe
-
3. Asia Pacific
- 3.1. China
- 3.2. Japan
- 3.3. India
- 3.4. Australia
- 3.5. South Korea
- 3.6. Rest of Asia Pacific
- 4. Rest of the World
Neuromyelitis Optica Spectrum Disorder Therapeutics Market REPORT HIGHLIGHTS
| Aspects | Details |
|---|---|
| Study Period | 2019-2033 |
| Base Year | 2024 |
| Estimated Year | 2025 |
| Forecast Period | 2025-2033 |
| Historical Period | 2019-2024 |
| Growth Rate | CAGR of 6.20% from 2019-2033 |
| Segmentation |
|
Table of Contents
- 1. Introduction
- 1.1. Research Scope
- 1.2. Market Segmentation
- 1.3. Research Methodology
- 1.4. Definitions and Assumptions
- 2. Executive Summary
- 2.1. Introduction
- 3. Market Dynamics
- 3.1. Introduction
- 3.2. Market Drivers
- 3.2.1 Increasing Incidence of Neuromyelitis Optica Spectrum Disorder; Increasing Research and Development Activities
- 3.2.2 Product Approvals and Rising Demand for Better Treatment Options
- 3.3. Market Restrains
- 3.3.1. High Cost of Therapy for Neuromyelitis Optica Spectrum Disorder
- 3.4. Market Trends
- 3.4.1. Monoclonal Antibody Drugs Segment Expects to Register a High CAGR in the Forecast Period
- 4. Market Factor Analysis
- 4.1. Porters Five Forces
- 4.2. Supply/Value Chain
- 4.3. PESTEL analysis
- 4.4. Market Entropy
- 4.5. Patent/Trademark Analysis
- 5. Global Neuromyelitis Optica Spectrum Disorder Therapeutics Market Analysis, Insights and Forecast, 2019-2031
- 5.1. Market Analysis, Insights and Forecast - by Treatment
- 5.1.1. Monoclonal Antibody Drugs
- 5.1.2. Immunosuppressive Agents
- 5.1.3. Plasma Exchange Therapy
- 5.1.4. Other Treatments
- 5.2. Market Analysis, Insights and Forecast - by Region
- 5.2.1. North America
- 5.2.2. Europe
- 5.2.3. Asia Pacific
- 5.2.4. Rest of the World
- 5.1. Market Analysis, Insights and Forecast - by Treatment
- 6. North America Neuromyelitis Optica Spectrum Disorder Therapeutics Market Analysis, Insights and Forecast, 2019-2031
- 6.1. Market Analysis, Insights and Forecast - by Treatment
- 6.1.1. Monoclonal Antibody Drugs
- 6.1.2. Immunosuppressive Agents
- 6.1.3. Plasma Exchange Therapy
- 6.1.4. Other Treatments
- 6.1. Market Analysis, Insights and Forecast - by Treatment
- 7. Europe Neuromyelitis Optica Spectrum Disorder Therapeutics Market Analysis, Insights and Forecast, 2019-2031
- 7.1. Market Analysis, Insights and Forecast - by Treatment
- 7.1.1. Monoclonal Antibody Drugs
- 7.1.2. Immunosuppressive Agents
- 7.1.3. Plasma Exchange Therapy
- 7.1.4. Other Treatments
- 7.1. Market Analysis, Insights and Forecast - by Treatment
- 8. Asia Pacific Neuromyelitis Optica Spectrum Disorder Therapeutics Market Analysis, Insights and Forecast, 2019-2031
- 8.1. Market Analysis, Insights and Forecast - by Treatment
- 8.1.1. Monoclonal Antibody Drugs
- 8.1.2. Immunosuppressive Agents
- 8.1.3. Plasma Exchange Therapy
- 8.1.4. Other Treatments
- 8.1. Market Analysis, Insights and Forecast - by Treatment
- 9. Rest of the World Neuromyelitis Optica Spectrum Disorder Therapeutics Market Analysis, Insights and Forecast, 2019-2031
- 9.1. Market Analysis, Insights and Forecast - by Treatment
- 9.1.1. Monoclonal Antibody Drugs
- 9.1.2. Immunosuppressive Agents
- 9.1.3. Plasma Exchange Therapy
- 9.1.4. Other Treatments
- 9.1. Market Analysis, Insights and Forecast - by Treatment
- 10. North America Neuromyelitis Optica Spectrum Disorder Therapeutics Market Analysis, Insights and Forecast, 2019-2031
- 10.1. Market Analysis, Insights and Forecast - By Country/Sub-region
- 10.1.1 United States
- 10.1.2 Canada
- 10.1.3 Mexico
- 11. Europe Neuromyelitis Optica Spectrum Disorder Therapeutics Market Analysis, Insights and Forecast, 2019-2031
- 11.1. Market Analysis, Insights and Forecast - By Country/Sub-region
- 11.1.1 Germany
- 11.1.2 United Kingdom
- 11.1.3 France
- 11.1.4 Spain
- 11.1.5 Italy
- 11.1.6 Spain
- 11.1.7 Belgium
- 11.1.8 Netherland
- 11.1.9 Nordics
- 11.1.10 Rest of Europe
- 12. Asia Pacific Neuromyelitis Optica Spectrum Disorder Therapeutics Market Analysis, Insights and Forecast, 2019-2031
- 12.1. Market Analysis, Insights and Forecast - By Country/Sub-region
- 12.1.1 China
- 12.1.2 Japan
- 12.1.3 India
- 12.1.4 South Korea
- 12.1.5 Southeast Asia
- 12.1.6 Australia
- 12.1.7 Indonesia
- 12.1.8 Phillipes
- 12.1.9 Singapore
- 12.1.10 Thailandc
- 12.1.11 Rest of Asia Pacific
- 13. South America Neuromyelitis Optica Spectrum Disorder Therapeutics Market Analysis, Insights and Forecast, 2019-2031
- 13.1. Market Analysis, Insights and Forecast - By Country/Sub-region
- 13.1.1 Brazil
- 13.1.2 Argentina
- 13.1.3 Peru
- 13.1.4 Chile
- 13.1.5 Colombia
- 13.1.6 Ecuador
- 13.1.7 Venezuela
- 13.1.8 Rest of South America
- 14. North America Neuromyelitis Optica Spectrum Disorder Therapeutics Market Analysis, Insights and Forecast, 2019-2031
- 14.1. Market Analysis, Insights and Forecast - By Country/Sub-region
- 14.1.1 United States
- 14.1.2 Canada
- 14.1.3 Mexico
- 15. MEA Neuromyelitis Optica Spectrum Disorder Therapeutics Market Analysis, Insights and Forecast, 2019-2031
- 15.1. Market Analysis, Insights and Forecast - By Country/Sub-region
- 15.1.1 United Arab Emirates
- 15.1.2 Saudi Arabia
- 15.1.3 South Africa
- 15.1.4 Rest of Middle East and Africa
- 16. Competitive Analysis
- 16.1. Global Market Share Analysis 2024
- 16.2. Company Profiles
- 16.2.1 TG Therapeutics
- 16.2.1.1. Overview
- 16.2.1.2. Products
- 16.2.1.3. SWOT Analysis
- 16.2.1.4. Recent Developments
- 16.2.1.5. Financials (Based on Availability)
- 16.2.2 Horizon Therapeutics plc (Viela Bio)
- 16.2.2.1. Overview
- 16.2.2.2. Products
- 16.2.2.3. SWOT Analysis
- 16.2.2.4. Recent Developments
- 16.2.2.5. Financials (Based on Availability)
- 16.2.3 RemeGen
- 16.2.3.1. Overview
- 16.2.3.2. Products
- 16.2.3.3. SWOT Analysis
- 16.2.3.4. Recent Developments
- 16.2.3.5. Financials (Based on Availability)
- 16.2.4 AstraZeneca
- 16.2.4.1. Overview
- 16.2.4.2. Products
- 16.2.4.3. SWOT Analysis
- 16.2.4.4. Recent Developments
- 16.2.4.5. Financials (Based on Availability)
- 16.2.5 Teva Pharmaceutical Industries Ltd
- 16.2.5.1. Overview
- 16.2.5.2. Products
- 16.2.5.3. SWOT Analysis
- 16.2.5.4. Recent Developments
- 16.2.5.5. Financials (Based on Availability)
- 16.2.6 Harbour BioMed
- 16.2.6.1. Overview
- 16.2.6.2. Products
- 16.2.6.3. SWOT Analysis
- 16.2.6.4. Recent Developments
- 16.2.6.5. Financials (Based on Availability)
- 16.2.7 Opexa Therapeutics
- 16.2.7.1. Overview
- 16.2.7.2. Products
- 16.2.7.3. SWOT Analysis
- 16.2.7.4. Recent Developments
- 16.2.7.5. Financials (Based on Availability)
- 16.2.8 Mitsubishi Tanabe Pharma
- 16.2.8.1. Overview
- 16.2.8.2. Products
- 16.2.8.3. SWOT Analysis
- 16.2.8.4. Recent Developments
- 16.2.8.5. Financials (Based on Availability)
- 16.2.9 Hoffmann-La Roche Ltd
- 16.2.9.1. Overview
- 16.2.9.2. Products
- 16.2.9.3. SWOT Analysis
- 16.2.9.4. Recent Developments
- 16.2.9.5. Financials (Based on Availability)
- 16.2.10 Horizon Therapeutics plc
- 16.2.10.1. Overview
- 16.2.10.2. Products
- 16.2.10.3. SWOT Analysis
- 16.2.10.4. Recent Developments
- 16.2.10.5. Financials (Based on Availability)
- 16.2.1 TG Therapeutics
List of Figures
- Figure 1: Global Neuromyelitis Optica Spectrum Disorder Therapeutics Market Revenue Breakdown (Million, %) by Region 2024 & 2032
- Figure 2: Global Neuromyelitis Optica Spectrum Disorder Therapeutics Market Volume Breakdown (K Unit, %) by Region 2024 & 2032
- Figure 3: North America Neuromyelitis Optica Spectrum Disorder Therapeutics Market Revenue (Million), by Country 2024 & 2032
- Figure 4: North America Neuromyelitis Optica Spectrum Disorder Therapeutics Market Volume (K Unit), by Country 2024 & 2032
- Figure 5: North America Neuromyelitis Optica Spectrum Disorder Therapeutics Market Revenue Share (%), by Country 2024 & 2032
- Figure 6: North America Neuromyelitis Optica Spectrum Disorder Therapeutics Market Volume Share (%), by Country 2024 & 2032
- Figure 7: Europe Neuromyelitis Optica Spectrum Disorder Therapeutics Market Revenue (Million), by Country 2024 & 2032
- Figure 8: Europe Neuromyelitis Optica Spectrum Disorder Therapeutics Market Volume (K Unit), by Country 2024 & 2032
- Figure 9: Europe Neuromyelitis Optica Spectrum Disorder Therapeutics Market Revenue Share (%), by Country 2024 & 2032
- Figure 10: Europe Neuromyelitis Optica Spectrum Disorder Therapeutics Market Volume Share (%), by Country 2024 & 2032
- Figure 11: Asia Pacific Neuromyelitis Optica Spectrum Disorder Therapeutics Market Revenue (Million), by Country 2024 & 2032
- Figure 12: Asia Pacific Neuromyelitis Optica Spectrum Disorder Therapeutics Market Volume (K Unit), by Country 2024 & 2032
- Figure 13: Asia Pacific Neuromyelitis Optica Spectrum Disorder Therapeutics Market Revenue Share (%), by Country 2024 & 2032
- Figure 14: Asia Pacific Neuromyelitis Optica Spectrum Disorder Therapeutics Market Volume Share (%), by Country 2024 & 2032
- Figure 15: South America Neuromyelitis Optica Spectrum Disorder Therapeutics Market Revenue (Million), by Country 2024 & 2032
- Figure 16: South America Neuromyelitis Optica Spectrum Disorder Therapeutics Market Volume (K Unit), by Country 2024 & 2032
- Figure 17: South America Neuromyelitis Optica Spectrum Disorder Therapeutics Market Revenue Share (%), by Country 2024 & 2032
- Figure 18: South America Neuromyelitis Optica Spectrum Disorder Therapeutics Market Volume Share (%), by Country 2024 & 2032
- Figure 19: North America Neuromyelitis Optica Spectrum Disorder Therapeutics Market Revenue (Million), by Country 2024 & 2032
- Figure 20: North America Neuromyelitis Optica Spectrum Disorder Therapeutics Market Volume (K Unit), by Country 2024 & 2032
- Figure 21: North America Neuromyelitis Optica Spectrum Disorder Therapeutics Market Revenue Share (%), by Country 2024 & 2032
- Figure 22: North America Neuromyelitis Optica Spectrum Disorder Therapeutics Market Volume Share (%), by Country 2024 & 2032
- Figure 23: MEA Neuromyelitis Optica Spectrum Disorder Therapeutics Market Revenue (Million), by Country 2024 & 2032
- Figure 24: MEA Neuromyelitis Optica Spectrum Disorder Therapeutics Market Volume (K Unit), by Country 2024 & 2032
- Figure 25: MEA Neuromyelitis Optica Spectrum Disorder Therapeutics Market Revenue Share (%), by Country 2024 & 2032
- Figure 26: MEA Neuromyelitis Optica Spectrum Disorder Therapeutics Market Volume Share (%), by Country 2024 & 2032
- Figure 27: North America Neuromyelitis Optica Spectrum Disorder Therapeutics Market Revenue (Million), by Treatment 2024 & 2032
- Figure 28: North America Neuromyelitis Optica Spectrum Disorder Therapeutics Market Volume (K Unit), by Treatment 2024 & 2032
- Figure 29: North America Neuromyelitis Optica Spectrum Disorder Therapeutics Market Revenue Share (%), by Treatment 2024 & 2032
- Figure 30: North America Neuromyelitis Optica Spectrum Disorder Therapeutics Market Volume Share (%), by Treatment 2024 & 2032
- Figure 31: North America Neuromyelitis Optica Spectrum Disorder Therapeutics Market Revenue (Million), by Country 2024 & 2032
- Figure 32: North America Neuromyelitis Optica Spectrum Disorder Therapeutics Market Volume (K Unit), by Country 2024 & 2032
- Figure 33: North America Neuromyelitis Optica Spectrum Disorder Therapeutics Market Revenue Share (%), by Country 2024 & 2032
- Figure 34: North America Neuromyelitis Optica Spectrum Disorder Therapeutics Market Volume Share (%), by Country 2024 & 2032
- Figure 35: Europe Neuromyelitis Optica Spectrum Disorder Therapeutics Market Revenue (Million), by Treatment 2024 & 2032
- Figure 36: Europe Neuromyelitis Optica Spectrum Disorder Therapeutics Market Volume (K Unit), by Treatment 2024 & 2032
- Figure 37: Europe Neuromyelitis Optica Spectrum Disorder Therapeutics Market Revenue Share (%), by Treatment 2024 & 2032
- Figure 38: Europe Neuromyelitis Optica Spectrum Disorder Therapeutics Market Volume Share (%), by Treatment 2024 & 2032
- Figure 39: Europe Neuromyelitis Optica Spectrum Disorder Therapeutics Market Revenue (Million), by Country 2024 & 2032
- Figure 40: Europe Neuromyelitis Optica Spectrum Disorder Therapeutics Market Volume (K Unit), by Country 2024 & 2032
- Figure 41: Europe Neuromyelitis Optica Spectrum Disorder Therapeutics Market Revenue Share (%), by Country 2024 & 2032
- Figure 42: Europe Neuromyelitis Optica Spectrum Disorder Therapeutics Market Volume Share (%), by Country 2024 & 2032
- Figure 43: Asia Pacific Neuromyelitis Optica Spectrum Disorder Therapeutics Market Revenue (Million), by Treatment 2024 & 2032
- Figure 44: Asia Pacific Neuromyelitis Optica Spectrum Disorder Therapeutics Market Volume (K Unit), by Treatment 2024 & 2032
- Figure 45: Asia Pacific Neuromyelitis Optica Spectrum Disorder Therapeutics Market Revenue Share (%), by Treatment 2024 & 2032
- Figure 46: Asia Pacific Neuromyelitis Optica Spectrum Disorder Therapeutics Market Volume Share (%), by Treatment 2024 & 2032
- Figure 47: Asia Pacific Neuromyelitis Optica Spectrum Disorder Therapeutics Market Revenue (Million), by Country 2024 & 2032
- Figure 48: Asia Pacific Neuromyelitis Optica Spectrum Disorder Therapeutics Market Volume (K Unit), by Country 2024 & 2032
- Figure 49: Asia Pacific Neuromyelitis Optica Spectrum Disorder Therapeutics Market Revenue Share (%), by Country 2024 & 2032
- Figure 50: Asia Pacific Neuromyelitis Optica Spectrum Disorder Therapeutics Market Volume Share (%), by Country 2024 & 2032
- Figure 51: Rest of the World Neuromyelitis Optica Spectrum Disorder Therapeutics Market Revenue (Million), by Treatment 2024 & 2032
- Figure 52: Rest of the World Neuromyelitis Optica Spectrum Disorder Therapeutics Market Volume (K Unit), by Treatment 2024 & 2032
- Figure 53: Rest of the World Neuromyelitis Optica Spectrum Disorder Therapeutics Market Revenue Share (%), by Treatment 2024 & 2032
- Figure 54: Rest of the World Neuromyelitis Optica Spectrum Disorder Therapeutics Market Volume Share (%), by Treatment 2024 & 2032
- Figure 55: Rest of the World Neuromyelitis Optica Spectrum Disorder Therapeutics Market Revenue (Million), by Country 2024 & 2032
- Figure 56: Rest of the World Neuromyelitis Optica Spectrum Disorder Therapeutics Market Volume (K Unit), by Country 2024 & 2032
- Figure 57: Rest of the World Neuromyelitis Optica Spectrum Disorder Therapeutics Market Revenue Share (%), by Country 2024 & 2032
- Figure 58: Rest of the World Neuromyelitis Optica Spectrum Disorder Therapeutics Market Volume Share (%), by Country 2024 & 2032
List of Tables
- Table 1: Global Neuromyelitis Optica Spectrum Disorder Therapeutics Market Revenue Million Forecast, by Region 2019 & 2032
- Table 2: Global Neuromyelitis Optica Spectrum Disorder Therapeutics Market Volume K Unit Forecast, by Region 2019 & 2032
- Table 3: Global Neuromyelitis Optica Spectrum Disorder Therapeutics Market Revenue Million Forecast, by Treatment 2019 & 2032
- Table 4: Global Neuromyelitis Optica Spectrum Disorder Therapeutics Market Volume K Unit Forecast, by Treatment 2019 & 2032
- Table 5: Global Neuromyelitis Optica Spectrum Disorder Therapeutics Market Revenue Million Forecast, by Region 2019 & 2032
- Table 6: Global Neuromyelitis Optica Spectrum Disorder Therapeutics Market Volume K Unit Forecast, by Region 2019 & 2032
- Table 7: Global Neuromyelitis Optica Spectrum Disorder Therapeutics Market Revenue Million Forecast, by Country 2019 & 2032
- Table 8: Global Neuromyelitis Optica Spectrum Disorder Therapeutics Market Volume K Unit Forecast, by Country 2019 & 2032
- Table 9: United States Neuromyelitis Optica Spectrum Disorder Therapeutics Market Revenue (Million) Forecast, by Application 2019 & 2032
- Table 10: United States Neuromyelitis Optica Spectrum Disorder Therapeutics Market Volume (K Unit) Forecast, by Application 2019 & 2032
- Table 11: Canada Neuromyelitis Optica Spectrum Disorder Therapeutics Market Revenue (Million) Forecast, by Application 2019 & 2032
- Table 12: Canada Neuromyelitis Optica Spectrum Disorder Therapeutics Market Volume (K Unit) Forecast, by Application 2019 & 2032
- Table 13: Mexico Neuromyelitis Optica Spectrum Disorder Therapeutics Market Revenue (Million) Forecast, by Application 2019 & 2032
- Table 14: Mexico Neuromyelitis Optica Spectrum Disorder Therapeutics Market Volume (K Unit) Forecast, by Application 2019 & 2032
- Table 15: Global Neuromyelitis Optica Spectrum Disorder Therapeutics Market Revenue Million Forecast, by Country 2019 & 2032
- Table 16: Global Neuromyelitis Optica Spectrum Disorder Therapeutics Market Volume K Unit Forecast, by Country 2019 & 2032
- Table 17: Germany Neuromyelitis Optica Spectrum Disorder Therapeutics Market Revenue (Million) Forecast, by Application 2019 & 2032
- Table 18: Germany Neuromyelitis Optica Spectrum Disorder Therapeutics Market Volume (K Unit) Forecast, by Application 2019 & 2032
- Table 19: United Kingdom Neuromyelitis Optica Spectrum Disorder Therapeutics Market Revenue (Million) Forecast, by Application 2019 & 2032
- Table 20: United Kingdom Neuromyelitis Optica Spectrum Disorder Therapeutics Market Volume (K Unit) Forecast, by Application 2019 & 2032
- Table 21: France Neuromyelitis Optica Spectrum Disorder Therapeutics Market Revenue (Million) Forecast, by Application 2019 & 2032
- Table 22: France Neuromyelitis Optica Spectrum Disorder Therapeutics Market Volume (K Unit) Forecast, by Application 2019 & 2032
- Table 23: Spain Neuromyelitis Optica Spectrum Disorder Therapeutics Market Revenue (Million) Forecast, by Application 2019 & 2032
- Table 24: Spain Neuromyelitis Optica Spectrum Disorder Therapeutics Market Volume (K Unit) Forecast, by Application 2019 & 2032
- Table 25: Italy Neuromyelitis Optica Spectrum Disorder Therapeutics Market Revenue (Million) Forecast, by Application 2019 & 2032
- Table 26: Italy Neuromyelitis Optica Spectrum Disorder Therapeutics Market Volume (K Unit) Forecast, by Application 2019 & 2032
- Table 27: Spain Neuromyelitis Optica Spectrum Disorder Therapeutics Market Revenue (Million) Forecast, by Application 2019 & 2032
- Table 28: Spain Neuromyelitis Optica Spectrum Disorder Therapeutics Market Volume (K Unit) Forecast, by Application 2019 & 2032
- Table 29: Belgium Neuromyelitis Optica Spectrum Disorder Therapeutics Market Revenue (Million) Forecast, by Application 2019 & 2032
- Table 30: Belgium Neuromyelitis Optica Spectrum Disorder Therapeutics Market Volume (K Unit) Forecast, by Application 2019 & 2032
- Table 31: Netherland Neuromyelitis Optica Spectrum Disorder Therapeutics Market Revenue (Million) Forecast, by Application 2019 & 2032
- Table 32: Netherland Neuromyelitis Optica Spectrum Disorder Therapeutics Market Volume (K Unit) Forecast, by Application 2019 & 2032
- Table 33: Nordics Neuromyelitis Optica Spectrum Disorder Therapeutics Market Revenue (Million) Forecast, by Application 2019 & 2032
- Table 34: Nordics Neuromyelitis Optica Spectrum Disorder Therapeutics Market Volume (K Unit) Forecast, by Application 2019 & 2032
- Table 35: Rest of Europe Neuromyelitis Optica Spectrum Disorder Therapeutics Market Revenue (Million) Forecast, by Application 2019 & 2032
- Table 36: Rest of Europe Neuromyelitis Optica Spectrum Disorder Therapeutics Market Volume (K Unit) Forecast, by Application 2019 & 2032
- Table 37: Global Neuromyelitis Optica Spectrum Disorder Therapeutics Market Revenue Million Forecast, by Country 2019 & 2032
- Table 38: Global Neuromyelitis Optica Spectrum Disorder Therapeutics Market Volume K Unit Forecast, by Country 2019 & 2032
- Table 39: China Neuromyelitis Optica Spectrum Disorder Therapeutics Market Revenue (Million) Forecast, by Application 2019 & 2032
- Table 40: China Neuromyelitis Optica Spectrum Disorder Therapeutics Market Volume (K Unit) Forecast, by Application 2019 & 2032
- Table 41: Japan Neuromyelitis Optica Spectrum Disorder Therapeutics Market Revenue (Million) Forecast, by Application 2019 & 2032
- Table 42: Japan Neuromyelitis Optica Spectrum Disorder Therapeutics Market Volume (K Unit) Forecast, by Application 2019 & 2032
- Table 43: India Neuromyelitis Optica Spectrum Disorder Therapeutics Market Revenue (Million) Forecast, by Application 2019 & 2032
- Table 44: India Neuromyelitis Optica Spectrum Disorder Therapeutics Market Volume (K Unit) Forecast, by Application 2019 & 2032
- Table 45: South Korea Neuromyelitis Optica Spectrum Disorder Therapeutics Market Revenue (Million) Forecast, by Application 2019 & 2032
- Table 46: South Korea Neuromyelitis Optica Spectrum Disorder Therapeutics Market Volume (K Unit) Forecast, by Application 2019 & 2032
- Table 47: Southeast Asia Neuromyelitis Optica Spectrum Disorder Therapeutics Market Revenue (Million) Forecast, by Application 2019 & 2032
- Table 48: Southeast Asia Neuromyelitis Optica Spectrum Disorder Therapeutics Market Volume (K Unit) Forecast, by Application 2019 & 2032
- Table 49: Australia Neuromyelitis Optica Spectrum Disorder Therapeutics Market Revenue (Million) Forecast, by Application 2019 & 2032
- Table 50: Australia Neuromyelitis Optica Spectrum Disorder Therapeutics Market Volume (K Unit) Forecast, by Application 2019 & 2032
- Table 51: Indonesia Neuromyelitis Optica Spectrum Disorder Therapeutics Market Revenue (Million) Forecast, by Application 2019 & 2032
- Table 52: Indonesia Neuromyelitis Optica Spectrum Disorder Therapeutics Market Volume (K Unit) Forecast, by Application 2019 & 2032
- Table 53: Phillipes Neuromyelitis Optica Spectrum Disorder Therapeutics Market Revenue (Million) Forecast, by Application 2019 & 2032
- Table 54: Phillipes Neuromyelitis Optica Spectrum Disorder Therapeutics Market Volume (K Unit) Forecast, by Application 2019 & 2032
- Table 55: Singapore Neuromyelitis Optica Spectrum Disorder Therapeutics Market Revenue (Million) Forecast, by Application 2019 & 2032
- Table 56: Singapore Neuromyelitis Optica Spectrum Disorder Therapeutics Market Volume (K Unit) Forecast, by Application 2019 & 2032
- Table 57: Thailandc Neuromyelitis Optica Spectrum Disorder Therapeutics Market Revenue (Million) Forecast, by Application 2019 & 2032
- Table 58: Thailandc Neuromyelitis Optica Spectrum Disorder Therapeutics Market Volume (K Unit) Forecast, by Application 2019 & 2032
- Table 59: Rest of Asia Pacific Neuromyelitis Optica Spectrum Disorder Therapeutics Market Revenue (Million) Forecast, by Application 2019 & 2032
- Table 60: Rest of Asia Pacific Neuromyelitis Optica Spectrum Disorder Therapeutics Market Volume (K Unit) Forecast, by Application 2019 & 2032
- Table 61: Global Neuromyelitis Optica Spectrum Disorder Therapeutics Market Revenue Million Forecast, by Country 2019 & 2032
- Table 62: Global Neuromyelitis Optica Spectrum Disorder Therapeutics Market Volume K Unit Forecast, by Country 2019 & 2032
- Table 63: Brazil Neuromyelitis Optica Spectrum Disorder Therapeutics Market Revenue (Million) Forecast, by Application 2019 & 2032
- Table 64: Brazil Neuromyelitis Optica Spectrum Disorder Therapeutics Market Volume (K Unit) Forecast, by Application 2019 & 2032
- Table 65: Argentina Neuromyelitis Optica Spectrum Disorder Therapeutics Market Revenue (Million) Forecast, by Application 2019 & 2032
- Table 66: Argentina Neuromyelitis Optica Spectrum Disorder Therapeutics Market Volume (K Unit) Forecast, by Application 2019 & 2032
- Table 67: Peru Neuromyelitis Optica Spectrum Disorder Therapeutics Market Revenue (Million) Forecast, by Application 2019 & 2032
- Table 68: Peru Neuromyelitis Optica Spectrum Disorder Therapeutics Market Volume (K Unit) Forecast, by Application 2019 & 2032
- Table 69: Chile Neuromyelitis Optica Spectrum Disorder Therapeutics Market Revenue (Million) Forecast, by Application 2019 & 2032
- Table 70: Chile Neuromyelitis Optica Spectrum Disorder Therapeutics Market Volume (K Unit) Forecast, by Application 2019 & 2032
- Table 71: Colombia Neuromyelitis Optica Spectrum Disorder Therapeutics Market Revenue (Million) Forecast, by Application 2019 & 2032
- Table 72: Colombia Neuromyelitis Optica Spectrum Disorder Therapeutics Market Volume (K Unit) Forecast, by Application 2019 & 2032
- Table 73: Ecuador Neuromyelitis Optica Spectrum Disorder Therapeutics Market Revenue (Million) Forecast, by Application 2019 & 2032
- Table 74: Ecuador Neuromyelitis Optica Spectrum Disorder Therapeutics Market Volume (K Unit) Forecast, by Application 2019 & 2032
- Table 75: Venezuela Neuromyelitis Optica Spectrum Disorder Therapeutics Market Revenue (Million) Forecast, by Application 2019 & 2032
- Table 76: Venezuela Neuromyelitis Optica Spectrum Disorder Therapeutics Market Volume (K Unit) Forecast, by Application 2019 & 2032
- Table 77: Rest of South America Neuromyelitis Optica Spectrum Disorder Therapeutics Market Revenue (Million) Forecast, by Application 2019 & 2032
- Table 78: Rest of South America Neuromyelitis Optica Spectrum Disorder Therapeutics Market Volume (K Unit) Forecast, by Application 2019 & 2032
- Table 79: Global Neuromyelitis Optica Spectrum Disorder Therapeutics Market Revenue Million Forecast, by Country 2019 & 2032
- Table 80: Global Neuromyelitis Optica Spectrum Disorder Therapeutics Market Volume K Unit Forecast, by Country 2019 & 2032
- Table 81: United States Neuromyelitis Optica Spectrum Disorder Therapeutics Market Revenue (Million) Forecast, by Application 2019 & 2032
- Table 82: United States Neuromyelitis Optica Spectrum Disorder Therapeutics Market Volume (K Unit) Forecast, by Application 2019 & 2032
- Table 83: Canada Neuromyelitis Optica Spectrum Disorder Therapeutics Market Revenue (Million) Forecast, by Application 2019 & 2032
- Table 84: Canada Neuromyelitis Optica Spectrum Disorder Therapeutics Market Volume (K Unit) Forecast, by Application 2019 & 2032
- Table 85: Mexico Neuromyelitis Optica Spectrum Disorder Therapeutics Market Revenue (Million) Forecast, by Application 2019 & 2032
- Table 86: Mexico Neuromyelitis Optica Spectrum Disorder Therapeutics Market Volume (K Unit) Forecast, by Application 2019 & 2032
- Table 87: Global Neuromyelitis Optica Spectrum Disorder Therapeutics Market Revenue Million Forecast, by Country 2019 & 2032
- Table 88: Global Neuromyelitis Optica Spectrum Disorder Therapeutics Market Volume K Unit Forecast, by Country 2019 & 2032
- Table 89: United Arab Emirates Neuromyelitis Optica Spectrum Disorder Therapeutics Market Revenue (Million) Forecast, by Application 2019 & 2032
- Table 90: United Arab Emirates Neuromyelitis Optica Spectrum Disorder Therapeutics Market Volume (K Unit) Forecast, by Application 2019 & 2032
- Table 91: Saudi Arabia Neuromyelitis Optica Spectrum Disorder Therapeutics Market Revenue (Million) Forecast, by Application 2019 & 2032
- Table 92: Saudi Arabia Neuromyelitis Optica Spectrum Disorder Therapeutics Market Volume (K Unit) Forecast, by Application 2019 & 2032
- Table 93: South Africa Neuromyelitis Optica Spectrum Disorder Therapeutics Market Revenue (Million) Forecast, by Application 2019 & 2032
- Table 94: South Africa Neuromyelitis Optica Spectrum Disorder Therapeutics Market Volume (K Unit) Forecast, by Application 2019 & 2032
- Table 95: Rest of Middle East and Africa Neuromyelitis Optica Spectrum Disorder Therapeutics Market Revenue (Million) Forecast, by Application 2019 & 2032
- Table 96: Rest of Middle East and Africa Neuromyelitis Optica Spectrum Disorder Therapeutics Market Volume (K Unit) Forecast, by Application 2019 & 2032
- Table 97: Global Neuromyelitis Optica Spectrum Disorder Therapeutics Market Revenue Million Forecast, by Treatment 2019 & 2032
- Table 98: Global Neuromyelitis Optica Spectrum Disorder Therapeutics Market Volume K Unit Forecast, by Treatment 2019 & 2032
- Table 99: Global Neuromyelitis Optica Spectrum Disorder Therapeutics Market Revenue Million Forecast, by Country 2019 & 2032
- Table 100: Global Neuromyelitis Optica Spectrum Disorder Therapeutics Market Volume K Unit Forecast, by Country 2019 & 2032
- Table 101: United States Neuromyelitis Optica Spectrum Disorder Therapeutics Market Revenue (Million) Forecast, by Application 2019 & 2032
- Table 102: United States Neuromyelitis Optica Spectrum Disorder Therapeutics Market Volume (K Unit) Forecast, by Application 2019 & 2032
- Table 103: Canada Neuromyelitis Optica Spectrum Disorder Therapeutics Market Revenue (Million) Forecast, by Application 2019 & 2032
- Table 104: Canada Neuromyelitis Optica Spectrum Disorder Therapeutics Market Volume (K Unit) Forecast, by Application 2019 & 2032
- Table 105: Mexico Neuromyelitis Optica Spectrum Disorder Therapeutics Market Revenue (Million) Forecast, by Application 2019 & 2032
- Table 106: Mexico Neuromyelitis Optica Spectrum Disorder Therapeutics Market Volume (K Unit) Forecast, by Application 2019 & 2032
- Table 107: Global Neuromyelitis Optica Spectrum Disorder Therapeutics Market Revenue Million Forecast, by Treatment 2019 & 2032
- Table 108: Global Neuromyelitis Optica Spectrum Disorder Therapeutics Market Volume K Unit Forecast, by Treatment 2019 & 2032
- Table 109: Global Neuromyelitis Optica Spectrum Disorder Therapeutics Market Revenue Million Forecast, by Country 2019 & 2032
- Table 110: Global Neuromyelitis Optica Spectrum Disorder Therapeutics Market Volume K Unit Forecast, by Country 2019 & 2032
- Table 111: Germany Neuromyelitis Optica Spectrum Disorder Therapeutics Market Revenue (Million) Forecast, by Application 2019 & 2032
- Table 112: Germany Neuromyelitis Optica Spectrum Disorder Therapeutics Market Volume (K Unit) Forecast, by Application 2019 & 2032
- Table 113: United Kingdom Neuromyelitis Optica Spectrum Disorder Therapeutics Market Revenue (Million) Forecast, by Application 2019 & 2032
- Table 114: United Kingdom Neuromyelitis Optica Spectrum Disorder Therapeutics Market Volume (K Unit) Forecast, by Application 2019 & 2032
- Table 115: France Neuromyelitis Optica Spectrum Disorder Therapeutics Market Revenue (Million) Forecast, by Application 2019 & 2032
- Table 116: France Neuromyelitis Optica Spectrum Disorder Therapeutics Market Volume (K Unit) Forecast, by Application 2019 & 2032
- Table 117: Italy Neuromyelitis Optica Spectrum Disorder Therapeutics Market Revenue (Million) Forecast, by Application 2019 & 2032
- Table 118: Italy Neuromyelitis Optica Spectrum Disorder Therapeutics Market Volume (K Unit) Forecast, by Application 2019 & 2032
- Table 119: Spain Neuromyelitis Optica Spectrum Disorder Therapeutics Market Revenue (Million) Forecast, by Application 2019 & 2032
- Table 120: Spain Neuromyelitis Optica Spectrum Disorder Therapeutics Market Volume (K Unit) Forecast, by Application 2019 & 2032
- Table 121: Rest of Europe Neuromyelitis Optica Spectrum Disorder Therapeutics Market Revenue (Million) Forecast, by Application 2019 & 2032
- Table 122: Rest of Europe Neuromyelitis Optica Spectrum Disorder Therapeutics Market Volume (K Unit) Forecast, by Application 2019 & 2032
- Table 123: Global Neuromyelitis Optica Spectrum Disorder Therapeutics Market Revenue Million Forecast, by Treatment 2019 & 2032
- Table 124: Global Neuromyelitis Optica Spectrum Disorder Therapeutics Market Volume K Unit Forecast, by Treatment 2019 & 2032
- Table 125: Global Neuromyelitis Optica Spectrum Disorder Therapeutics Market Revenue Million Forecast, by Country 2019 & 2032
- Table 126: Global Neuromyelitis Optica Spectrum Disorder Therapeutics Market Volume K Unit Forecast, by Country 2019 & 2032
- Table 127: China Neuromyelitis Optica Spectrum Disorder Therapeutics Market Revenue (Million) Forecast, by Application 2019 & 2032
- Table 128: China Neuromyelitis Optica Spectrum Disorder Therapeutics Market Volume (K Unit) Forecast, by Application 2019 & 2032
- Table 129: Japan Neuromyelitis Optica Spectrum Disorder Therapeutics Market Revenue (Million) Forecast, by Application 2019 & 2032
- Table 130: Japan Neuromyelitis Optica Spectrum Disorder Therapeutics Market Volume (K Unit) Forecast, by Application 2019 & 2032
- Table 131: India Neuromyelitis Optica Spectrum Disorder Therapeutics Market Revenue (Million) Forecast, by Application 2019 & 2032
- Table 132: India Neuromyelitis Optica Spectrum Disorder Therapeutics Market Volume (K Unit) Forecast, by Application 2019 & 2032
- Table 133: Australia Neuromyelitis Optica Spectrum Disorder Therapeutics Market Revenue (Million) Forecast, by Application 2019 & 2032
- Table 134: Australia Neuromyelitis Optica Spectrum Disorder Therapeutics Market Volume (K Unit) Forecast, by Application 2019 & 2032
- Table 135: South Korea Neuromyelitis Optica Spectrum Disorder Therapeutics Market Revenue (Million) Forecast, by Application 2019 & 2032
- Table 136: South Korea Neuromyelitis Optica Spectrum Disorder Therapeutics Market Volume (K Unit) Forecast, by Application 2019 & 2032
- Table 137: Rest of Asia Pacific Neuromyelitis Optica Spectrum Disorder Therapeutics Market Revenue (Million) Forecast, by Application 2019 & 2032
- Table 138: Rest of Asia Pacific Neuromyelitis Optica Spectrum Disorder Therapeutics Market Volume (K Unit) Forecast, by Application 2019 & 2032
- Table 139: Global Neuromyelitis Optica Spectrum Disorder Therapeutics Market Revenue Million Forecast, by Treatment 2019 & 2032
- Table 140: Global Neuromyelitis Optica Spectrum Disorder Therapeutics Market Volume K Unit Forecast, by Treatment 2019 & 2032
- Table 141: Global Neuromyelitis Optica Spectrum Disorder Therapeutics Market Revenue Million Forecast, by Country 2019 & 2032
- Table 142: Global Neuromyelitis Optica Spectrum Disorder Therapeutics Market Volume K Unit Forecast, by Country 2019 & 2032
Frequently Asked Questions
1. What is the projected Compound Annual Growth Rate (CAGR) of the Neuromyelitis Optica Spectrum Disorder Therapeutics Market?
The projected CAGR is approximately 6.20%.
2. Which companies are prominent players in the Neuromyelitis Optica Spectrum Disorder Therapeutics Market?
Key companies in the market include TG Therapeutics, Horizon Therapeutics plc (Viela Bio), RemeGen, AstraZeneca, Teva Pharmaceutical Industries Ltd, Harbour BioMed, Opexa Therapeutics, Mitsubishi Tanabe Pharma, Hoffmann-La Roche Ltd, Horizon Therapeutics plc.
3. What are the main segments of the Neuromyelitis Optica Spectrum Disorder Therapeutics Market?
The market segments include Treatment.
4. Can you provide details about the market size?
The market size is estimated to be USD XX Million as of 2022.
5. What are some drivers contributing to market growth?
Increasing Incidence of Neuromyelitis Optica Spectrum Disorder; Increasing Research and Development Activities. Product Approvals and Rising Demand for Better Treatment Options.
6. What are the notable trends driving market growth?
Monoclonal Antibody Drugs Segment Expects to Register a High CAGR in the Forecast Period.
7. Are there any restraints impacting market growth?
High Cost of Therapy for Neuromyelitis Optica Spectrum Disorder.
8. Can you provide examples of recent developments in the market?
N/A
9. What pricing options are available for accessing the report?
Pricing options include single-user, multi-user, and enterprise licenses priced at USD 4750, USD 5250, and USD 8750 respectively.
10. Is the market size provided in terms of value or volume?
The market size is provided in terms of value, measured in Million and volume, measured in K Unit.
11. Are there any specific market keywords associated with the report?
Yes, the market keyword associated with the report is "Neuromyelitis Optica Spectrum Disorder Therapeutics Market," which aids in identifying and referencing the specific market segment covered.
12. How do I determine which pricing option suits my needs best?
The pricing options vary based on user requirements and access needs. Individual users may opt for single-user licenses, while businesses requiring broader access may choose multi-user or enterprise licenses for cost-effective access to the report.
13. Are there any additional resources or data provided in the Neuromyelitis Optica Spectrum Disorder Therapeutics Market report?
While the report offers comprehensive insights, it's advisable to review the specific contents or supplementary materials provided to ascertain if additional resources or data are available.
14. How can I stay updated on further developments or reports in the Neuromyelitis Optica Spectrum Disorder Therapeutics Market?
To stay informed about further developments, trends, and reports in the Neuromyelitis Optica Spectrum Disorder Therapeutics Market, consider subscribing to industry newsletters, following relevant companies and organizations, or regularly checking reputable industry news sources and publications.
Methodology
Step 1 - Identification of Relevant Samples Size from Population Database


Step 2 - Approaches for Defining Global Market Size (Value, Volume* & Price*)

Note*: In applicable scenarios
Step 3 - Data Sources
Primary Research
- Web Analytics
- Survey Reports
- Research Institute
- Latest Research Reports
- Opinion Leaders
Secondary Research
- Annual Reports
- White Paper
- Latest Press Release
- Industry Association
- Paid Database
- Investor Presentations

Step 4 - Data Triangulation
Involves using different sources of information in order to increase the validity of a study
These sources are likely to be stakeholders in a program - participants, other researchers, program staff, other community members, and so on.
Then we put all data in single framework & apply various statistical tools to find out the dynamic on the market.
During the analysis stage, feedback from the stakeholder groups would be compared to determine areas of agreement as well as areas of divergence
