

Key Insights
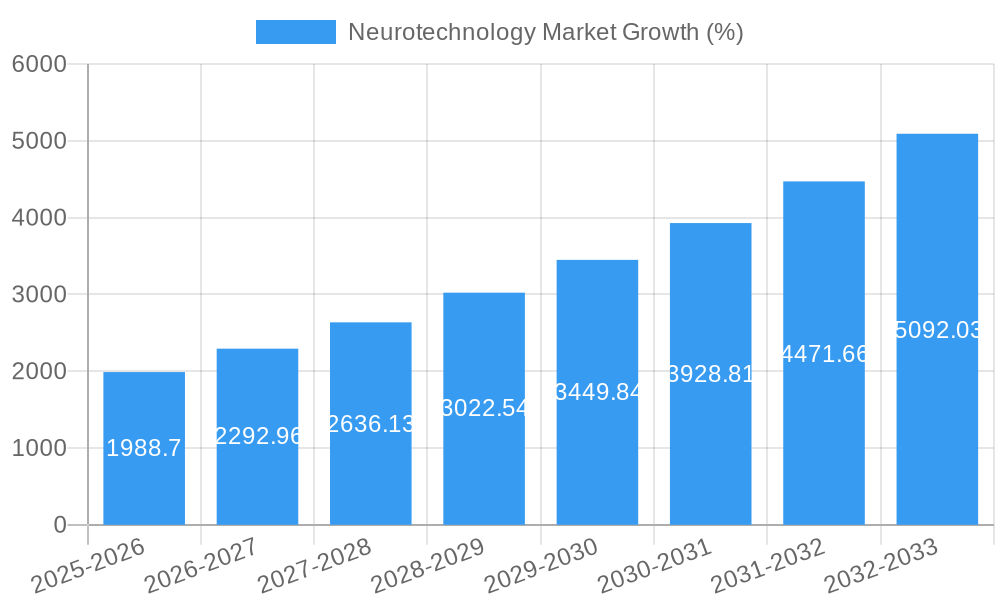
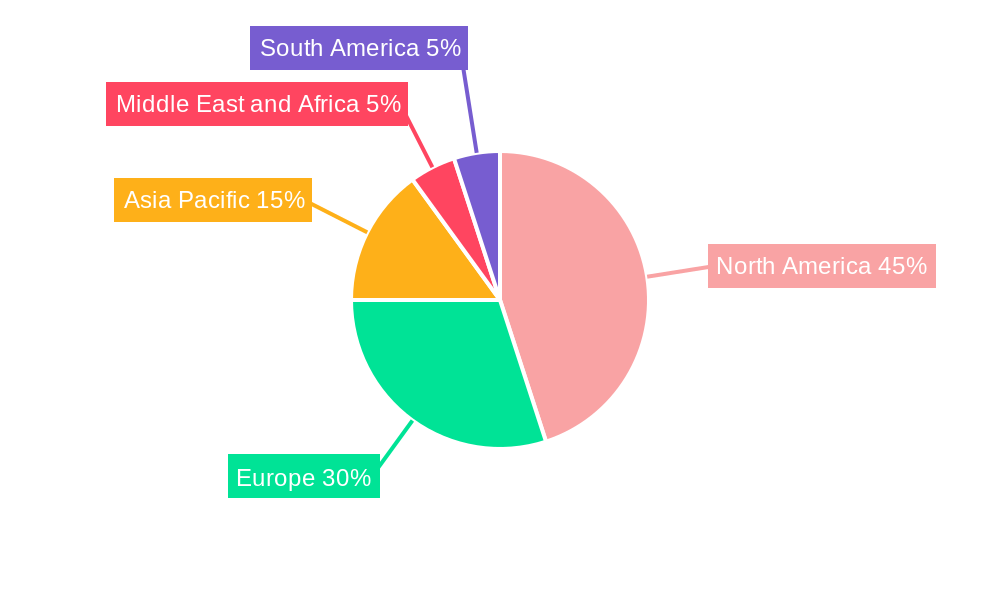
The neurotechnology market, valued at $15.18 billion in 2025, is projected to experience robust growth, exhibiting a compound annual growth rate (CAGR) of 13.50% from 2025 to 2033. This expansion is fueled by several key factors. Increasing prevalence of neurodegenerative diseases like Alzheimer's and Parkinson's, coupled with a growing aging population globally, is driving significant demand for effective diagnostic and therapeutic solutions. Advancements in brain-computer interfaces (BCIs), neurostimulation devices, and neuroprosthetics are continuously improving treatment options, further stimulating market growth. Furthermore, rising research and development investments in neurotechnology, along with increased government funding for initiatives focusing on neurological disorders, are contributing to market expansion. The segments within this market are diverse, with hospitals and clinics representing the largest end-user segment, followed by research institutions. Neurodegenerative disorders currently dominate applications, however, the market is poised for expansion into other areas, such as neuropsychiatric disorders and chronic pain management. Competitive landscape analysis indicates strong presence of established players like Medtronic, Abbott Laboratories, and Boston Scientific, alongside emerging companies actively innovating in this rapidly evolving field. North America currently holds a significant market share due to high healthcare expenditure and advanced technological infrastructure. However, Asia Pacific is anticipated to witness substantial growth driven by a rising middle class and increasing healthcare awareness.
While substantial growth is predicted, the market faces certain restraints. The high cost of neurotechnology devices and procedures remains a significant barrier to access, especially in developing countries. Stringent regulatory approvals for new devices can also impede market entry and timely product launches. However, ongoing technological advancements, coupled with increasing private and public investments focused on lowering costs and simplifying procedures, are expected to mitigate these challenges over the forecast period. The continuous development of minimally invasive procedures, along with the expansion of telemedicine, will likely contribute significantly to accessibility and market penetration. This convergence of technological advancement, escalating disease prevalence, and targeted investment promises a future where neurotechnology offers increasingly sophisticated and accessible solutions for a wide range of neurological conditions.
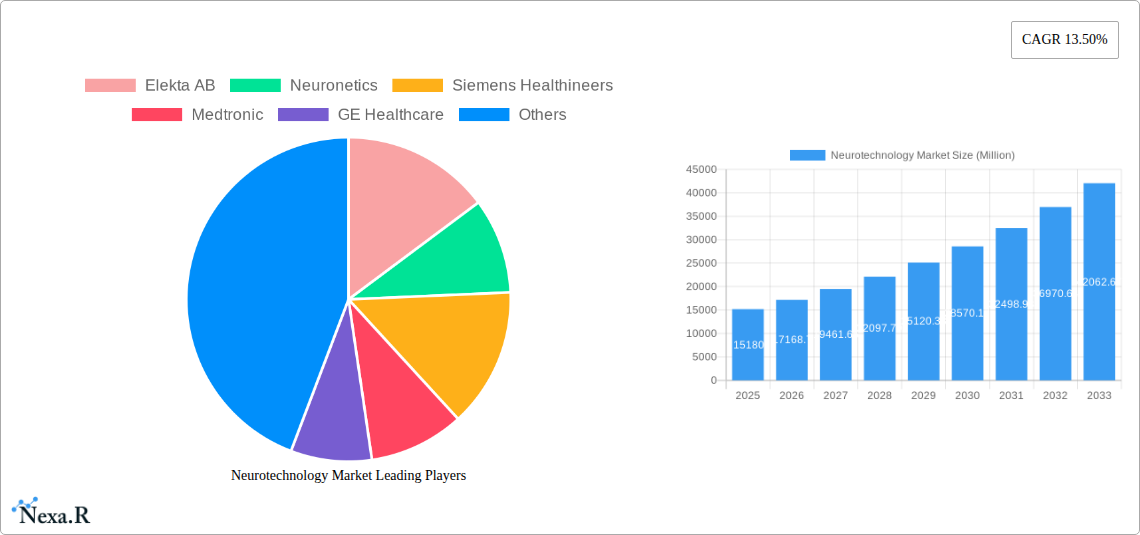
Neurotechnology Market Report: 2019-2033
This comprehensive report provides a detailed analysis of the Neurotechnology Market, encompassing market dynamics, growth trends, regional segmentation, product landscape, key players, and future outlook. The study period covers 2019-2033, with 2025 as the base and estimated year. This report is invaluable for industry professionals, investors, and researchers seeking a deep understanding of this rapidly evolving field. The market is segmented by end-user (Hospitals and Clinics, Research Institutes and Academic Centers, Other End Users), product type (Neuroprosthetics, Neurostimulation Devices, Brain-Computer Interfaces, Other Products), and application (Neurodegenerative Disorders, Neuropsychiatric Disorders, Chronic Pain Management, Other Applications). Key players analyzed include Elekta AB, Neuronetics, Siemens Healthineers, Medtronic, GE Healthcare, Abbott Laboratories, Koninklijke Philips N.V., Boston Scientific, LivaNova PLC, and NeuroPace. The total market size is projected to reach xx Million by 2033.
Neurotechnology Market Dynamics & Structure
The neurotechnology market is characterized by a moderately concentrated landscape, with a few major players holding significant market share. However, the entry of innovative startups and the increasing focus on technological advancements are fostering a more competitive environment. Technological innovation, particularly in areas like brain-computer interfaces (BCI) and advanced neurostimulation techniques, is a key driver of market growth. Regulatory frameworks, including FDA approvals and international standards, play a crucial role in shaping market access and product development. Competitive product substitutes, such as pharmacological treatments, also influence market dynamics. The end-user demographic is expanding, driven by the rising prevalence of neurological and psychiatric disorders. Mergers and acquisitions (M&A) activity is relatively high, reflecting the strategic importance of neurotechnology and the consolidation of the market.
- Market Concentration: Moderately concentrated, with top 5 players holding approximately xx% market share in 2025.
- Technological Innovation: Rapid advancements in BCI, AI-driven diagnostics, and minimally invasive surgical techniques are driving market growth.
- Regulatory Landscape: Stringent regulatory pathways influence product development timelines and market entry.
- M&A Activity: Significant M&A activity observed in the historical period (2019-2024) with xx deals recorded, valued at approximately xx Million.
- Innovation Barriers: High R&D costs, complex clinical trials, and stringent regulatory requirements pose challenges for innovation.
Neurotechnology Market Growth Trends & Insights
The neurotechnology market has experienced substantial growth in recent years, driven by factors such as the rising prevalence of neurological disorders, technological advancements, and increased healthcare spending. The market size is estimated to be xx Million in 2025, exhibiting a Compound Annual Growth Rate (CAGR) of xx% during the forecast period (2025-2033). Market penetration is increasing steadily, with neurostimulation devices showing particularly strong adoption rates. Technological disruptions, such as the development of advanced BCIs and AI-powered diagnostic tools, are reshaping the market landscape, and consumer behavior is shifting toward minimally invasive and personalized treatment options. The increasing demand for effective treatments for conditions like Parkinson's disease, Alzheimer's disease, and epilepsy is further propelling market expansion.
Dominant Regions, Countries, or Segments in Neurotechnology Market
North America currently dominates the neurotechnology market, driven by high healthcare expenditure, robust regulatory frameworks, and a significant concentration of research and development activities. Within North America, the United States holds the largest market share. Europe and Asia Pacific regions are witnessing significant growth, driven by rising prevalence of neurological disorders and increasing investments in healthcare infrastructure.
- Leading Segment: Neurostimulation Devices holds the largest market share, driven by the high prevalence of chronic pain and neurological disorders.
- High-Growth Region: Asia Pacific displays high growth potential due to rising healthcare expenditure and expanding healthcare infrastructure.
- Key Drivers: Increased government funding for research, rising awareness of neurological disorders, and the adoption of advanced technologies in healthcare settings.
- Dominance Factors: High healthcare expenditure, established healthcare infrastructure, and significant R&D activities in North America contribute to its market dominance.
Neurotechnology Market Product Landscape
The neurotechnology market offers a diverse range of products, including neuroprosthetics for restoring lost motor functions, neurostimulation devices for treating chronic pain and neurological disorders, and brain-computer interfaces for enabling communication and control in individuals with disabilities. Recent innovations focus on improving device efficacy, minimizing invasiveness, and enhancing patient comfort. Unique selling propositions (USPs) include improved precision, miniaturization, and wireless capabilities. Technological advancements in materials science, biocompatibility, and signal processing are shaping the next generation of neurotechnology products.
Key Drivers, Barriers & Challenges in Neurotechnology Market
Key Drivers: Rising prevalence of neurological disorders, technological advancements, increased healthcare spending, and supportive government initiatives are propelling market growth. The development of less invasive neurostimulation techniques, AI-powered diagnostic tools, and advanced BCI technology contribute significantly.
Key Challenges: High R&D costs, stringent regulatory hurdles, complex clinical trials, and the ethical considerations surrounding BCIs pose significant challenges. Supply chain disruptions can also impact market growth. Competition from established pharmaceutical companies offering alternative treatments also presents a significant barrier.
Emerging Opportunities in Neurotechnology Market
Emerging opportunities include the development of personalized therapies, advancements in closed-loop neurostimulation systems, integration of AI and machine learning in neurotechnology applications, and the exploration of novel treatment modalities for neuropsychiatric disorders. Untapped markets in developing countries also present a significant growth potential. The increasing interest in home-based neurorehabilitation and the development of portable and user-friendly devices are opening new avenues for market expansion.
Growth Accelerators in the Neurotechnology Market Industry
Technological breakthroughs in materials science, miniaturization, and wireless communication are significantly accelerating market growth. Strategic partnerships between technology companies and healthcare providers foster innovation and market penetration. Market expansion strategies targeting untapped markets and unmet clinical needs contribute to long-term growth.
Key Players Shaping the Neurotechnology Market Market
- Elekta AB
- Neuronetics
- Siemens Healthineers
- Medtronic
- GE Healthcare
- Abbott Laboratories
- Koninklijke Philips N.V.
- Boston Scientific
- LivaNova PLC
- NeuroPace
Notable Milestones in Neurotechnology Market Sector
- May 2023: Cognixion receives FDA breakthrough device designation for its Cognixion ONE Axon brain-computer interface.
- March 2024: SetPoint Medical receives FDA breakthrough device designation for its neuroimmune modulation platform for RRMS.
In-Depth Neurotechnology Market Market Outlook
The neurotechnology market is poised for continued strong growth, driven by ongoing technological advancements, increasing prevalence of neurological disorders, and expanding healthcare infrastructure globally. Strategic opportunities exist in developing personalized therapies, expanding into emerging markets, and fostering collaborations across industry sectors. The integration of artificial intelligence and machine learning will further revolutionize diagnostics and treatment modalities, creating significant long-term market potential.
Neurotechnology Market Segmentation
-
1. Product Type
- 1.1. Neuroprosthetics
- 1.2. Neurostimulation Devices
- 1.3. Brain-Computer Interfaces
- 1.4. Other Products
-
2. Application
- 2.1. Neurodegenerative Disorders
- 2.2. Neuropsychiatric Disorders
- 2.3. Chronic Pain Management
- 2.4. Other Applications
-
3. End User
- 3.1. Hospitals and Clinics
- 3.2. Research Institutes and Academic Centers
- 3.3. Other End Users
Neurotechnology Market Segmentation By Geography
-
1. North America
- 1.1. United States
- 1.2. Canada
- 1.3. Mexico
-
2. Europe
- 2.1. Germany
- 2.2. United Kingdom
- 2.3. France
- 2.4. Italy
- 2.5. Spain
- 2.6. Rest of Europe
-
3. Asia Pacific
- 3.1. China
- 3.2. Japan
- 3.3. India
- 3.4. Australia
- 3.5. South Korea
- 3.6. Rest of Asia Pacific
-
4. Middle East and Africa
- 4.1. GCC
- 4.2. South Africa
- 4.3. Rest of Middle East and Africa
-
5. South America
- 5.1. Brazil
- 5.2. Argentina
- 5.3. Rest of South America
Neurotechnology Market REPORT HIGHLIGHTS
| Aspects | Details |
|---|---|
| Study Period | 2019-2033 |
| Base Year | 2024 |
| Estimated Year | 2025 |
| Forecast Period | 2025-2033 |
| Historical Period | 2019-2024 |
| Growth Rate | CAGR of 13.50% from 2019-2033 |
| Segmentation |
|
Table of Contents
- 1. Introduction
- 1.1. Research Scope
- 1.2. Market Segmentation
- 1.3. Research Methodology
- 1.4. Definitions and Assumptions
- 2. Executive Summary
- 2.1. Introduction
- 3. Market Dynamics
- 3.1. Introduction
- 3.2. Market Drivers
- 3.2.1. Rising Prevalence of Neurological Disorders; Surging Advancements in Neuroscience and Technology; Growing Demand for Improved Treatment Options
- 3.3. Market Restrains
- 3.3.1. High Cost of Neurotechnology Devices; Stringent Regulatory Framework
- 3.4. Market Trends
- 3.4.1. Neurostimulation Devices Segment is Expected to Witness Significant Growth during the Forecast Period
- 4. Market Factor Analysis
- 4.1. Porters Five Forces
- 4.2. Supply/Value Chain
- 4.3. PESTEL analysis
- 4.4. Market Entropy
- 4.5. Patent/Trademark Analysis
- 5. Global Neurotechnology Market Analysis, Insights and Forecast, 2019-2031
- 5.1. Market Analysis, Insights and Forecast - by Product Type
- 5.1.1. Neuroprosthetics
- 5.1.2. Neurostimulation Devices
- 5.1.3. Brain-Computer Interfaces
- 5.1.4. Other Products
- 5.2. Market Analysis, Insights and Forecast - by Application
- 5.2.1. Neurodegenerative Disorders
- 5.2.2. Neuropsychiatric Disorders
- 5.2.3. Chronic Pain Management
- 5.2.4. Other Applications
- 5.3. Market Analysis, Insights and Forecast - by End User
- 5.3.1. Hospitals and Clinics
- 5.3.2. Research Institutes and Academic Centers
- 5.3.3. Other End Users
- 5.4. Market Analysis, Insights and Forecast - by Region
- 5.4.1. North America
- 5.4.2. Europe
- 5.4.3. Asia Pacific
- 5.4.4. Middle East and Africa
- 5.4.5. South America
- 5.1. Market Analysis, Insights and Forecast - by Product Type
- 6. North America Neurotechnology Market Analysis, Insights and Forecast, 2019-2031
- 6.1. Market Analysis, Insights and Forecast - by Product Type
- 6.1.1. Neuroprosthetics
- 6.1.2. Neurostimulation Devices
- 6.1.3. Brain-Computer Interfaces
- 6.1.4. Other Products
- 6.2. Market Analysis, Insights and Forecast - by Application
- 6.2.1. Neurodegenerative Disorders
- 6.2.2. Neuropsychiatric Disorders
- 6.2.3. Chronic Pain Management
- 6.2.4. Other Applications
- 6.3. Market Analysis, Insights and Forecast - by End User
- 6.3.1. Hospitals and Clinics
- 6.3.2. Research Institutes and Academic Centers
- 6.3.3. Other End Users
- 6.1. Market Analysis, Insights and Forecast - by Product Type
- 7. Europe Neurotechnology Market Analysis, Insights and Forecast, 2019-2031
- 7.1. Market Analysis, Insights and Forecast - by Product Type
- 7.1.1. Neuroprosthetics
- 7.1.2. Neurostimulation Devices
- 7.1.3. Brain-Computer Interfaces
- 7.1.4. Other Products
- 7.2. Market Analysis, Insights and Forecast - by Application
- 7.2.1. Neurodegenerative Disorders
- 7.2.2. Neuropsychiatric Disorders
- 7.2.3. Chronic Pain Management
- 7.2.4. Other Applications
- 7.3. Market Analysis, Insights and Forecast - by End User
- 7.3.1. Hospitals and Clinics
- 7.3.2. Research Institutes and Academic Centers
- 7.3.3. Other End Users
- 7.1. Market Analysis, Insights and Forecast - by Product Type
- 8. Asia Pacific Neurotechnology Market Analysis, Insights and Forecast, 2019-2031
- 8.1. Market Analysis, Insights and Forecast - by Product Type
- 8.1.1. Neuroprosthetics
- 8.1.2. Neurostimulation Devices
- 8.1.3. Brain-Computer Interfaces
- 8.1.4. Other Products
- 8.2. Market Analysis, Insights and Forecast - by Application
- 8.2.1. Neurodegenerative Disorders
- 8.2.2. Neuropsychiatric Disorders
- 8.2.3. Chronic Pain Management
- 8.2.4. Other Applications
- 8.3. Market Analysis, Insights and Forecast - by End User
- 8.3.1. Hospitals and Clinics
- 8.3.2. Research Institutes and Academic Centers
- 8.3.3. Other End Users
- 8.1. Market Analysis, Insights and Forecast - by Product Type
- 9. Middle East and Africa Neurotechnology Market Analysis, Insights and Forecast, 2019-2031
- 9.1. Market Analysis, Insights and Forecast - by Product Type
- 9.1.1. Neuroprosthetics
- 9.1.2. Neurostimulation Devices
- 9.1.3. Brain-Computer Interfaces
- 9.1.4. Other Products
- 9.2. Market Analysis, Insights and Forecast - by Application
- 9.2.1. Neurodegenerative Disorders
- 9.2.2. Neuropsychiatric Disorders
- 9.2.3. Chronic Pain Management
- 9.2.4. Other Applications
- 9.3. Market Analysis, Insights and Forecast - by End User
- 9.3.1. Hospitals and Clinics
- 9.3.2. Research Institutes and Academic Centers
- 9.3.3. Other End Users
- 9.1. Market Analysis, Insights and Forecast - by Product Type
- 10. South America Neurotechnology Market Analysis, Insights and Forecast, 2019-2031
- 10.1. Market Analysis, Insights and Forecast - by Product Type
- 10.1.1. Neuroprosthetics
- 10.1.2. Neurostimulation Devices
- 10.1.3. Brain-Computer Interfaces
- 10.1.4. Other Products
- 10.2. Market Analysis, Insights and Forecast - by Application
- 10.2.1. Neurodegenerative Disorders
- 10.2.2. Neuropsychiatric Disorders
- 10.2.3. Chronic Pain Management
- 10.2.4. Other Applications
- 10.3. Market Analysis, Insights and Forecast - by End User
- 10.3.1. Hospitals and Clinics
- 10.3.2. Research Institutes and Academic Centers
- 10.3.3. Other End Users
- 10.1. Market Analysis, Insights and Forecast - by Product Type
- 11. North America Neurotechnology Market Analysis, Insights and Forecast, 2019-2031
- 11.1. Market Analysis, Insights and Forecast - By Country/Sub-region
- 11.1.1. undefined
- 12. Europe Neurotechnology Market Analysis, Insights and Forecast, 2019-2031
- 12.1. Market Analysis, Insights and Forecast - By Country/Sub-region
- 12.1.1. undefined
- 13. Asia Pacific Neurotechnology Market Analysis, Insights and Forecast, 2019-2031
- 13.1. Market Analysis, Insights and Forecast - By Country/Sub-region
- 13.1.1. undefined
- 14. Middle East and Africa Neurotechnology Market Analysis, Insights and Forecast, 2019-2031
- 14.1. Market Analysis, Insights and Forecast - By Country/Sub-region
- 14.1.1. undefined
- 15. South America Neurotechnology Market Analysis, Insights and Forecast, 2019-2031
- 15.1. Market Analysis, Insights and Forecast - By Country/Sub-region
- 15.1.1. undefined
- 16. Competitive Analysis
- 16.1. Global Market Share Analysis 2024
- 16.2. Company Profiles
- 16.2.1 Elekta AB
- 16.2.1.1. Overview
- 16.2.1.2. Products
- 16.2.1.3. SWOT Analysis
- 16.2.1.4. Recent Developments
- 16.2.1.5. Financials (Based on Availability)
- 16.2.2 Neuronetics
- 16.2.2.1. Overview
- 16.2.2.2. Products
- 16.2.2.3. SWOT Analysis
- 16.2.2.4. Recent Developments
- 16.2.2.5. Financials (Based on Availability)
- 16.2.3 Siemens Healthineers
- 16.2.3.1. Overview
- 16.2.3.2. Products
- 16.2.3.3. SWOT Analysis
- 16.2.3.4. Recent Developments
- 16.2.3.5. Financials (Based on Availability)
- 16.2.4 Medtronic
- 16.2.4.1. Overview
- 16.2.4.2. Products
- 16.2.4.3. SWOT Analysis
- 16.2.4.4. Recent Developments
- 16.2.4.5. Financials (Based on Availability)
- 16.2.5 GE Healthcare
- 16.2.5.1. Overview
- 16.2.5.2. Products
- 16.2.5.3. SWOT Analysis
- 16.2.5.4. Recent Developments
- 16.2.5.5. Financials (Based on Availability)
- 16.2.6 Abbott Laboratories
- 16.2.6.1. Overview
- 16.2.6.2. Products
- 16.2.6.3. SWOT Analysis
- 16.2.6.4. Recent Developments
- 16.2.6.5. Financials (Based on Availability)
- 16.2.7 Koninklijke Philips N V
- 16.2.7.1. Overview
- 16.2.7.2. Products
- 16.2.7.3. SWOT Analysis
- 16.2.7.4. Recent Developments
- 16.2.7.5. Financials (Based on Availability)
- 16.2.8 Boston Scientific
- 16.2.8.1. Overview
- 16.2.8.2. Products
- 16.2.8.3. SWOT Analysis
- 16.2.8.4. Recent Developments
- 16.2.8.5. Financials (Based on Availability)
- 16.2.9 LivaNova PLC
- 16.2.9.1. Overview
- 16.2.9.2. Products
- 16.2.9.3. SWOT Analysis
- 16.2.9.4. Recent Developments
- 16.2.9.5. Financials (Based on Availability)
- 16.2.10 NeuroPace
- 16.2.10.1. Overview
- 16.2.10.2. Products
- 16.2.10.3. SWOT Analysis
- 16.2.10.4. Recent Developments
- 16.2.10.5. Financials (Based on Availability)
- 16.2.1 Elekta AB
List of Figures
- Figure 1: Global Neurotechnology Market Revenue Breakdown (Million, %) by Region 2024 & 2032
- Figure 2: Global Neurotechnology Market Volume Breakdown (K Unit, %) by Region 2024 & 2032
- Figure 3: North America Neurotechnology Market Revenue (Million), by Country 2024 & 2032
- Figure 4: North America Neurotechnology Market Volume (K Unit), by Country 2024 & 2032
- Figure 5: North America Neurotechnology Market Revenue Share (%), by Country 2024 & 2032
- Figure 6: North America Neurotechnology Market Volume Share (%), by Country 2024 & 2032
- Figure 7: Europe Neurotechnology Market Revenue (Million), by Country 2024 & 2032
- Figure 8: Europe Neurotechnology Market Volume (K Unit), by Country 2024 & 2032
- Figure 9: Europe Neurotechnology Market Revenue Share (%), by Country 2024 & 2032
- Figure 10: Europe Neurotechnology Market Volume Share (%), by Country 2024 & 2032
- Figure 11: Asia Pacific Neurotechnology Market Revenue (Million), by Country 2024 & 2032
- Figure 12: Asia Pacific Neurotechnology Market Volume (K Unit), by Country 2024 & 2032
- Figure 13: Asia Pacific Neurotechnology Market Revenue Share (%), by Country 2024 & 2032
- Figure 14: Asia Pacific Neurotechnology Market Volume Share (%), by Country 2024 & 2032
- Figure 15: Middle East and Africa Neurotechnology Market Revenue (Million), by Country 2024 & 2032
- Figure 16: Middle East and Africa Neurotechnology Market Volume (K Unit), by Country 2024 & 2032
- Figure 17: Middle East and Africa Neurotechnology Market Revenue Share (%), by Country 2024 & 2032
- Figure 18: Middle East and Africa Neurotechnology Market Volume Share (%), by Country 2024 & 2032
- Figure 19: South America Neurotechnology Market Revenue (Million), by Country 2024 & 2032
- Figure 20: South America Neurotechnology Market Volume (K Unit), by Country 2024 & 2032
- Figure 21: South America Neurotechnology Market Revenue Share (%), by Country 2024 & 2032
- Figure 22: South America Neurotechnology Market Volume Share (%), by Country 2024 & 2032
- Figure 23: North America Neurotechnology Market Revenue (Million), by Product Type 2024 & 2032
- Figure 24: North America Neurotechnology Market Volume (K Unit), by Product Type 2024 & 2032
- Figure 25: North America Neurotechnology Market Revenue Share (%), by Product Type 2024 & 2032
- Figure 26: North America Neurotechnology Market Volume Share (%), by Product Type 2024 & 2032
- Figure 27: North America Neurotechnology Market Revenue (Million), by Application 2024 & 2032
- Figure 28: North America Neurotechnology Market Volume (K Unit), by Application 2024 & 2032
- Figure 29: North America Neurotechnology Market Revenue Share (%), by Application 2024 & 2032
- Figure 30: North America Neurotechnology Market Volume Share (%), by Application 2024 & 2032
- Figure 31: North America Neurotechnology Market Revenue (Million), by End User 2024 & 2032
- Figure 32: North America Neurotechnology Market Volume (K Unit), by End User 2024 & 2032
- Figure 33: North America Neurotechnology Market Revenue Share (%), by End User 2024 & 2032
- Figure 34: North America Neurotechnology Market Volume Share (%), by End User 2024 & 2032
- Figure 35: North America Neurotechnology Market Revenue (Million), by Country 2024 & 2032
- Figure 36: North America Neurotechnology Market Volume (K Unit), by Country 2024 & 2032
- Figure 37: North America Neurotechnology Market Revenue Share (%), by Country 2024 & 2032
- Figure 38: North America Neurotechnology Market Volume Share (%), by Country 2024 & 2032
- Figure 39: Europe Neurotechnology Market Revenue (Million), by Product Type 2024 & 2032
- Figure 40: Europe Neurotechnology Market Volume (K Unit), by Product Type 2024 & 2032
- Figure 41: Europe Neurotechnology Market Revenue Share (%), by Product Type 2024 & 2032
- Figure 42: Europe Neurotechnology Market Volume Share (%), by Product Type 2024 & 2032
- Figure 43: Europe Neurotechnology Market Revenue (Million), by Application 2024 & 2032
- Figure 44: Europe Neurotechnology Market Volume (K Unit), by Application 2024 & 2032
- Figure 45: Europe Neurotechnology Market Revenue Share (%), by Application 2024 & 2032
- Figure 46: Europe Neurotechnology Market Volume Share (%), by Application 2024 & 2032
- Figure 47: Europe Neurotechnology Market Revenue (Million), by End User 2024 & 2032
- Figure 48: Europe Neurotechnology Market Volume (K Unit), by End User 2024 & 2032
- Figure 49: Europe Neurotechnology Market Revenue Share (%), by End User 2024 & 2032
- Figure 50: Europe Neurotechnology Market Volume Share (%), by End User 2024 & 2032
- Figure 51: Europe Neurotechnology Market Revenue (Million), by Country 2024 & 2032
- Figure 52: Europe Neurotechnology Market Volume (K Unit), by Country 2024 & 2032
- Figure 53: Europe Neurotechnology Market Revenue Share (%), by Country 2024 & 2032
- Figure 54: Europe Neurotechnology Market Volume Share (%), by Country 2024 & 2032
- Figure 55: Asia Pacific Neurotechnology Market Revenue (Million), by Product Type 2024 & 2032
- Figure 56: Asia Pacific Neurotechnology Market Volume (K Unit), by Product Type 2024 & 2032
- Figure 57: Asia Pacific Neurotechnology Market Revenue Share (%), by Product Type 2024 & 2032
- Figure 58: Asia Pacific Neurotechnology Market Volume Share (%), by Product Type 2024 & 2032
- Figure 59: Asia Pacific Neurotechnology Market Revenue (Million), by Application 2024 & 2032
- Figure 60: Asia Pacific Neurotechnology Market Volume (K Unit), by Application 2024 & 2032
- Figure 61: Asia Pacific Neurotechnology Market Revenue Share (%), by Application 2024 & 2032
- Figure 62: Asia Pacific Neurotechnology Market Volume Share (%), by Application 2024 & 2032
- Figure 63: Asia Pacific Neurotechnology Market Revenue (Million), by End User 2024 & 2032
- Figure 64: Asia Pacific Neurotechnology Market Volume (K Unit), by End User 2024 & 2032
- Figure 65: Asia Pacific Neurotechnology Market Revenue Share (%), by End User 2024 & 2032
- Figure 66: Asia Pacific Neurotechnology Market Volume Share (%), by End User 2024 & 2032
- Figure 67: Asia Pacific Neurotechnology Market Revenue (Million), by Country 2024 & 2032
- Figure 68: Asia Pacific Neurotechnology Market Volume (K Unit), by Country 2024 & 2032
- Figure 69: Asia Pacific Neurotechnology Market Revenue Share (%), by Country 2024 & 2032
- Figure 70: Asia Pacific Neurotechnology Market Volume Share (%), by Country 2024 & 2032
- Figure 71: Middle East and Africa Neurotechnology Market Revenue (Million), by Product Type 2024 & 2032
- Figure 72: Middle East and Africa Neurotechnology Market Volume (K Unit), by Product Type 2024 & 2032
- Figure 73: Middle East and Africa Neurotechnology Market Revenue Share (%), by Product Type 2024 & 2032
- Figure 74: Middle East and Africa Neurotechnology Market Volume Share (%), by Product Type 2024 & 2032
- Figure 75: Middle East and Africa Neurotechnology Market Revenue (Million), by Application 2024 & 2032
- Figure 76: Middle East and Africa Neurotechnology Market Volume (K Unit), by Application 2024 & 2032
- Figure 77: Middle East and Africa Neurotechnology Market Revenue Share (%), by Application 2024 & 2032
- Figure 78: Middle East and Africa Neurotechnology Market Volume Share (%), by Application 2024 & 2032
- Figure 79: Middle East and Africa Neurotechnology Market Revenue (Million), by End User 2024 & 2032
- Figure 80: Middle East and Africa Neurotechnology Market Volume (K Unit), by End User 2024 & 2032
- Figure 81: Middle East and Africa Neurotechnology Market Revenue Share (%), by End User 2024 & 2032
- Figure 82: Middle East and Africa Neurotechnology Market Volume Share (%), by End User 2024 & 2032
- Figure 83: Middle East and Africa Neurotechnology Market Revenue (Million), by Country 2024 & 2032
- Figure 84: Middle East and Africa Neurotechnology Market Volume (K Unit), by Country 2024 & 2032
- Figure 85: Middle East and Africa Neurotechnology Market Revenue Share (%), by Country 2024 & 2032
- Figure 86: Middle East and Africa Neurotechnology Market Volume Share (%), by Country 2024 & 2032
- Figure 87: South America Neurotechnology Market Revenue (Million), by Product Type 2024 & 2032
- Figure 88: South America Neurotechnology Market Volume (K Unit), by Product Type 2024 & 2032
- Figure 89: South America Neurotechnology Market Revenue Share (%), by Product Type 2024 & 2032
- Figure 90: South America Neurotechnology Market Volume Share (%), by Product Type 2024 & 2032
- Figure 91: South America Neurotechnology Market Revenue (Million), by Application 2024 & 2032
- Figure 92: South America Neurotechnology Market Volume (K Unit), by Application 2024 & 2032
- Figure 93: South America Neurotechnology Market Revenue Share (%), by Application 2024 & 2032
- Figure 94: South America Neurotechnology Market Volume Share (%), by Application 2024 & 2032
- Figure 95: South America Neurotechnology Market Revenue (Million), by End User 2024 & 2032
- Figure 96: South America Neurotechnology Market Volume (K Unit), by End User 2024 & 2032
- Figure 97: South America Neurotechnology Market Revenue Share (%), by End User 2024 & 2032
- Figure 98: South America Neurotechnology Market Volume Share (%), by End User 2024 & 2032
- Figure 99: South America Neurotechnology Market Revenue (Million), by Country 2024 & 2032
- Figure 100: South America Neurotechnology Market Volume (K Unit), by Country 2024 & 2032
- Figure 101: South America Neurotechnology Market Revenue Share (%), by Country 2024 & 2032
- Figure 102: South America Neurotechnology Market Volume Share (%), by Country 2024 & 2032
List of Tables
- Table 1: Global Neurotechnology Market Revenue Million Forecast, by Region 2019 & 2032
- Table 2: Global Neurotechnology Market Volume K Unit Forecast, by Region 2019 & 2032
- Table 3: Global Neurotechnology Market Revenue Million Forecast, by Product Type 2019 & 2032
- Table 4: Global Neurotechnology Market Volume K Unit Forecast, by Product Type 2019 & 2032
- Table 5: Global Neurotechnology Market Revenue Million Forecast, by Application 2019 & 2032
- Table 6: Global Neurotechnology Market Volume K Unit Forecast, by Application 2019 & 2032
- Table 7: Global Neurotechnology Market Revenue Million Forecast, by End User 2019 & 2032
- Table 8: Global Neurotechnology Market Volume K Unit Forecast, by End User 2019 & 2032
- Table 9: Global Neurotechnology Market Revenue Million Forecast, by Region 2019 & 2032
- Table 10: Global Neurotechnology Market Volume K Unit Forecast, by Region 2019 & 2032
- Table 11: Global Neurotechnology Market Revenue Million Forecast, by Country 2019 & 2032
- Table 12: Global Neurotechnology Market Volume K Unit Forecast, by Country 2019 & 2032
- Table 13: Global Neurotechnology Market Revenue Million Forecast, by Country 2019 & 2032
- Table 14: Global Neurotechnology Market Volume K Unit Forecast, by Country 2019 & 2032
- Table 15: Global Neurotechnology Market Revenue Million Forecast, by Country 2019 & 2032
- Table 16: Global Neurotechnology Market Volume K Unit Forecast, by Country 2019 & 2032
- Table 17: Global Neurotechnology Market Revenue Million Forecast, by Country 2019 & 2032
- Table 18: Global Neurotechnology Market Volume K Unit Forecast, by Country 2019 & 2032
- Table 19: Global Neurotechnology Market Revenue Million Forecast, by Country 2019 & 2032
- Table 20: Global Neurotechnology Market Volume K Unit Forecast, by Country 2019 & 2032
- Table 21: Global Neurotechnology Market Revenue Million Forecast, by Product Type 2019 & 2032
- Table 22: Global Neurotechnology Market Volume K Unit Forecast, by Product Type 2019 & 2032
- Table 23: Global Neurotechnology Market Revenue Million Forecast, by Application 2019 & 2032
- Table 24: Global Neurotechnology Market Volume K Unit Forecast, by Application 2019 & 2032
- Table 25: Global Neurotechnology Market Revenue Million Forecast, by End User 2019 & 2032
- Table 26: Global Neurotechnology Market Volume K Unit Forecast, by End User 2019 & 2032
- Table 27: Global Neurotechnology Market Revenue Million Forecast, by Country 2019 & 2032
- Table 28: Global Neurotechnology Market Volume K Unit Forecast, by Country 2019 & 2032
- Table 29: United States Neurotechnology Market Revenue (Million) Forecast, by Application 2019 & 2032
- Table 30: United States Neurotechnology Market Volume (K Unit) Forecast, by Application 2019 & 2032
- Table 31: Canada Neurotechnology Market Revenue (Million) Forecast, by Application 2019 & 2032
- Table 32: Canada Neurotechnology Market Volume (K Unit) Forecast, by Application 2019 & 2032
- Table 33: Mexico Neurotechnology Market Revenue (Million) Forecast, by Application 2019 & 2032
- Table 34: Mexico Neurotechnology Market Volume (K Unit) Forecast, by Application 2019 & 2032
- Table 35: Global Neurotechnology Market Revenue Million Forecast, by Product Type 2019 & 2032
- Table 36: Global Neurotechnology Market Volume K Unit Forecast, by Product Type 2019 & 2032
- Table 37: Global Neurotechnology Market Revenue Million Forecast, by Application 2019 & 2032
- Table 38: Global Neurotechnology Market Volume K Unit Forecast, by Application 2019 & 2032
- Table 39: Global Neurotechnology Market Revenue Million Forecast, by End User 2019 & 2032
- Table 40: Global Neurotechnology Market Volume K Unit Forecast, by End User 2019 & 2032
- Table 41: Global Neurotechnology Market Revenue Million Forecast, by Country 2019 & 2032
- Table 42: Global Neurotechnology Market Volume K Unit Forecast, by Country 2019 & 2032
- Table 43: Germany Neurotechnology Market Revenue (Million) Forecast, by Application 2019 & 2032
- Table 44: Germany Neurotechnology Market Volume (K Unit) Forecast, by Application 2019 & 2032
- Table 45: United Kingdom Neurotechnology Market Revenue (Million) Forecast, by Application 2019 & 2032
- Table 46: United Kingdom Neurotechnology Market Volume (K Unit) Forecast, by Application 2019 & 2032
- Table 47: France Neurotechnology Market Revenue (Million) Forecast, by Application 2019 & 2032
- Table 48: France Neurotechnology Market Volume (K Unit) Forecast, by Application 2019 & 2032
- Table 49: Italy Neurotechnology Market Revenue (Million) Forecast, by Application 2019 & 2032
- Table 50: Italy Neurotechnology Market Volume (K Unit) Forecast, by Application 2019 & 2032
- Table 51: Spain Neurotechnology Market Revenue (Million) Forecast, by Application 2019 & 2032
- Table 52: Spain Neurotechnology Market Volume (K Unit) Forecast, by Application 2019 & 2032
- Table 53: Rest of Europe Neurotechnology Market Revenue (Million) Forecast, by Application 2019 & 2032
- Table 54: Rest of Europe Neurotechnology Market Volume (K Unit) Forecast, by Application 2019 & 2032
- Table 55: Global Neurotechnology Market Revenue Million Forecast, by Product Type 2019 & 2032
- Table 56: Global Neurotechnology Market Volume K Unit Forecast, by Product Type 2019 & 2032
- Table 57: Global Neurotechnology Market Revenue Million Forecast, by Application 2019 & 2032
- Table 58: Global Neurotechnology Market Volume K Unit Forecast, by Application 2019 & 2032
- Table 59: Global Neurotechnology Market Revenue Million Forecast, by End User 2019 & 2032
- Table 60: Global Neurotechnology Market Volume K Unit Forecast, by End User 2019 & 2032
- Table 61: Global Neurotechnology Market Revenue Million Forecast, by Country 2019 & 2032
- Table 62: Global Neurotechnology Market Volume K Unit Forecast, by Country 2019 & 2032
- Table 63: China Neurotechnology Market Revenue (Million) Forecast, by Application 2019 & 2032
- Table 64: China Neurotechnology Market Volume (K Unit) Forecast, by Application 2019 & 2032
- Table 65: Japan Neurotechnology Market Revenue (Million) Forecast, by Application 2019 & 2032
- Table 66: Japan Neurotechnology Market Volume (K Unit) Forecast, by Application 2019 & 2032
- Table 67: India Neurotechnology Market Revenue (Million) Forecast, by Application 2019 & 2032
- Table 68: India Neurotechnology Market Volume (K Unit) Forecast, by Application 2019 & 2032
- Table 69: Australia Neurotechnology Market Revenue (Million) Forecast, by Application 2019 & 2032
- Table 70: Australia Neurotechnology Market Volume (K Unit) Forecast, by Application 2019 & 2032
- Table 71: South Korea Neurotechnology Market Revenue (Million) Forecast, by Application 2019 & 2032
- Table 72: South Korea Neurotechnology Market Volume (K Unit) Forecast, by Application 2019 & 2032
- Table 73: Rest of Asia Pacific Neurotechnology Market Revenue (Million) Forecast, by Application 2019 & 2032
- Table 74: Rest of Asia Pacific Neurotechnology Market Volume (K Unit) Forecast, by Application 2019 & 2032
- Table 75: Global Neurotechnology Market Revenue Million Forecast, by Product Type 2019 & 2032
- Table 76: Global Neurotechnology Market Volume K Unit Forecast, by Product Type 2019 & 2032
- Table 77: Global Neurotechnology Market Revenue Million Forecast, by Application 2019 & 2032
- Table 78: Global Neurotechnology Market Volume K Unit Forecast, by Application 2019 & 2032
- Table 79: Global Neurotechnology Market Revenue Million Forecast, by End User 2019 & 2032
- Table 80: Global Neurotechnology Market Volume K Unit Forecast, by End User 2019 & 2032
- Table 81: Global Neurotechnology Market Revenue Million Forecast, by Country 2019 & 2032
- Table 82: Global Neurotechnology Market Volume K Unit Forecast, by Country 2019 & 2032
- Table 83: GCC Neurotechnology Market Revenue (Million) Forecast, by Application 2019 & 2032
- Table 84: GCC Neurotechnology Market Volume (K Unit) Forecast, by Application 2019 & 2032
- Table 85: South Africa Neurotechnology Market Revenue (Million) Forecast, by Application 2019 & 2032
- Table 86: South Africa Neurotechnology Market Volume (K Unit) Forecast, by Application 2019 & 2032
- Table 87: Rest of Middle East and Africa Neurotechnology Market Revenue (Million) Forecast, by Application 2019 & 2032
- Table 88: Rest of Middle East and Africa Neurotechnology Market Volume (K Unit) Forecast, by Application 2019 & 2032
- Table 89: Global Neurotechnology Market Revenue Million Forecast, by Product Type 2019 & 2032
- Table 90: Global Neurotechnology Market Volume K Unit Forecast, by Product Type 2019 & 2032
- Table 91: Global Neurotechnology Market Revenue Million Forecast, by Application 2019 & 2032
- Table 92: Global Neurotechnology Market Volume K Unit Forecast, by Application 2019 & 2032
- Table 93: Global Neurotechnology Market Revenue Million Forecast, by End User 2019 & 2032
- Table 94: Global Neurotechnology Market Volume K Unit Forecast, by End User 2019 & 2032
- Table 95: Global Neurotechnology Market Revenue Million Forecast, by Country 2019 & 2032
- Table 96: Global Neurotechnology Market Volume K Unit Forecast, by Country 2019 & 2032
- Table 97: Brazil Neurotechnology Market Revenue (Million) Forecast, by Application 2019 & 2032
- Table 98: Brazil Neurotechnology Market Volume (K Unit) Forecast, by Application 2019 & 2032
- Table 99: Argentina Neurotechnology Market Revenue (Million) Forecast, by Application 2019 & 2032
- Table 100: Argentina Neurotechnology Market Volume (K Unit) Forecast, by Application 2019 & 2032
- Table 101: Rest of South America Neurotechnology Market Revenue (Million) Forecast, by Application 2019 & 2032
- Table 102: Rest of South America Neurotechnology Market Volume (K Unit) Forecast, by Application 2019 & 2032
Frequently Asked Questions
1. What is the projected Compound Annual Growth Rate (CAGR) of the Neurotechnology Market?
The projected CAGR is approximately 13.50%.
2. Which companies are prominent players in the Neurotechnology Market?
Key companies in the market include Elekta AB, Neuronetics, Siemens Healthineers, Medtronic, GE Healthcare, Abbott Laboratories, Koninklijke Philips N V, Boston Scientific, LivaNova PLC, NeuroPace.
3. What are the main segments of the Neurotechnology Market?
The market segments include Product Type, Application, End User.
4. Can you provide details about the market size?
The market size is estimated to be USD 15.18 Million as of 2022.
5. What are some drivers contributing to market growth?
Rising Prevalence of Neurological Disorders; Surging Advancements in Neuroscience and Technology; Growing Demand for Improved Treatment Options.
6. What are the notable trends driving market growth?
Neurostimulation Devices Segment is Expected to Witness Significant Growth during the Forecast Period.
7. Are there any restraints impacting market growth?
High Cost of Neurotechnology Devices; Stringent Regulatory Framework.
8. Can you provide examples of recent developments in the market?
In March 2024, SetPoint Medical, a clinical-stage healthcare company, received a breakthrough device designation from the United States Food and Drug Administration (FDA) for the use of its novel neuroimmune modulation platform for people suffering from relapsing-remitting multiple sclerosis (RRMS).
9. What pricing options are available for accessing the report?
Pricing options include single-user, multi-user, and enterprise licenses priced at USD 4750, USD 5250, and USD 8750 respectively.
10. Is the market size provided in terms of value or volume?
The market size is provided in terms of value, measured in Million and volume, measured in K Unit.
11. Are there any specific market keywords associated with the report?
Yes, the market keyword associated with the report is "Neurotechnology Market," which aids in identifying and referencing the specific market segment covered.
12. How do I determine which pricing option suits my needs best?
The pricing options vary based on user requirements and access needs. Individual users may opt for single-user licenses, while businesses requiring broader access may choose multi-user or enterprise licenses for cost-effective access to the report.
13. Are there any additional resources or data provided in the Neurotechnology Market report?
While the report offers comprehensive insights, it's advisable to review the specific contents or supplementary materials provided to ascertain if additional resources or data are available.
14. How can I stay updated on further developments or reports in the Neurotechnology Market?
To stay informed about further developments, trends, and reports in the Neurotechnology Market, consider subscribing to industry newsletters, following relevant companies and organizations, or regularly checking reputable industry news sources and publications.
Methodology
Step 1 - Identification of Relevant Samples Size from Population Database


Step 2 - Approaches for Defining Global Market Size (Value, Volume* & Price*)

Note*: In applicable scenarios
Step 3 - Data Sources
Primary Research
- Web Analytics
- Survey Reports
- Research Institute
- Latest Research Reports
- Opinion Leaders
Secondary Research
- Annual Reports
- White Paper
- Latest Press Release
- Industry Association
- Paid Database
- Investor Presentations

Step 4 - Data Triangulation
Involves using different sources of information in order to increase the validity of a study
These sources are likely to be stakeholders in a program - participants, other researchers, program staff, other community members, and so on.
Then we put all data in single framework & apply various statistical tools to find out the dynamic on the market.
During the analysis stage, feedback from the stakeholder groups would be compared to determine areas of agreement as well as areas of divergence
