

Key Insights
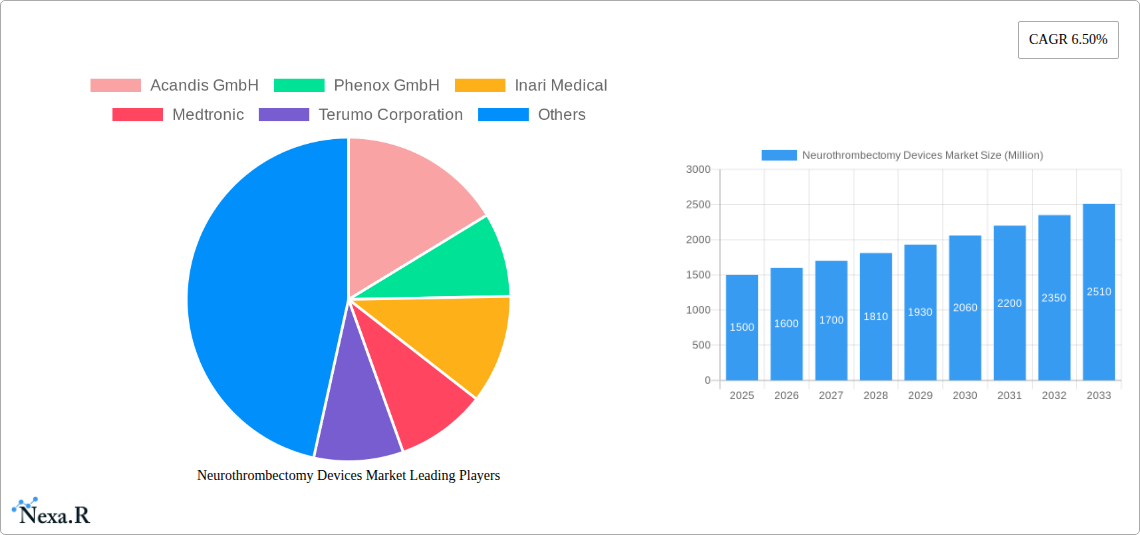
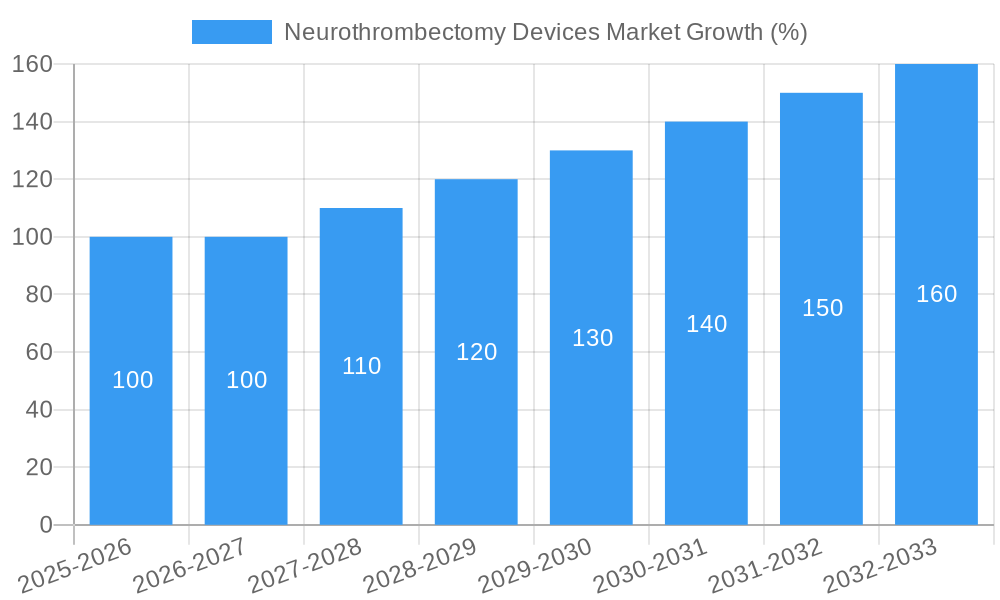
The Neurothrombectomy Devices market, valued at approximately $1.5 billion in 2025, is poised for robust growth, exhibiting a Compound Annual Growth Rate (CAGR) of 6.5% from 2025 to 2033. This expansion is driven by several key factors. The rising prevalence of ischemic stroke, a leading cause of disability and mortality globally, fuels the demand for effective treatment options like neurothrombectomy devices. Technological advancements leading to the development of more efficient and minimally invasive devices, alongside increasing awareness among healthcare professionals and patients regarding the benefits of neurothrombectomy, are further contributing to market growth. The market is segmented by product type (clot retrievers, suction devices, vascular snares) and end-user (hospitals, ambulatory surgical centers). Hospitals currently dominate the market share due to their advanced infrastructure and expertise in handling complex neurological procedures. However, the increasing adoption of minimally invasive procedures and the rising preference for shorter hospital stays are expected to drive growth within the ambulatory surgical centers segment. Geographic expansion, particularly in emerging markets with rising healthcare expenditure and improving healthcare infrastructure, presents significant opportunities for market players.
Competition in the Neurothrombectomy Devices market is intense, with key players including Acandis GmbH, Phenox GmbH, Inari Medical, Medtronic, Terumo Corporation, Abbott Laboratories, Stryker, Edward Lifesciences Corporation, Vesalio, Johnson & Johnson, Argon Medical, and Penumbra Inc. These companies are engaged in continuous research and development to enhance device efficacy, safety, and usability. Strategic collaborations, mergers and acquisitions, and the introduction of innovative products are key strategies employed by market participants to strengthen their market position and expand their global reach. While the market faces challenges such as stringent regulatory approvals and high device costs, the overall outlook remains positive, driven by the unmet medical needs in stroke care and the continuous efforts to improve treatment outcomes.
Neurothrombectomy Devices Market: A Comprehensive Report (2019-2033)
This comprehensive report provides a detailed analysis of the Neurothrombectomy Devices market, encompassing market dynamics, growth trends, regional dominance, product landscape, key players, and future outlook. The study period covers 2019-2033, with 2025 as the base and estimated year. The forecast period spans 2025-2033, and the historical period covers 2019-2024. The report segments the market by Product (Clot Retrievers, Suction Devices, Vascular Snares) and End-User (Hospitals, Ambulatory Surgical Centers, Other End Users). The global Neurothrombectomy Devices market is estimated to be valued at XX Million units in 2025 and is projected to reach XX Million units by 2033.
Neurothrombectomy Devices Market Market Dynamics & Structure
The Neurothrombectomy Devices market is characterized by a moderately concentrated structure with key players holding significant market share. Technological innovation, particularly in the development of minimally invasive devices and improved clot retrieval techniques, is a primary growth driver. Stringent regulatory frameworks, including those set by the FDA and other international bodies, significantly influence market access and product development. Competitive pressures from established players and emerging companies drive innovation and product differentiation. The market also experiences M&A activity, reflecting consolidation and expansion strategies within the industry. The increasing prevalence of ischemic stroke globally fuels market growth, while the high cost of devices and procedures can pose a barrier to adoption, especially in resource-constrained settings.
- Market Concentration: Moderately concentrated, with top 5 players holding approximately xx% market share in 2025.
- Technological Innovation: Focus on improved clot retrieval efficiency, reduced procedural times, and enhanced patient outcomes.
- Regulatory Landscape: Stringent regulatory pathways influence market entry and product approval.
- Competitive Dynamics: Intense competition driven by innovation and market share gains.
- M&A Activity: xx major M&A deals recorded between 2019 and 2024, indicating industry consolidation.
- End-User Demographics: Growth driven by increasing geriatric population and rising prevalence of stroke.
Neurothrombectomy Devices Market Growth Trends & Insights
The Neurothrombectomy Devices market experienced substantial growth between 2019 and 2024, driven by factors including the increasing prevalence of ischemic stroke, technological advancements in device design and functionality, and rising healthcare expenditure. The market is projected to maintain a healthy CAGR of xx% during the forecast period (2025-2033). Technological advancements, such as the development of more efficient clot retrieval devices and improved imaging techniques, are significantly impacting adoption rates. Consumer behavior is shifting towards minimally invasive procedures with shorter recovery times, further bolstering market demand. Market penetration continues to increase, particularly in developed regions with robust healthcare infrastructure. The growing awareness of stroke prevention and treatment further contributes to market growth.
Dominant Regions, Countries, or Segments in Neurothrombectomy Devices Market
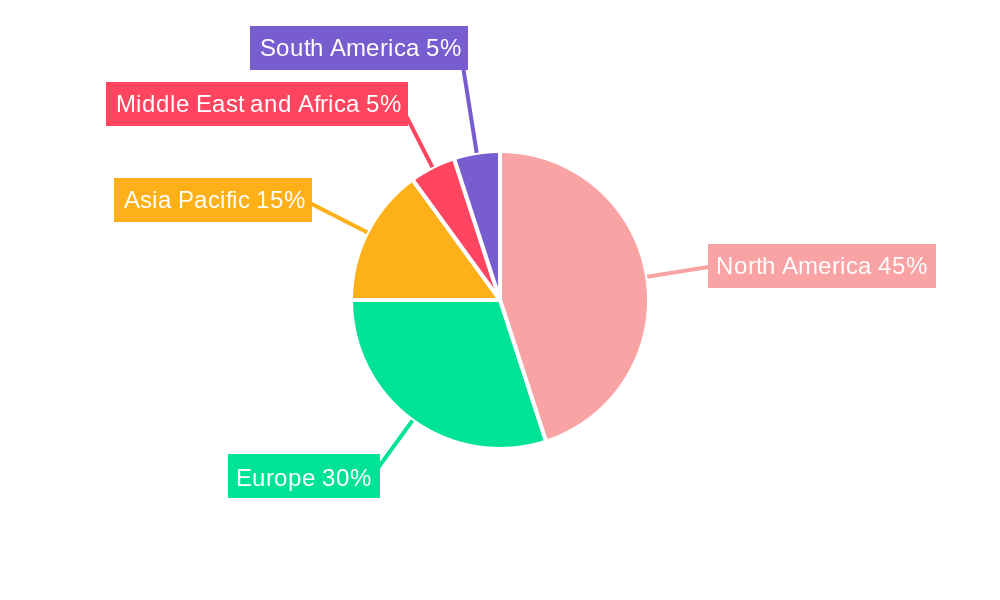
North America currently dominates the Neurothrombectomy Devices market, driven by high healthcare expenditure, advanced infrastructure, and a large patient pool. However, Asia Pacific is poised for significant growth due to rapid economic development, increasing healthcare investments, and rising awareness about stroke prevention and treatment. Within product segments, Clot Retrievers hold the largest market share, followed by Suction Devices and Vascular Snares. Hospitals represent the major end-user segment, followed by Ambulatory Surgical Centers.
- North America: High healthcare expenditure, advanced medical infrastructure, and robust regulatory frameworks drive market dominance.
- Asia Pacific: Rapid economic growth, increasing healthcare investments, and rising prevalence of stroke fuel significant growth potential.
- Europe: Stable growth driven by rising healthcare spending and technological advancements.
- Clot Retrievers: Largest market segment due to high efficacy and widespread adoption.
- Hospitals: Largest end-user segment due to higher procedural volumes and specialized infrastructure.
Neurothrombectomy Devices Market Product Landscape
The Neurothrombectomy Devices market offers a range of products, including clot retrievers, suction devices, and vascular snares, each with unique features and applications. Recent innovations have focused on improving device design for better clot removal efficiency, reduced trauma to blood vessels, and improved navigation. Technological advancements such as improved material science, miniaturization, and enhanced imaging integration are key factors driving product innovation. Key features include enhanced flexibility, improved maneuverability, and reduced procedural complications.
Key Drivers, Barriers & Challenges in Neurothrombectomy Devices Market
Key Drivers:
- Increasing prevalence of stroke globally.
- Technological advancements in device design and functionality.
- Rising healthcare expenditure and insurance coverage.
Key Barriers & Challenges:
- High cost of devices and procedures limiting accessibility.
- Stringent regulatory requirements impacting market entry.
- Potential supply chain disruptions and material shortages.
- Intense competition from established and emerging players. The impact of these challenges is estimated to reduce market growth by approximately xx% by 2033.
Emerging Opportunities in Neurothrombectomy Devices Market
- Expanding into untapped markets in developing economies.
- Development of advanced thrombectomy devices with improved functionality.
- Focus on developing personalized medicine approaches for stroke treatment.
- Strategic partnerships and collaborations for improved market access and distribution.
Growth Accelerators in the Neurothrombectomy Devices Market Industry
Long-term growth in the Neurothrombectomy Devices market will be driven by continuous technological innovation, strategic partnerships to expand market reach, and strategic investments in research and development. The focus on minimally invasive techniques, improved device design, and advanced imaging technologies are pivotal for sustained market expansion. Furthermore, government initiatives promoting stroke prevention and treatment programs will further propel market growth.
Key Players Shaping the Neurothrombectomy Devices Market Market
- Acandis GmbH
- Phenox GmbH
- Inari Medical
- Medtronic
- Terumo Corporation
- Abbott Laboratories
- Stryker
- Edward Lifesciences Corporation
- Vesalio
- Johnson & Johnson
- Argon Medical
- Penumbra Inc
Notable Milestones in Neurothrombectomy Devices Market Sector
- 2020: FDA approval of a new generation clot retriever.
- 2021: Strategic partnership between two major players for co-development of a novel device.
- 2022: Launch of a new minimally invasive suction device.
- 2023: Publication of significant clinical trial data demonstrating improved patient outcomes.
- 2024: Acquisition of a smaller device company by a larger player.
In-Depth Neurothrombectomy Devices Market Market Outlook
The Neurothrombectomy Devices market is poised for continued growth over the forecast period, driven by technological advancements, increasing prevalence of stroke, and expanding access to healthcare services. Strategic partnerships, acquisitions, and investments in R&D will further stimulate market expansion. The focus on minimally invasive procedures and improved patient outcomes will remain a key driver of long-term growth. Opportunities exist in developing new devices, improving existing technologies, and penetrating emerging markets.
Neurothrombectomy Devices Market Segmentation
-
1. Product
- 1.1. Clot Retrievers
- 1.2. Suction Devices
- 1.3. Vascular Snares
-
2. End User
- 2.1. Hospitals
- 2.2. Ambulatory Surgical Centers
- 2.3. Other End Users
Neurothrombectomy Devices Market Segmentation By Geography
-
1. North America
- 1.1. United States
- 1.2. Canada
- 1.3. Mexico
-
2. Europe
- 2.1. Germany
- 2.2. United Kingdom
- 2.3. France
- 2.4. Spain
- 2.5. Italy
- 2.6. Rest of Europe
-
3. Asia Pacific
- 3.1. China
- 3.2. Japan
- 3.3. India
- 3.4. Austalia
- 3.5. South Korea
- 3.6. Rest of Asia Pacific
-
4. Middle East and Africa
- 4.1. GCC
- 4.2. South Africa
- 4.3. Rest of Middle East and Africa
-
5. South America
- 5.1. Brazil
- 5.2. Argentina
- 5.3. Rest of South America
Neurothrombectomy Devices Market REPORT HIGHLIGHTS
| Aspects | Details |
|---|---|
| Study Period | 2019-2033 |
| Base Year | 2024 |
| Estimated Year | 2025 |
| Forecast Period | 2025-2033 |
| Historical Period | 2019-2024 |
| Growth Rate | CAGR of 6.50% from 2019-2033 |
| Segmentation |
|
Table of Contents
- 1. Introduction
- 1.1. Research Scope
- 1.2. Market Segmentation
- 1.3. Research Methodology
- 1.4. Definitions and Assumptions
- 2. Executive Summary
- 2.1. Introduction
- 3. Market Dynamics
- 3.1. Introduction
- 3.2. Market Drivers
- 3.2.1. Increase in Geriatric Population; Increasing Prevalence of Ischemic Strokes
- 3.3. Market Restrains
- 3.3.1. Risks Associated with Neurothrombectomy Procedure
- 3.4. Market Trends
- 3.4.1. The Clot Retrievers Segment is Expected to Hold a Major Share in the Market over the Forecast Period
- 4. Market Factor Analysis
- 4.1. Porters Five Forces
- 4.2. Supply/Value Chain
- 4.3. PESTEL analysis
- 4.4. Market Entropy
- 4.5. Patent/Trademark Analysis
- 5. Global Neurothrombectomy Devices Market Analysis, Insights and Forecast, 2019-2031
- 5.1. Market Analysis, Insights and Forecast - by Product
- 5.1.1. Clot Retrievers
- 5.1.2. Suction Devices
- 5.1.3. Vascular Snares
- 5.2. Market Analysis, Insights and Forecast - by End User
- 5.2.1. Hospitals
- 5.2.2. Ambulatory Surgical Centers
- 5.2.3. Other End Users
- 5.3. Market Analysis, Insights and Forecast - by Region
- 5.3.1. North America
- 5.3.2. Europe
- 5.3.3. Asia Pacific
- 5.3.4. Middle East and Africa
- 5.3.5. South America
- 5.1. Market Analysis, Insights and Forecast - by Product
- 6. North America Neurothrombectomy Devices Market Analysis, Insights and Forecast, 2019-2031
- 6.1. Market Analysis, Insights and Forecast - by Product
- 6.1.1. Clot Retrievers
- 6.1.2. Suction Devices
- 6.1.3. Vascular Snares
- 6.2. Market Analysis, Insights and Forecast - by End User
- 6.2.1. Hospitals
- 6.2.2. Ambulatory Surgical Centers
- 6.2.3. Other End Users
- 6.1. Market Analysis, Insights and Forecast - by Product
- 7. Europe Neurothrombectomy Devices Market Analysis, Insights and Forecast, 2019-2031
- 7.1. Market Analysis, Insights and Forecast - by Product
- 7.1.1. Clot Retrievers
- 7.1.2. Suction Devices
- 7.1.3. Vascular Snares
- 7.2. Market Analysis, Insights and Forecast - by End User
- 7.2.1. Hospitals
- 7.2.2. Ambulatory Surgical Centers
- 7.2.3. Other End Users
- 7.1. Market Analysis, Insights and Forecast - by Product
- 8. Asia Pacific Neurothrombectomy Devices Market Analysis, Insights and Forecast, 2019-2031
- 8.1. Market Analysis, Insights and Forecast - by Product
- 8.1.1. Clot Retrievers
- 8.1.2. Suction Devices
- 8.1.3. Vascular Snares
- 8.2. Market Analysis, Insights and Forecast - by End User
- 8.2.1. Hospitals
- 8.2.2. Ambulatory Surgical Centers
- 8.2.3. Other End Users
- 8.1. Market Analysis, Insights and Forecast - by Product
- 9. Middle East and Africa Neurothrombectomy Devices Market Analysis, Insights and Forecast, 2019-2031
- 9.1. Market Analysis, Insights and Forecast - by Product
- 9.1.1. Clot Retrievers
- 9.1.2. Suction Devices
- 9.1.3. Vascular Snares
- 9.2. Market Analysis, Insights and Forecast - by End User
- 9.2.1. Hospitals
- 9.2.2. Ambulatory Surgical Centers
- 9.2.3. Other End Users
- 9.1. Market Analysis, Insights and Forecast - by Product
- 10. South America Neurothrombectomy Devices Market Analysis, Insights and Forecast, 2019-2031
- 10.1. Market Analysis, Insights and Forecast - by Product
- 10.1.1. Clot Retrievers
- 10.1.2. Suction Devices
- 10.1.3. Vascular Snares
- 10.2. Market Analysis, Insights and Forecast - by End User
- 10.2.1. Hospitals
- 10.2.2. Ambulatory Surgical Centers
- 10.2.3. Other End Users
- 10.1. Market Analysis, Insights and Forecast - by Product
- 11. North America Neurothrombectomy Devices Market Analysis, Insights and Forecast, 2019-2031
- 11.1. Market Analysis, Insights and Forecast - By Country/Sub-region
- 11.1.1. undefined
- 12. Europe Neurothrombectomy Devices Market Analysis, Insights and Forecast, 2019-2031
- 12.1. Market Analysis, Insights and Forecast - By Country/Sub-region
- 12.1.1. undefined
- 13. Asia Pacific Neurothrombectomy Devices Market Analysis, Insights and Forecast, 2019-2031
- 13.1. Market Analysis, Insights and Forecast - By Country/Sub-region
- 13.1.1. undefined
- 14. Middle East and Africa Neurothrombectomy Devices Market Analysis, Insights and Forecast, 2019-2031
- 14.1. Market Analysis, Insights and Forecast - By Country/Sub-region
- 14.1.1. undefined
- 15. South America Neurothrombectomy Devices Market Analysis, Insights and Forecast, 2019-2031
- 15.1. Market Analysis, Insights and Forecast - By Country/Sub-region
- 15.1.1. undefined
- 16. Competitive Analysis
- 16.1. Global Market Share Analysis 2024
- 16.2. Company Profiles
- 16.2.1 Acandis GmbH
- 16.2.1.1. Overview
- 16.2.1.2. Products
- 16.2.1.3. SWOT Analysis
- 16.2.1.4. Recent Developments
- 16.2.1.5. Financials (Based on Availability)
- 16.2.2 Phenox GmbH
- 16.2.2.1. Overview
- 16.2.2.2. Products
- 16.2.2.3. SWOT Analysis
- 16.2.2.4. Recent Developments
- 16.2.2.5. Financials (Based on Availability)
- 16.2.3 Inari Medical
- 16.2.3.1. Overview
- 16.2.3.2. Products
- 16.2.3.3. SWOT Analysis
- 16.2.3.4. Recent Developments
- 16.2.3.5. Financials (Based on Availability)
- 16.2.4 Medtronic
- 16.2.4.1. Overview
- 16.2.4.2. Products
- 16.2.4.3. SWOT Analysis
- 16.2.4.4. Recent Developments
- 16.2.4.5. Financials (Based on Availability)
- 16.2.5 Terumo Corporation
- 16.2.5.1. Overview
- 16.2.5.2. Products
- 16.2.5.3. SWOT Analysis
- 16.2.5.4. Recent Developments
- 16.2.5.5. Financials (Based on Availability)
- 16.2.6 Abbott Laboratories
- 16.2.6.1. Overview
- 16.2.6.2. Products
- 16.2.6.3. SWOT Analysis
- 16.2.6.4. Recent Developments
- 16.2.6.5. Financials (Based on Availability)
- 16.2.7 Stryker
- 16.2.7.1. Overview
- 16.2.7.2. Products
- 16.2.7.3. SWOT Analysis
- 16.2.7.4. Recent Developments
- 16.2.7.5. Financials (Based on Availability)
- 16.2.8 Edward Lifesciences Corporation
- 16.2.8.1. Overview
- 16.2.8.2. Products
- 16.2.8.3. SWOT Analysis
- 16.2.8.4. Recent Developments
- 16.2.8.5. Financials (Based on Availability)
- 16.2.9 Vesalio
- 16.2.9.1. Overview
- 16.2.9.2. Products
- 16.2.9.3. SWOT Analysis
- 16.2.9.4. Recent Developments
- 16.2.9.5. Financials (Based on Availability)
- 16.2.10 Johnson & Johnson
- 16.2.10.1. Overview
- 16.2.10.2. Products
- 16.2.10.3. SWOT Analysis
- 16.2.10.4. Recent Developments
- 16.2.10.5. Financials (Based on Availability)
- 16.2.11 Argon Medical
- 16.2.11.1. Overview
- 16.2.11.2. Products
- 16.2.11.3. SWOT Analysis
- 16.2.11.4. Recent Developments
- 16.2.11.5. Financials (Based on Availability)
- 16.2.12 Penumbra Inc
- 16.2.12.1. Overview
- 16.2.12.2. Products
- 16.2.12.3. SWOT Analysis
- 16.2.12.4. Recent Developments
- 16.2.12.5. Financials (Based on Availability)
- 16.2.1 Acandis GmbH
List of Figures
- Figure 1: Global Neurothrombectomy Devices Market Revenue Breakdown (Million, %) by Region 2024 & 2032
- Figure 2: Global Neurothrombectomy Devices Market Volume Breakdown (K Unit, %) by Region 2024 & 2032
- Figure 3: North America Neurothrombectomy Devices Market Revenue (Million), by Country 2024 & 2032
- Figure 4: North America Neurothrombectomy Devices Market Volume (K Unit), by Country 2024 & 2032
- Figure 5: North America Neurothrombectomy Devices Market Revenue Share (%), by Country 2024 & 2032
- Figure 6: North America Neurothrombectomy Devices Market Volume Share (%), by Country 2024 & 2032
- Figure 7: Europe Neurothrombectomy Devices Market Revenue (Million), by Country 2024 & 2032
- Figure 8: Europe Neurothrombectomy Devices Market Volume (K Unit), by Country 2024 & 2032
- Figure 9: Europe Neurothrombectomy Devices Market Revenue Share (%), by Country 2024 & 2032
- Figure 10: Europe Neurothrombectomy Devices Market Volume Share (%), by Country 2024 & 2032
- Figure 11: Asia Pacific Neurothrombectomy Devices Market Revenue (Million), by Country 2024 & 2032
- Figure 12: Asia Pacific Neurothrombectomy Devices Market Volume (K Unit), by Country 2024 & 2032
- Figure 13: Asia Pacific Neurothrombectomy Devices Market Revenue Share (%), by Country 2024 & 2032
- Figure 14: Asia Pacific Neurothrombectomy Devices Market Volume Share (%), by Country 2024 & 2032
- Figure 15: Middle East and Africa Neurothrombectomy Devices Market Revenue (Million), by Country 2024 & 2032
- Figure 16: Middle East and Africa Neurothrombectomy Devices Market Volume (K Unit), by Country 2024 & 2032
- Figure 17: Middle East and Africa Neurothrombectomy Devices Market Revenue Share (%), by Country 2024 & 2032
- Figure 18: Middle East and Africa Neurothrombectomy Devices Market Volume Share (%), by Country 2024 & 2032
- Figure 19: South America Neurothrombectomy Devices Market Revenue (Million), by Country 2024 & 2032
- Figure 20: South America Neurothrombectomy Devices Market Volume (K Unit), by Country 2024 & 2032
- Figure 21: South America Neurothrombectomy Devices Market Revenue Share (%), by Country 2024 & 2032
- Figure 22: South America Neurothrombectomy Devices Market Volume Share (%), by Country 2024 & 2032
- Figure 23: North America Neurothrombectomy Devices Market Revenue (Million), by Product 2024 & 2032
- Figure 24: North America Neurothrombectomy Devices Market Volume (K Unit), by Product 2024 & 2032
- Figure 25: North America Neurothrombectomy Devices Market Revenue Share (%), by Product 2024 & 2032
- Figure 26: North America Neurothrombectomy Devices Market Volume Share (%), by Product 2024 & 2032
- Figure 27: North America Neurothrombectomy Devices Market Revenue (Million), by End User 2024 & 2032
- Figure 28: North America Neurothrombectomy Devices Market Volume (K Unit), by End User 2024 & 2032
- Figure 29: North America Neurothrombectomy Devices Market Revenue Share (%), by End User 2024 & 2032
- Figure 30: North America Neurothrombectomy Devices Market Volume Share (%), by End User 2024 & 2032
- Figure 31: North America Neurothrombectomy Devices Market Revenue (Million), by Country 2024 & 2032
- Figure 32: North America Neurothrombectomy Devices Market Volume (K Unit), by Country 2024 & 2032
- Figure 33: North America Neurothrombectomy Devices Market Revenue Share (%), by Country 2024 & 2032
- Figure 34: North America Neurothrombectomy Devices Market Volume Share (%), by Country 2024 & 2032
- Figure 35: Europe Neurothrombectomy Devices Market Revenue (Million), by Product 2024 & 2032
- Figure 36: Europe Neurothrombectomy Devices Market Volume (K Unit), by Product 2024 & 2032
- Figure 37: Europe Neurothrombectomy Devices Market Revenue Share (%), by Product 2024 & 2032
- Figure 38: Europe Neurothrombectomy Devices Market Volume Share (%), by Product 2024 & 2032
- Figure 39: Europe Neurothrombectomy Devices Market Revenue (Million), by End User 2024 & 2032
- Figure 40: Europe Neurothrombectomy Devices Market Volume (K Unit), by End User 2024 & 2032
- Figure 41: Europe Neurothrombectomy Devices Market Revenue Share (%), by End User 2024 & 2032
- Figure 42: Europe Neurothrombectomy Devices Market Volume Share (%), by End User 2024 & 2032
- Figure 43: Europe Neurothrombectomy Devices Market Revenue (Million), by Country 2024 & 2032
- Figure 44: Europe Neurothrombectomy Devices Market Volume (K Unit), by Country 2024 & 2032
- Figure 45: Europe Neurothrombectomy Devices Market Revenue Share (%), by Country 2024 & 2032
- Figure 46: Europe Neurothrombectomy Devices Market Volume Share (%), by Country 2024 & 2032
- Figure 47: Asia Pacific Neurothrombectomy Devices Market Revenue (Million), by Product 2024 & 2032
- Figure 48: Asia Pacific Neurothrombectomy Devices Market Volume (K Unit), by Product 2024 & 2032
- Figure 49: Asia Pacific Neurothrombectomy Devices Market Revenue Share (%), by Product 2024 & 2032
- Figure 50: Asia Pacific Neurothrombectomy Devices Market Volume Share (%), by Product 2024 & 2032
- Figure 51: Asia Pacific Neurothrombectomy Devices Market Revenue (Million), by End User 2024 & 2032
- Figure 52: Asia Pacific Neurothrombectomy Devices Market Volume (K Unit), by End User 2024 & 2032
- Figure 53: Asia Pacific Neurothrombectomy Devices Market Revenue Share (%), by End User 2024 & 2032
- Figure 54: Asia Pacific Neurothrombectomy Devices Market Volume Share (%), by End User 2024 & 2032
- Figure 55: Asia Pacific Neurothrombectomy Devices Market Revenue (Million), by Country 2024 & 2032
- Figure 56: Asia Pacific Neurothrombectomy Devices Market Volume (K Unit), by Country 2024 & 2032
- Figure 57: Asia Pacific Neurothrombectomy Devices Market Revenue Share (%), by Country 2024 & 2032
- Figure 58: Asia Pacific Neurothrombectomy Devices Market Volume Share (%), by Country 2024 & 2032
- Figure 59: Middle East and Africa Neurothrombectomy Devices Market Revenue (Million), by Product 2024 & 2032
- Figure 60: Middle East and Africa Neurothrombectomy Devices Market Volume (K Unit), by Product 2024 & 2032
- Figure 61: Middle East and Africa Neurothrombectomy Devices Market Revenue Share (%), by Product 2024 & 2032
- Figure 62: Middle East and Africa Neurothrombectomy Devices Market Volume Share (%), by Product 2024 & 2032
- Figure 63: Middle East and Africa Neurothrombectomy Devices Market Revenue (Million), by End User 2024 & 2032
- Figure 64: Middle East and Africa Neurothrombectomy Devices Market Volume (K Unit), by End User 2024 & 2032
- Figure 65: Middle East and Africa Neurothrombectomy Devices Market Revenue Share (%), by End User 2024 & 2032
- Figure 66: Middle East and Africa Neurothrombectomy Devices Market Volume Share (%), by End User 2024 & 2032
- Figure 67: Middle East and Africa Neurothrombectomy Devices Market Revenue (Million), by Country 2024 & 2032
- Figure 68: Middle East and Africa Neurothrombectomy Devices Market Volume (K Unit), by Country 2024 & 2032
- Figure 69: Middle East and Africa Neurothrombectomy Devices Market Revenue Share (%), by Country 2024 & 2032
- Figure 70: Middle East and Africa Neurothrombectomy Devices Market Volume Share (%), by Country 2024 & 2032
- Figure 71: South America Neurothrombectomy Devices Market Revenue (Million), by Product 2024 & 2032
- Figure 72: South America Neurothrombectomy Devices Market Volume (K Unit), by Product 2024 & 2032
- Figure 73: South America Neurothrombectomy Devices Market Revenue Share (%), by Product 2024 & 2032
- Figure 74: South America Neurothrombectomy Devices Market Volume Share (%), by Product 2024 & 2032
- Figure 75: South America Neurothrombectomy Devices Market Revenue (Million), by End User 2024 & 2032
- Figure 76: South America Neurothrombectomy Devices Market Volume (K Unit), by End User 2024 & 2032
- Figure 77: South America Neurothrombectomy Devices Market Revenue Share (%), by End User 2024 & 2032
- Figure 78: South America Neurothrombectomy Devices Market Volume Share (%), by End User 2024 & 2032
- Figure 79: South America Neurothrombectomy Devices Market Revenue (Million), by Country 2024 & 2032
- Figure 80: South America Neurothrombectomy Devices Market Volume (K Unit), by Country 2024 & 2032
- Figure 81: South America Neurothrombectomy Devices Market Revenue Share (%), by Country 2024 & 2032
- Figure 82: South America Neurothrombectomy Devices Market Volume Share (%), by Country 2024 & 2032
List of Tables
- Table 1: Global Neurothrombectomy Devices Market Revenue Million Forecast, by Region 2019 & 2032
- Table 2: Global Neurothrombectomy Devices Market Volume K Unit Forecast, by Region 2019 & 2032
- Table 3: Global Neurothrombectomy Devices Market Revenue Million Forecast, by Product 2019 & 2032
- Table 4: Global Neurothrombectomy Devices Market Volume K Unit Forecast, by Product 2019 & 2032
- Table 5: Global Neurothrombectomy Devices Market Revenue Million Forecast, by End User 2019 & 2032
- Table 6: Global Neurothrombectomy Devices Market Volume K Unit Forecast, by End User 2019 & 2032
- Table 7: Global Neurothrombectomy Devices Market Revenue Million Forecast, by Region 2019 & 2032
- Table 8: Global Neurothrombectomy Devices Market Volume K Unit Forecast, by Region 2019 & 2032
- Table 9: Global Neurothrombectomy Devices Market Revenue Million Forecast, by Country 2019 & 2032
- Table 10: Global Neurothrombectomy Devices Market Volume K Unit Forecast, by Country 2019 & 2032
- Table 11: Global Neurothrombectomy Devices Market Revenue Million Forecast, by Country 2019 & 2032
- Table 12: Global Neurothrombectomy Devices Market Volume K Unit Forecast, by Country 2019 & 2032
- Table 13: Global Neurothrombectomy Devices Market Revenue Million Forecast, by Country 2019 & 2032
- Table 14: Global Neurothrombectomy Devices Market Volume K Unit Forecast, by Country 2019 & 2032
- Table 15: Global Neurothrombectomy Devices Market Revenue Million Forecast, by Country 2019 & 2032
- Table 16: Global Neurothrombectomy Devices Market Volume K Unit Forecast, by Country 2019 & 2032
- Table 17: Global Neurothrombectomy Devices Market Revenue Million Forecast, by Country 2019 & 2032
- Table 18: Global Neurothrombectomy Devices Market Volume K Unit Forecast, by Country 2019 & 2032
- Table 19: Global Neurothrombectomy Devices Market Revenue Million Forecast, by Product 2019 & 2032
- Table 20: Global Neurothrombectomy Devices Market Volume K Unit Forecast, by Product 2019 & 2032
- Table 21: Global Neurothrombectomy Devices Market Revenue Million Forecast, by End User 2019 & 2032
- Table 22: Global Neurothrombectomy Devices Market Volume K Unit Forecast, by End User 2019 & 2032
- Table 23: Global Neurothrombectomy Devices Market Revenue Million Forecast, by Country 2019 & 2032
- Table 24: Global Neurothrombectomy Devices Market Volume K Unit Forecast, by Country 2019 & 2032
- Table 25: United States Neurothrombectomy Devices Market Revenue (Million) Forecast, by Application 2019 & 2032
- Table 26: United States Neurothrombectomy Devices Market Volume (K Unit) Forecast, by Application 2019 & 2032
- Table 27: Canada Neurothrombectomy Devices Market Revenue (Million) Forecast, by Application 2019 & 2032
- Table 28: Canada Neurothrombectomy Devices Market Volume (K Unit) Forecast, by Application 2019 & 2032
- Table 29: Mexico Neurothrombectomy Devices Market Revenue (Million) Forecast, by Application 2019 & 2032
- Table 30: Mexico Neurothrombectomy Devices Market Volume (K Unit) Forecast, by Application 2019 & 2032
- Table 31: Global Neurothrombectomy Devices Market Revenue Million Forecast, by Product 2019 & 2032
- Table 32: Global Neurothrombectomy Devices Market Volume K Unit Forecast, by Product 2019 & 2032
- Table 33: Global Neurothrombectomy Devices Market Revenue Million Forecast, by End User 2019 & 2032
- Table 34: Global Neurothrombectomy Devices Market Volume K Unit Forecast, by End User 2019 & 2032
- Table 35: Global Neurothrombectomy Devices Market Revenue Million Forecast, by Country 2019 & 2032
- Table 36: Global Neurothrombectomy Devices Market Volume K Unit Forecast, by Country 2019 & 2032
- Table 37: Germany Neurothrombectomy Devices Market Revenue (Million) Forecast, by Application 2019 & 2032
- Table 38: Germany Neurothrombectomy Devices Market Volume (K Unit) Forecast, by Application 2019 & 2032
- Table 39: United Kingdom Neurothrombectomy Devices Market Revenue (Million) Forecast, by Application 2019 & 2032
- Table 40: United Kingdom Neurothrombectomy Devices Market Volume (K Unit) Forecast, by Application 2019 & 2032
- Table 41: France Neurothrombectomy Devices Market Revenue (Million) Forecast, by Application 2019 & 2032
- Table 42: France Neurothrombectomy Devices Market Volume (K Unit) Forecast, by Application 2019 & 2032
- Table 43: Spain Neurothrombectomy Devices Market Revenue (Million) Forecast, by Application 2019 & 2032
- Table 44: Spain Neurothrombectomy Devices Market Volume (K Unit) Forecast, by Application 2019 & 2032
- Table 45: Italy Neurothrombectomy Devices Market Revenue (Million) Forecast, by Application 2019 & 2032
- Table 46: Italy Neurothrombectomy Devices Market Volume (K Unit) Forecast, by Application 2019 & 2032
- Table 47: Rest of Europe Neurothrombectomy Devices Market Revenue (Million) Forecast, by Application 2019 & 2032
- Table 48: Rest of Europe Neurothrombectomy Devices Market Volume (K Unit) Forecast, by Application 2019 & 2032
- Table 49: Global Neurothrombectomy Devices Market Revenue Million Forecast, by Product 2019 & 2032
- Table 50: Global Neurothrombectomy Devices Market Volume K Unit Forecast, by Product 2019 & 2032
- Table 51: Global Neurothrombectomy Devices Market Revenue Million Forecast, by End User 2019 & 2032
- Table 52: Global Neurothrombectomy Devices Market Volume K Unit Forecast, by End User 2019 & 2032
- Table 53: Global Neurothrombectomy Devices Market Revenue Million Forecast, by Country 2019 & 2032
- Table 54: Global Neurothrombectomy Devices Market Volume K Unit Forecast, by Country 2019 & 2032
- Table 55: China Neurothrombectomy Devices Market Revenue (Million) Forecast, by Application 2019 & 2032
- Table 56: China Neurothrombectomy Devices Market Volume (K Unit) Forecast, by Application 2019 & 2032
- Table 57: Japan Neurothrombectomy Devices Market Revenue (Million) Forecast, by Application 2019 & 2032
- Table 58: Japan Neurothrombectomy Devices Market Volume (K Unit) Forecast, by Application 2019 & 2032
- Table 59: India Neurothrombectomy Devices Market Revenue (Million) Forecast, by Application 2019 & 2032
- Table 60: India Neurothrombectomy Devices Market Volume (K Unit) Forecast, by Application 2019 & 2032
- Table 61: Austalia Neurothrombectomy Devices Market Revenue (Million) Forecast, by Application 2019 & 2032
- Table 62: Austalia Neurothrombectomy Devices Market Volume (K Unit) Forecast, by Application 2019 & 2032
- Table 63: South Korea Neurothrombectomy Devices Market Revenue (Million) Forecast, by Application 2019 & 2032
- Table 64: South Korea Neurothrombectomy Devices Market Volume (K Unit) Forecast, by Application 2019 & 2032
- Table 65: Rest of Asia Pacific Neurothrombectomy Devices Market Revenue (Million) Forecast, by Application 2019 & 2032
- Table 66: Rest of Asia Pacific Neurothrombectomy Devices Market Volume (K Unit) Forecast, by Application 2019 & 2032
- Table 67: Global Neurothrombectomy Devices Market Revenue Million Forecast, by Product 2019 & 2032
- Table 68: Global Neurothrombectomy Devices Market Volume K Unit Forecast, by Product 2019 & 2032
- Table 69: Global Neurothrombectomy Devices Market Revenue Million Forecast, by End User 2019 & 2032
- Table 70: Global Neurothrombectomy Devices Market Volume K Unit Forecast, by End User 2019 & 2032
- Table 71: Global Neurothrombectomy Devices Market Revenue Million Forecast, by Country 2019 & 2032
- Table 72: Global Neurothrombectomy Devices Market Volume K Unit Forecast, by Country 2019 & 2032
- Table 73: GCC Neurothrombectomy Devices Market Revenue (Million) Forecast, by Application 2019 & 2032
- Table 74: GCC Neurothrombectomy Devices Market Volume (K Unit) Forecast, by Application 2019 & 2032
- Table 75: South Africa Neurothrombectomy Devices Market Revenue (Million) Forecast, by Application 2019 & 2032
- Table 76: South Africa Neurothrombectomy Devices Market Volume (K Unit) Forecast, by Application 2019 & 2032
- Table 77: Rest of Middle East and Africa Neurothrombectomy Devices Market Revenue (Million) Forecast, by Application 2019 & 2032
- Table 78: Rest of Middle East and Africa Neurothrombectomy Devices Market Volume (K Unit) Forecast, by Application 2019 & 2032
- Table 79: Global Neurothrombectomy Devices Market Revenue Million Forecast, by Product 2019 & 2032
- Table 80: Global Neurothrombectomy Devices Market Volume K Unit Forecast, by Product 2019 & 2032
- Table 81: Global Neurothrombectomy Devices Market Revenue Million Forecast, by End User 2019 & 2032
- Table 82: Global Neurothrombectomy Devices Market Volume K Unit Forecast, by End User 2019 & 2032
- Table 83: Global Neurothrombectomy Devices Market Revenue Million Forecast, by Country 2019 & 2032
- Table 84: Global Neurothrombectomy Devices Market Volume K Unit Forecast, by Country 2019 & 2032
- Table 85: Brazil Neurothrombectomy Devices Market Revenue (Million) Forecast, by Application 2019 & 2032
- Table 86: Brazil Neurothrombectomy Devices Market Volume (K Unit) Forecast, by Application 2019 & 2032
- Table 87: Argentina Neurothrombectomy Devices Market Revenue (Million) Forecast, by Application 2019 & 2032
- Table 88: Argentina Neurothrombectomy Devices Market Volume (K Unit) Forecast, by Application 2019 & 2032
- Table 89: Rest of South America Neurothrombectomy Devices Market Revenue (Million) Forecast, by Application 2019 & 2032
- Table 90: Rest of South America Neurothrombectomy Devices Market Volume (K Unit) Forecast, by Application 2019 & 2032
Frequently Asked Questions
1. What is the projected Compound Annual Growth Rate (CAGR) of the Neurothrombectomy Devices Market?
The projected CAGR is approximately 6.50%.
2. Which companies are prominent players in the Neurothrombectomy Devices Market?
Key companies in the market include Acandis GmbH, Phenox GmbH, Inari Medical, Medtronic, Terumo Corporation, Abbott Laboratories, Stryker, Edward Lifesciences Corporation, Vesalio, Johnson & Johnson, Argon Medical, Penumbra Inc.
3. What are the main segments of the Neurothrombectomy Devices Market?
The market segments include Product, End User.
4. Can you provide details about the market size?
The market size is estimated to be USD XX Million as of 2022.
5. What are some drivers contributing to market growth?
Increase in Geriatric Population; Increasing Prevalence of Ischemic Strokes.
6. What are the notable trends driving market growth?
The Clot Retrievers Segment is Expected to Hold a Major Share in the Market over the Forecast Period.
7. Are there any restraints impacting market growth?
Risks Associated with Neurothrombectomy Procedure.
8. Can you provide examples of recent developments in the market?
N/A
9. What pricing options are available for accessing the report?
Pricing options include single-user, multi-user, and enterprise licenses priced at USD 4750, USD 5250, and USD 8750 respectively.
10. Is the market size provided in terms of value or volume?
The market size is provided in terms of value, measured in Million and volume, measured in K Unit.
11. Are there any specific market keywords associated with the report?
Yes, the market keyword associated with the report is "Neurothrombectomy Devices Market," which aids in identifying and referencing the specific market segment covered.
12. How do I determine which pricing option suits my needs best?
The pricing options vary based on user requirements and access needs. Individual users may opt for single-user licenses, while businesses requiring broader access may choose multi-user or enterprise licenses for cost-effective access to the report.
13. Are there any additional resources or data provided in the Neurothrombectomy Devices Market report?
While the report offers comprehensive insights, it's advisable to review the specific contents or supplementary materials provided to ascertain if additional resources or data are available.
14. How can I stay updated on further developments or reports in the Neurothrombectomy Devices Market?
To stay informed about further developments, trends, and reports in the Neurothrombectomy Devices Market, consider subscribing to industry newsletters, following relevant companies and organizations, or regularly checking reputable industry news sources and publications.
Methodology
Step 1 - Identification of Relevant Samples Size from Population Database


Step 2 - Approaches for Defining Global Market Size (Value, Volume* & Price*)

Note*: In applicable scenarios
Step 3 - Data Sources
Primary Research
- Web Analytics
- Survey Reports
- Research Institute
- Latest Research Reports
- Opinion Leaders
Secondary Research
- Annual Reports
- White Paper
- Latest Press Release
- Industry Association
- Paid Database
- Investor Presentations

Step 4 - Data Triangulation
Involves using different sources of information in order to increase the validity of a study
These sources are likely to be stakeholders in a program - participants, other researchers, program staff, other community members, and so on.
Then we put all data in single framework & apply various statistical tools to find out the dynamic on the market.
During the analysis stage, feedback from the stakeholder groups would be compared to determine areas of agreement as well as areas of divergence
