

Key Insights
The global market for Nitrogen 15 is experiencing robust expansion, projected to reach a significant valuation in the coming years. Driven by its indispensable applications across crucial sectors like medical diagnostics, advanced biomedical research, and agricultural innovation, the market is poised for sustained growth. The increasing demand for precise isotopic labeling in drug discovery, metabolic studies, and plant physiology research underpins this upward trajectory. Furthermore, advancements in analytical techniques and the growing adoption of stable isotopes for non-radioactive tracing are fueling market penetration. Emerging applications in areas such as environmental monitoring and materials science are also contributing to market dynamism. The market's inherent value lies in its ability to provide unparalleled accuracy and sensitivity in scientific investigations, making it a cornerstone for cutting-edge research and development.
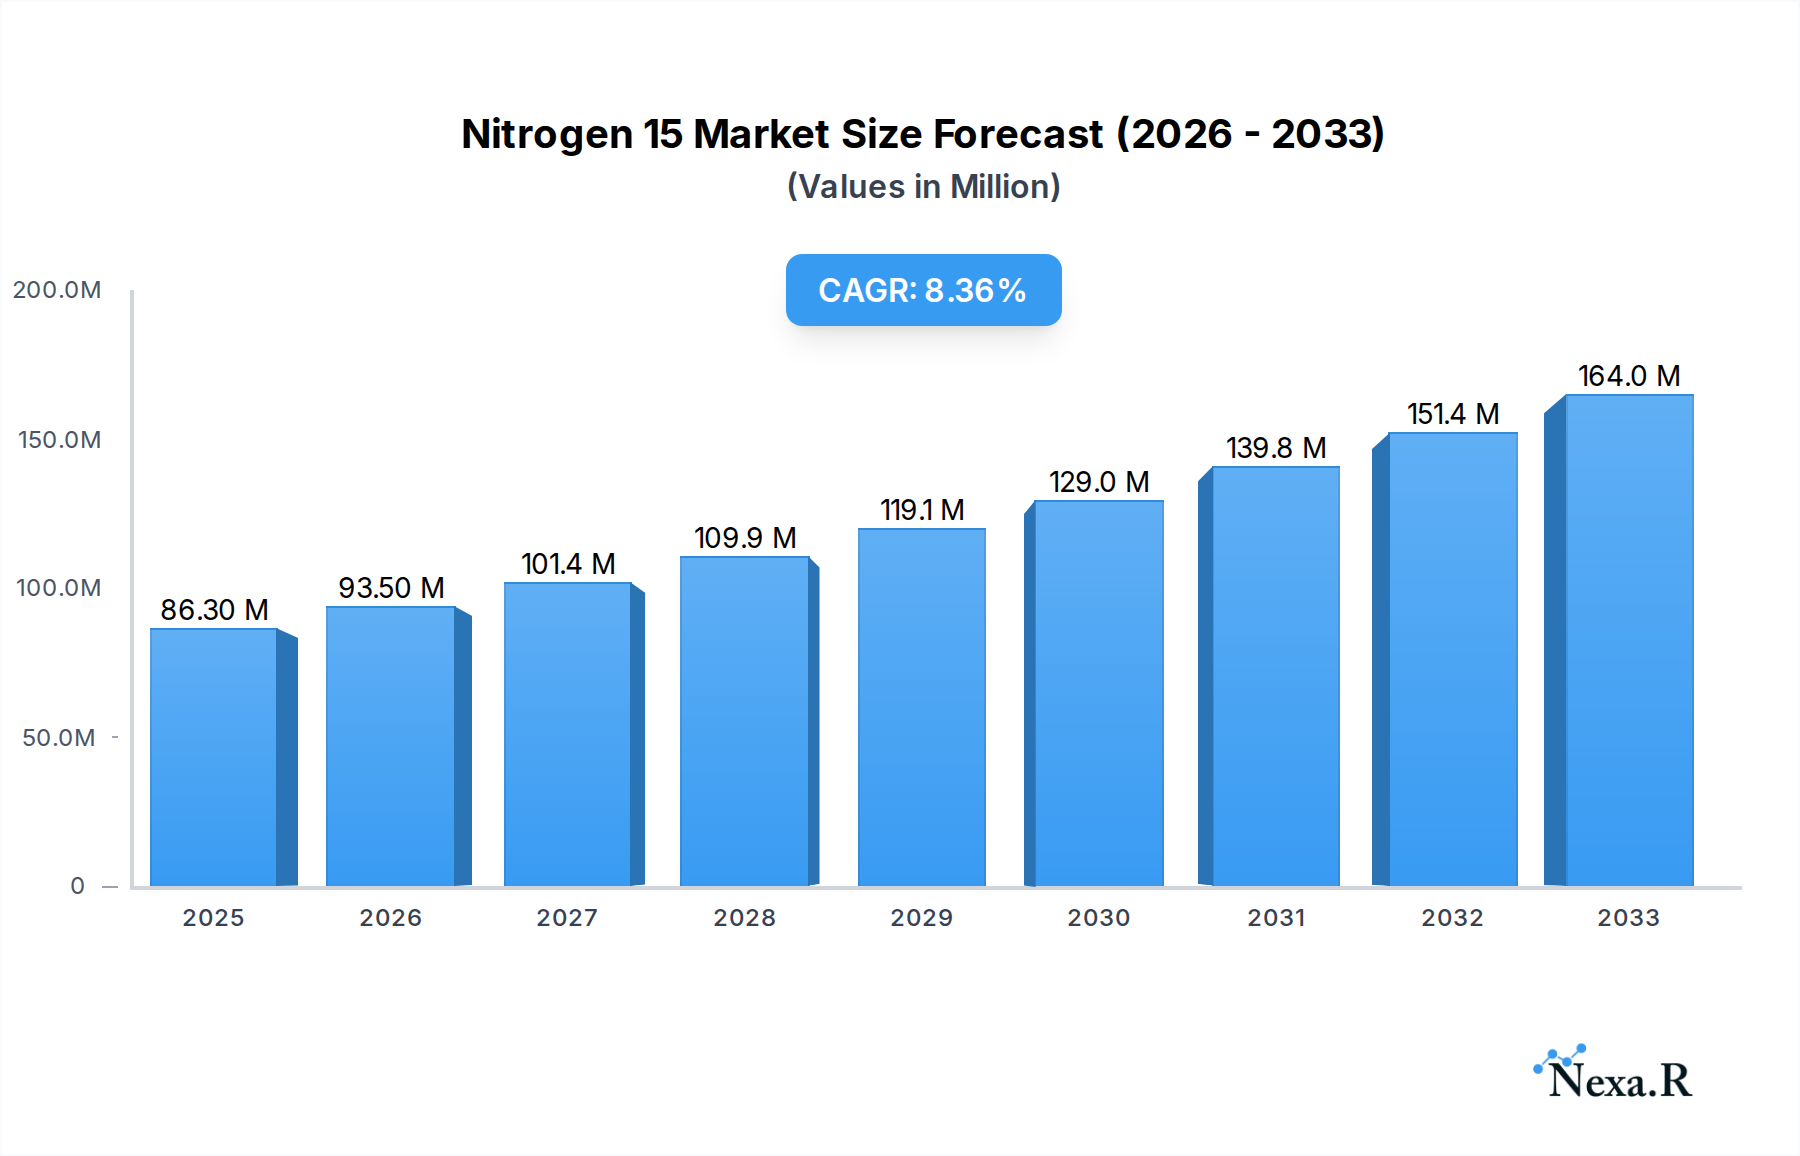
Nitrogen 15 Market Size (In Million)
The market is projected to witness a Compound Annual Growth Rate (CAGR) of 8.4%, with an estimated market size of 86.3 million in the base year 2025. This impressive growth is further propelled by key industry trends such as the increasing focus on personalized medicine, the development of novel diagnostic tools, and the ongoing quest for sustainable agricultural practices. Companies like Cambridge Isotope Laboratories, CPI Georgia, and Trace Sciences are at the forefront of innovation, developing high-purity Nitrogen 15 compounds and expanding production capacities to meet escalating global demand. While the market demonstrates significant potential, certain restraints such as the high cost of production and purification processes, along with the need for specialized handling and expertise, warrant strategic consideration. However, the overarching benefits of using Nitrogen 15 in enhancing research precision and enabling groundbreaking discoveries are expected to outweigh these challenges, solidifying its critical role in scientific advancement.

Nitrogen 15 Company Market Share
This in-depth report provides a definitive analysis of the global Nitrogen 15 market, offering critical insights into its current dynamics, historical performance, and future trajectory. Covering the period from 2019 to 2033, with a base year of 2025, this report is an indispensable resource for stakeholders seeking to understand market concentration, technological innovation drivers, regulatory frameworks, competitive product substitutes, end-user demographics, and M&A trends. We delve into the market size evolution, adoption rates, technological disruptions, and consumer behavior shifts, presenting quantitative metrics and qualitative factors that shape this vital isotopic market.
Nitrogen 15 Market Dynamics & Structure
The Nitrogen 15 market is characterized by a moderately concentrated landscape, with key players investing heavily in research and development to enhance production efficiency and product purity. Technological innovation is primarily driven by advancements in isotope separation techniques and the increasing demand for highly enriched Nitrogen 15 isotopes in sophisticated analytical and diagnostic applications. Regulatory frameworks, particularly in the medical and pharmaceutical sectors, necessitate stringent quality control and adherence to international standards, impacting production processes and market entry barriers.
- Market Concentration: Leading companies hold a significant market share, but emerging players are increasingly contributing to market diversification.
- Technological Innovation Drivers: Improvements in gas centrifuges, electromagnetic isotope separation, and laser isotope separation are key to increased yield and purity.
- Regulatory Frameworks: FDA, EMA, and other regional health authorities impose strict guidelines for isotopes used in medical applications.
- Competitive Product Substitutes: While direct substitutes for specific isotopic applications are limited, alternative analytical methodologies can sometimes reduce the reliance on Nitrogen 15.
- End-User Demographics: The primary end-users are research institutions, pharmaceutical companies, and agricultural science facilities.
- M&A Trends: Strategic acquisitions and collaborations are observed as companies aim to expand their product portfolios and geographical reach, with an estimated 15-20 M&A deals occurring within the historical period, enhancing market consolidation and technological synergy.
Nitrogen 15 Growth Trends & Insights
The global Nitrogen 15 market is poised for robust expansion, driven by its indispensable role in scientific advancement and its growing applications across diverse industries. The market size evolution is projected to witness a Compound Annual Growth Rate (CAGR) of approximately 6.5% from 2025 to 2033, expanding from an estimated $XXX million in 2025 to $YYY million by 2033. This sustained growth is underpinned by increasing adoption rates in advanced research methodologies and the continuous development of novel applications. Technological disruptions, such as the refinement of mass spectrometry techniques and the development of advanced tracer studies, are further fueling demand.
Consumer behavior shifts, particularly within the biomedical science segment, indicate a growing preference for stable isotopes like Nitrogen 15 for their non-radioactive nature and precision in tracing metabolic pathways and drug efficacy. The agricultural research sector is also witnessing heightened interest in Nitrogen 15 for optimizing fertilizer use efficiency and understanding plant nutrient uptake. The parent market, encompassing all stable isotopes, provides a broader context, and the Nitrogen 15 segment represents a significant and growing child market within this larger domain. The market penetration for Nitrogen 15 in specialized research applications is already high, but opportunities for expansion into more routine diagnostic and industrial processes are emerging. Understanding these evolving trends is crucial for identifying untapped potential and strategic investment opportunities. The estimated market value for Nitrogen 15 in the base year of 2025 is $ZZZ million.
Dominant Regions, Countries, or Segments in Nitrogen 15
The Medical application segment is currently the dominant force driving growth in the global Nitrogen 15 market, accounting for an estimated 45% of the total market share in 2025. This dominance is propelled by the critical role of Nitrogen 15 in advanced diagnostic imaging, metabolic studies, and the development of targeted therapies. The Biomedical Science segment follows closely, representing approximately 35% of the market, where Nitrogen 15 is extensively used in proteomics, metabolomics, and drug discovery research due to its stable and traceable nature.
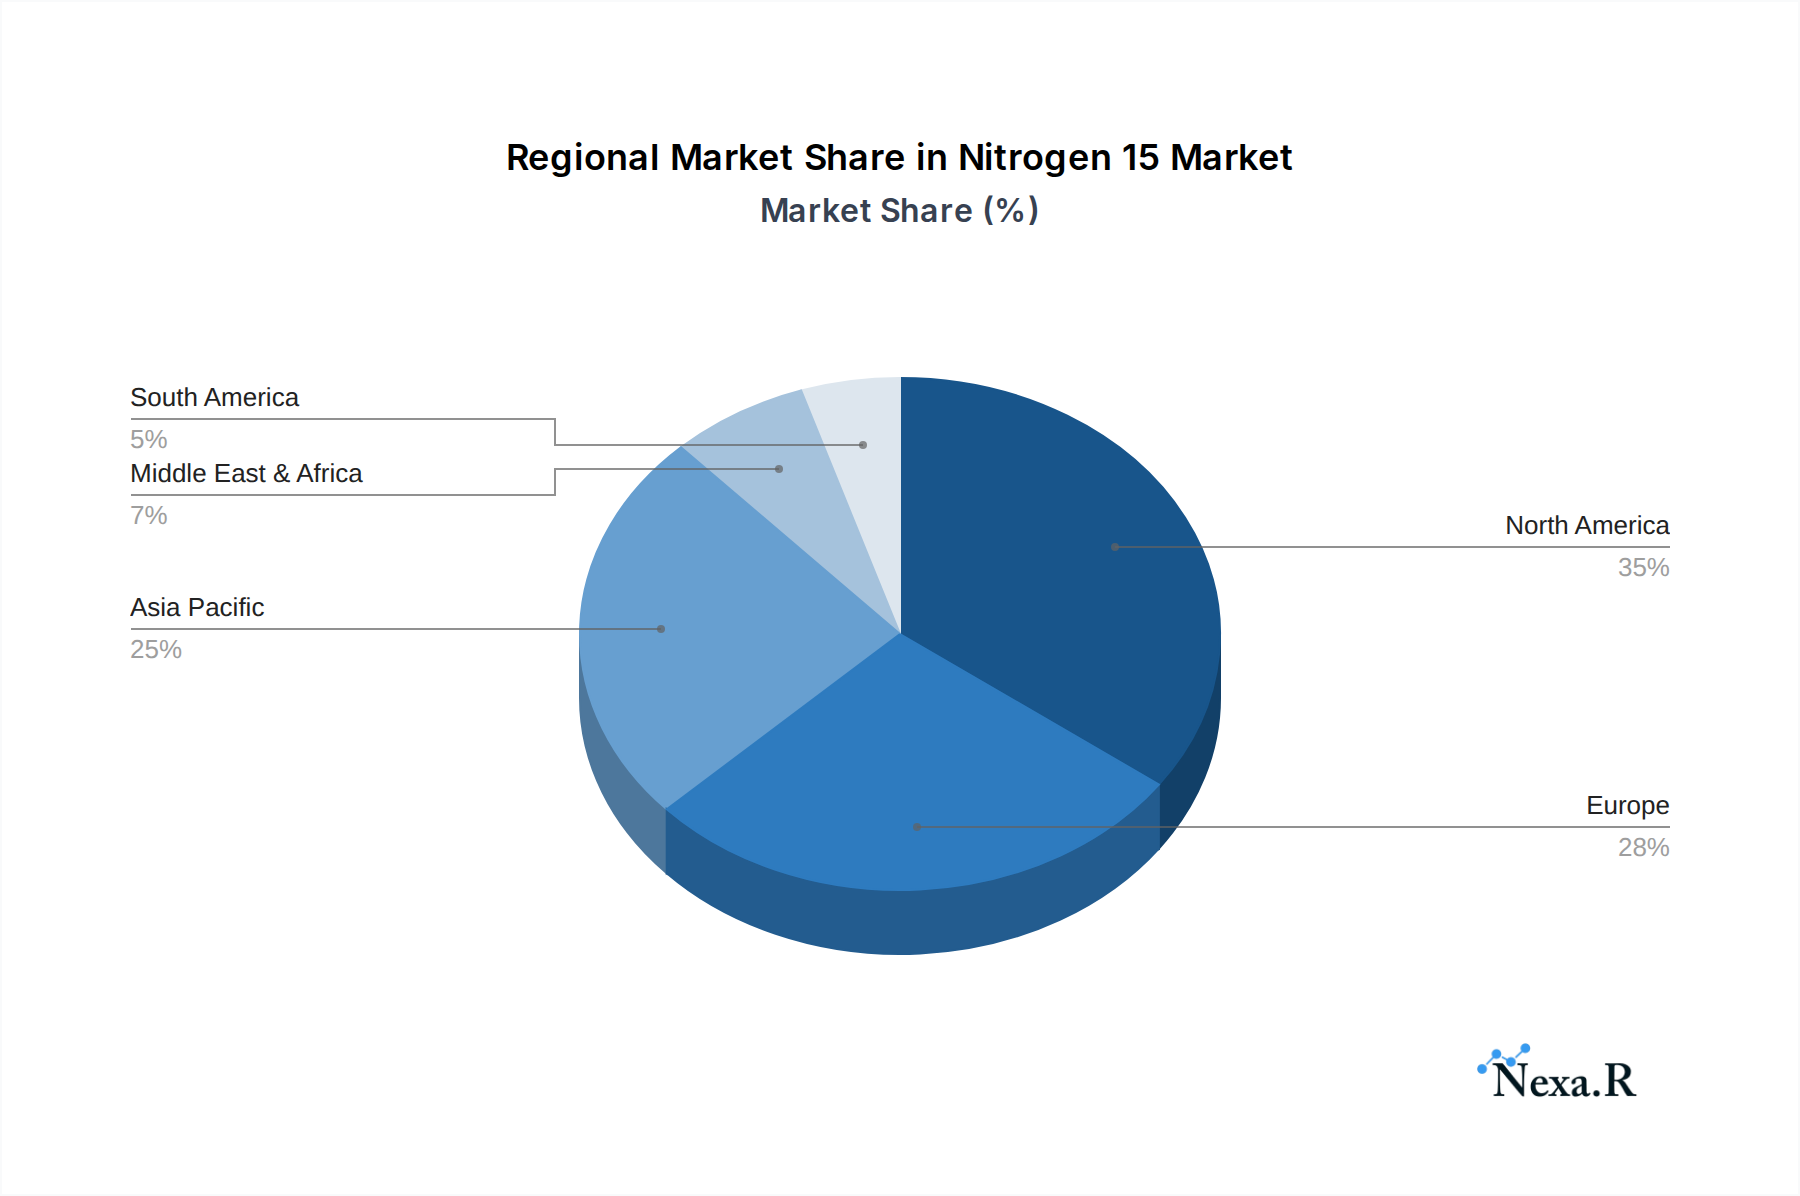
North America, particularly the United States, stands as the leading region, contributing an estimated 40% to the global market revenue in 2025. This leadership is attributed to its strong research infrastructure, substantial government funding for scientific research, and a well-established pharmaceutical and biotechnology industry. Europe follows as the second-largest market, with Germany and the United Kingdom being key contributors, driven by advanced healthcare systems and robust academic research institutions.
Within the Type segmentation, 0.99 atom % enrichment is the most sought-after category, representing an estimated 60% of the market demand in 2025, due to its high purity requirements for sensitive analytical applications. The 0.98 atom % enrichment segment accounts for roughly 25%, catering to applications where slightly lower enrichment is acceptable and cost-effectiveness is a priority. The Others (including higher enrichments and specialized blends) category makes up the remaining 15%.
Key drivers of dominance in these regions and segments include:
- Economic Policies: Favorable government funding for R&D and healthcare initiatives.
- Infrastructure: Advanced research facilities, including leading universities and specialized research centers.
- Industry Developments: A high concentration of pharmaceutical, biotechnology, and agricultural science companies actively utilizing Nitrogen 15.
- Market Share & Growth Potential: The increasing demand for precision medicine and personalized therapies in the Medical segment ensures continued high growth potential.
Nitrogen 15 Product Landscape
The Nitrogen 15 product landscape is defined by its high purity and specific isotopic enrichment levels, catering to niche but critical applications. Innovations focus on enhancing the precision and reliability of Nitrogen 15-labeled compounds used as tracers in biological and chemical processes. Key applications include medical diagnostics for disease detection, biomedical research for understanding metabolic pathways and drug metabolism, and agricultural science for tracking nutrient uptake and fertilizer efficiency. The unique selling proposition of Nitrogen 15 lies in its stability and non-radioactive nature, making it a safe and effective alternative to radioactive isotopes for numerous studies. Technological advancements are continuously improving the synthesis and purification of complex molecules enriched with Nitrogen 15.
Key Drivers, Barriers & Challenges in Nitrogen 15
Key Drivers:
- Increasing demand in medical diagnostics and research: The need for precise metabolic tracing and disease marker identification.
- Advancements in analytical techniques: Higher sensitivity of mass spectrometry and NMR spectroscopy drives demand for enriched isotopes.
- Growth in the pharmaceutical and biotechnology sectors: New drug development and clinical trials heavily rely on isotopic labeling.
- Expansion of agricultural research: Optimizing crop yields and understanding soil-plant nutrient dynamics.
- Technological breakthroughs in isotope separation: Leading to more efficient and cost-effective production.
Barriers & Challenges:
- High production costs: The complex and energy-intensive process of isotope enrichment leads to significant manufacturing expenses, estimated to add 20-30% to the final product cost compared to natural abundance isotopes.
- Stringent regulatory approvals: Especially for medical applications, requiring extensive validation and compliance.
- Limited number of manufacturers: The specialized nature of production restricts the competitive landscape.
- Supply chain vulnerabilities: Reliance on specific raw materials and manufacturing expertise.
- Competition from alternative analytical methods: While not direct substitutes, some methods can reduce the need for isotopic labeling in certain research areas.
- Global economic uncertainties: Can impact R&D budgets and investment in specialized research tools.
Emerging Opportunities in Nitrogen 15
Emerging opportunities in the Nitrogen 15 market lie in the development of novel diagnostic kits for early disease detection, particularly in oncology and neurology. The increasing adoption of precision agriculture presents a significant avenue for Nitrogen 15-labeled fertilizers and soil amendments to optimize nutrient management for enhanced crop yields and sustainability. Furthermore, exploring its application in environmental science for tracing pollutants and understanding biogeochemical cycles offers untapped market potential. The growing field of personalized medicine will also drive demand for highly specific Nitrogen 15-labeled compounds for individual patient treatment monitoring and drug response analysis.
Growth Accelerators in the Nitrogen 15 Industry
Long-term growth in the Nitrogen 15 industry is being significantly accelerated by strategic partnerships between isotope manufacturers and leading research institutions and pharmaceutical companies. These collaborations foster the development of new applications and streamline the adoption of Nitrogen 15 in emerging research fields. Technological breakthroughs in laser-based isotope separation are promising to reduce production costs and increase purity, making Nitrogen 15 more accessible. Furthermore, market expansion strategies focusing on emerging economies with growing healthcare and agricultural sectors are set to drive sustained demand and market penetration for Nitrogen 15 products.
Key Players Shaping the Nitrogen 15 Market
- Cambridge Isotope Laboratories
- CPI Georgia
- Trace Sciences
- Omicron Biochemicals
- WITEGA Laboratorien
- LGC Standards
- Shanghai Research Institute of Chemical Industry Co., Ltd.
- Wuhan Isotope Technology Co., Ltd.
Notable Milestones in Nitrogen 15 Sector
- 2019: Significant advancements in laser isotope separation technology reported, promising higher efficiency and lower costs for Nitrogen 15 production.
- 2020: Increased demand for Nitrogen 15 in COVID-19 related biomedical research, particularly for understanding viral protein synthesis and host-pathogen interactions.
- 2021: Launch of new Nitrogen 15-labeled amino acids and metabolic substrates for advanced proteomics studies.
- 2022: Growing adoption of Nitrogen 15 in precision agriculture pilot programs for enhanced nutrient management studies.
- 2023: Several mergers and acquisitions within the isotope market aimed at consolidating production capabilities and expanding product portfolios, impacting market structure.
- 2024: Continued investment in R&D for improving the synthesis of complex Nitrogen 15-labeled molecules for drug discovery.
In-Depth Nitrogen 15 Market Outlook
The future outlook for the Nitrogen 15 market is exceptionally promising, fueled by its entrenched role in scientific discovery and its expanding utility across critical sectors. Growth accelerators, including ongoing technological innovations in isotope separation and the continuous evolution of analytical techniques, will ensure improved accessibility and a broader application spectrum. Strategic partnerships between key market players and research powerhouses will further catalyze the development of novel applications, particularly in areas like personalized medicine and advanced environmental monitoring. The increasing global emphasis on sustainable agricultural practices will also provide a significant growth impetus. The market is well-positioned for sustained expansion, offering substantial opportunities for innovation and investment in the coming years.
Nitrogen 15 Segmentation
-
1. Application
- 1.1. Medical
- 1.2. Biomedical Science
- 1.3. Agricultural Research
- 1.4. Others
-
2. Type
- 2.1. 0.99
- 2.2. 0.98
- 2.3. Others
Nitrogen 15 Segmentation By Geography
-
1. North America
- 1.1. United States
- 1.2. Canada
- 1.3. Mexico
-
2. South America
- 2.1. Brazil
- 2.2. Argentina
- 2.3. Rest of South America
-
3. Europe
- 3.1. United Kingdom
- 3.2. Germany
- 3.3. France
- 3.4. Italy
- 3.5. Spain
- 3.6. Russia
- 3.7. Benelux
- 3.8. Nordics
- 3.9. Rest of Europe
-
4. Middle East & Africa
- 4.1. Turkey
- 4.2. Israel
- 4.3. GCC
- 4.4. North Africa
- 4.5. South Africa
- 4.6. Rest of Middle East & Africa
-
5. Asia Pacific
- 5.1. China
- 5.2. India
- 5.3. Japan
- 5.4. South Korea
- 5.5. ASEAN
- 5.6. Oceania
- 5.7. Rest of Asia Pacific
Nitrogen 15 Regional Market Share
Geographic Coverage of Nitrogen 15
Nitrogen 15 REPORT HIGHLIGHTS
| Aspects | Details |
|---|---|
| Study Period | 2020-2034 |
| Base Year | 2025 |
| Estimated Year | 2026 |
| Forecast Period | 2026-2034 |
| Historical Period | 2020-2025 |
| Growth Rate | CAGR of 8.4% from 2020-2034 |
| Segmentation |
|
Table of Contents
- 1. Introduction
- 1.1. Research Scope
- 1.2. Market Segmentation
- 1.3. Research Objective
- 1.4. Definitions and Assumptions
- 2. Executive Summary
- 2.1. Market Snapshot
- 3. Market Dynamics
- 3.1. Market Drivers
- 3.2. Market Restrains
- 3.3. Market Trends
- 3.4. Market Opportunities
- 4. Market Factor Analysis
- 4.1. Porters Five Forces
- 4.1.1. Bargaining Power of Suppliers
- 4.1.2. Bargaining Power of Buyers
- 4.1.3. Threat of New Entrants
- 4.1.4. Threat of Substitutes
- 4.1.5. Competitive Rivalry
- 4.2. PESTEL analysis
- 4.3. BCG Analysis
- 4.3.1. Stars (High Growth, High Market Share)
- 4.3.2. Cash Cows (Low Growth, High Market Share)
- 4.3.3. Question Mark (High Growth, Low Market Share)
- 4.3.4. Dogs (Low Growth, Low Market Share)
- 4.4. Ansoff Matrix Analysis
- 4.5. Supply Chain Analysis
- 4.6. Regulatory Landscape
- 4.7. Current Market Potential and Opportunity Assessment (TAM–SAM–SOM Framework)
- 4.8. NRP Analyst Note
- 4.1. Porters Five Forces
- 5. Market Analysis, Insights and Forecast 2021-2033
- 5.1. Market Analysis, Insights and Forecast - by Application
- 5.1.1. Medical
- 5.1.2. Biomedical Science
- 5.1.3. Agricultural Research
- 5.1.4. Others
- 5.2. Market Analysis, Insights and Forecast - by Type
- 5.2.1. 0.99
- 5.2.2. 0.98
- 5.2.3. Others
- 5.3. Market Analysis, Insights and Forecast - by Region
- 5.3.1. North America
- 5.3.2. South America
- 5.3.3. Europe
- 5.3.4. Middle East & Africa
- 5.3.5. Asia Pacific
- 5.1. Market Analysis, Insights and Forecast - by Application
- 6. Global Nitrogen 15 Analysis, Insights and Forecast, 2021-2033
- 6.1. Market Analysis, Insights and Forecast - by Application
- 6.1.1. Medical
- 6.1.2. Biomedical Science
- 6.1.3. Agricultural Research
- 6.1.4. Others
- 6.2. Market Analysis, Insights and Forecast - by Type
- 6.2.1. 0.99
- 6.2.2. 0.98
- 6.2.3. Others
- 6.1. Market Analysis, Insights and Forecast - by Application
- 7. North America Nitrogen 15 Analysis, Insights and Forecast, 2020-2032
- 7.1. Market Analysis, Insights and Forecast - by Application
- 7.1.1. Medical
- 7.1.2. Biomedical Science
- 7.1.3. Agricultural Research
- 7.1.4. Others
- 7.2. Market Analysis, Insights and Forecast - by Type
- 7.2.1. 0.99
- 7.2.2. 0.98
- 7.2.3. Others
- 7.1. Market Analysis, Insights and Forecast - by Application
- 8. South America Nitrogen 15 Analysis, Insights and Forecast, 2020-2032
- 8.1. Market Analysis, Insights and Forecast - by Application
- 8.1.1. Medical
- 8.1.2. Biomedical Science
- 8.1.3. Agricultural Research
- 8.1.4. Others
- 8.2. Market Analysis, Insights and Forecast - by Type
- 8.2.1. 0.99
- 8.2.2. 0.98
- 8.2.3. Others
- 8.1. Market Analysis, Insights and Forecast - by Application
- 9. Europe Nitrogen 15 Analysis, Insights and Forecast, 2020-2032
- 9.1. Market Analysis, Insights and Forecast - by Application
- 9.1.1. Medical
- 9.1.2. Biomedical Science
- 9.1.3. Agricultural Research
- 9.1.4. Others
- 9.2. Market Analysis, Insights and Forecast - by Type
- 9.2.1. 0.99
- 9.2.2. 0.98
- 9.2.3. Others
- 9.1. Market Analysis, Insights and Forecast - by Application
- 10. Middle East & Africa Nitrogen 15 Analysis, Insights and Forecast, 2020-2032
- 10.1. Market Analysis, Insights and Forecast - by Application
- 10.1.1. Medical
- 10.1.2. Biomedical Science
- 10.1.3. Agricultural Research
- 10.1.4. Others
- 10.2. Market Analysis, Insights and Forecast - by Type
- 10.2.1. 0.99
- 10.2.2. 0.98
- 10.2.3. Others
- 10.1. Market Analysis, Insights and Forecast - by Application
- 11. Asia Pacific Nitrogen 15 Analysis, Insights and Forecast, 2020-2032
- 11.1. Market Analysis, Insights and Forecast - by Application
- 11.1.1. Medical
- 11.1.2. Biomedical Science
- 11.1.3. Agricultural Research
- 11.1.4. Others
- 11.2. Market Analysis, Insights and Forecast - by Type
- 11.2.1. 0.99
- 11.2.2. 0.98
- 11.2.3. Others
- 11.1. Market Analysis, Insights and Forecast - by Application
- 12. Competitive Analysis
- 12.1. Company Profiles
- 12.1.1 CPI Georgia
- 12.1.1.1. Company Overview
- 12.1.1.2. Products
- 12.1.1.3. Company Financials
- 12.1.1.4. SWOT Analysis
- 12.1.2 Trace Sciences
- 12.1.2.1. Company Overview
- 12.1.2.2. Products
- 12.1.2.3. Company Financials
- 12.1.2.4. SWOT Analysis
- 12.1.3 Cambridge Isotope Laboratories
- 12.1.3.1. Company Overview
- 12.1.3.2. Products
- 12.1.3.3. Company Financials
- 12.1.3.4. SWOT Analysis
- 12.1.4 Omicron Biochemicals
- 12.1.4.1. Company Overview
- 12.1.4.2. Products
- 12.1.4.3. Company Financials
- 12.1.4.4. SWOT Analysis
- 12.1.5 WITEGA Laboratorien
- 12.1.5.1. Company Overview
- 12.1.5.2. Products
- 12.1.5.3. Company Financials
- 12.1.5.4. SWOT Analysis
- 12.1.6 LGC Standards
- 12.1.6.1. Company Overview
- 12.1.6.2. Products
- 12.1.6.3. Company Financials
- 12.1.6.4. SWOT Analysis
- 12.1.7 Shanghai Research Institute of Chemical Industry Co. Ltd.
- 12.1.7.1. Company Overview
- 12.1.7.2. Products
- 12.1.7.3. Company Financials
- 12.1.7.4. SWOT Analysis
- 12.1.8 Wuhan Isotope Technology Co. Ltd.
- 12.1.8.1. Company Overview
- 12.1.8.2. Products
- 12.1.8.3. Company Financials
- 12.1.8.4. SWOT Analysis
- 12.1.1 CPI Georgia
- 12.2. Market Entropy
- 12.2.1 Company's Key Areas Served
- 12.2.2 Recent Developments
- 12.3. Company Market Share Analysis 2025
- 12.3.1 Top 5 Companies Market Share Analysis
- 12.3.2 Top 3 Companies Market Share Analysis
- 12.4. List of Potential Customers
- 13. Research Methodology
List of Figures
- Figure 1: Global Nitrogen 15 Revenue Breakdown (million, %) by Region 2025 & 2033
- Figure 2: North America Nitrogen 15 Revenue (million), by Application 2025 & 2033
- Figure 3: North America Nitrogen 15 Revenue Share (%), by Application 2025 & 2033
- Figure 4: North America Nitrogen 15 Revenue (million), by Type 2025 & 2033
- Figure 5: North America Nitrogen 15 Revenue Share (%), by Type 2025 & 2033
- Figure 6: North America Nitrogen 15 Revenue (million), by Country 2025 & 2033
- Figure 7: North America Nitrogen 15 Revenue Share (%), by Country 2025 & 2033
- Figure 8: South America Nitrogen 15 Revenue (million), by Application 2025 & 2033
- Figure 9: South America Nitrogen 15 Revenue Share (%), by Application 2025 & 2033
- Figure 10: South America Nitrogen 15 Revenue (million), by Type 2025 & 2033
- Figure 11: South America Nitrogen 15 Revenue Share (%), by Type 2025 & 2033
- Figure 12: South America Nitrogen 15 Revenue (million), by Country 2025 & 2033
- Figure 13: South America Nitrogen 15 Revenue Share (%), by Country 2025 & 2033
- Figure 14: Europe Nitrogen 15 Revenue (million), by Application 2025 & 2033
- Figure 15: Europe Nitrogen 15 Revenue Share (%), by Application 2025 & 2033
- Figure 16: Europe Nitrogen 15 Revenue (million), by Type 2025 & 2033
- Figure 17: Europe Nitrogen 15 Revenue Share (%), by Type 2025 & 2033
- Figure 18: Europe Nitrogen 15 Revenue (million), by Country 2025 & 2033
- Figure 19: Europe Nitrogen 15 Revenue Share (%), by Country 2025 & 2033
- Figure 20: Middle East & Africa Nitrogen 15 Revenue (million), by Application 2025 & 2033
- Figure 21: Middle East & Africa Nitrogen 15 Revenue Share (%), by Application 2025 & 2033
- Figure 22: Middle East & Africa Nitrogen 15 Revenue (million), by Type 2025 & 2033
- Figure 23: Middle East & Africa Nitrogen 15 Revenue Share (%), by Type 2025 & 2033
- Figure 24: Middle East & Africa Nitrogen 15 Revenue (million), by Country 2025 & 2033
- Figure 25: Middle East & Africa Nitrogen 15 Revenue Share (%), by Country 2025 & 2033
- Figure 26: Asia Pacific Nitrogen 15 Revenue (million), by Application 2025 & 2033
- Figure 27: Asia Pacific Nitrogen 15 Revenue Share (%), by Application 2025 & 2033
- Figure 28: Asia Pacific Nitrogen 15 Revenue (million), by Type 2025 & 2033
- Figure 29: Asia Pacific Nitrogen 15 Revenue Share (%), by Type 2025 & 2033
- Figure 30: Asia Pacific Nitrogen 15 Revenue (million), by Country 2025 & 2033
- Figure 31: Asia Pacific Nitrogen 15 Revenue Share (%), by Country 2025 & 2033
List of Tables
- Table 1: Global Nitrogen 15 Revenue million Forecast, by Application 2020 & 2033
- Table 2: Global Nitrogen 15 Revenue million Forecast, by Type 2020 & 2033
- Table 3: Global Nitrogen 15 Revenue million Forecast, by Region 2020 & 2033
- Table 4: Global Nitrogen 15 Revenue million Forecast, by Application 2020 & 2033
- Table 5: Global Nitrogen 15 Revenue million Forecast, by Type 2020 & 2033
- Table 6: Global Nitrogen 15 Revenue million Forecast, by Country 2020 & 2033
- Table 7: United States Nitrogen 15 Revenue (million) Forecast, by Application 2020 & 2033
- Table 8: Canada Nitrogen 15 Revenue (million) Forecast, by Application 2020 & 2033
- Table 9: Mexico Nitrogen 15 Revenue (million) Forecast, by Application 2020 & 2033
- Table 10: Global Nitrogen 15 Revenue million Forecast, by Application 2020 & 2033
- Table 11: Global Nitrogen 15 Revenue million Forecast, by Type 2020 & 2033
- Table 12: Global Nitrogen 15 Revenue million Forecast, by Country 2020 & 2033
- Table 13: Brazil Nitrogen 15 Revenue (million) Forecast, by Application 2020 & 2033
- Table 14: Argentina Nitrogen 15 Revenue (million) Forecast, by Application 2020 & 2033
- Table 15: Rest of South America Nitrogen 15 Revenue (million) Forecast, by Application 2020 & 2033
- Table 16: Global Nitrogen 15 Revenue million Forecast, by Application 2020 & 2033
- Table 17: Global Nitrogen 15 Revenue million Forecast, by Type 2020 & 2033
- Table 18: Global Nitrogen 15 Revenue million Forecast, by Country 2020 & 2033
- Table 19: United Kingdom Nitrogen 15 Revenue (million) Forecast, by Application 2020 & 2033
- Table 20: Germany Nitrogen 15 Revenue (million) Forecast, by Application 2020 & 2033
- Table 21: France Nitrogen 15 Revenue (million) Forecast, by Application 2020 & 2033
- Table 22: Italy Nitrogen 15 Revenue (million) Forecast, by Application 2020 & 2033
- Table 23: Spain Nitrogen 15 Revenue (million) Forecast, by Application 2020 & 2033
- Table 24: Russia Nitrogen 15 Revenue (million) Forecast, by Application 2020 & 2033
- Table 25: Benelux Nitrogen 15 Revenue (million) Forecast, by Application 2020 & 2033
- Table 26: Nordics Nitrogen 15 Revenue (million) Forecast, by Application 2020 & 2033
- Table 27: Rest of Europe Nitrogen 15 Revenue (million) Forecast, by Application 2020 & 2033
- Table 28: Global Nitrogen 15 Revenue million Forecast, by Application 2020 & 2033
- Table 29: Global Nitrogen 15 Revenue million Forecast, by Type 2020 & 2033
- Table 30: Global Nitrogen 15 Revenue million Forecast, by Country 2020 & 2033
- Table 31: Turkey Nitrogen 15 Revenue (million) Forecast, by Application 2020 & 2033
- Table 32: Israel Nitrogen 15 Revenue (million) Forecast, by Application 2020 & 2033
- Table 33: GCC Nitrogen 15 Revenue (million) Forecast, by Application 2020 & 2033
- Table 34: North Africa Nitrogen 15 Revenue (million) Forecast, by Application 2020 & 2033
- Table 35: South Africa Nitrogen 15 Revenue (million) Forecast, by Application 2020 & 2033
- Table 36: Rest of Middle East & Africa Nitrogen 15 Revenue (million) Forecast, by Application 2020 & 2033
- Table 37: Global Nitrogen 15 Revenue million Forecast, by Application 2020 & 2033
- Table 38: Global Nitrogen 15 Revenue million Forecast, by Type 2020 & 2033
- Table 39: Global Nitrogen 15 Revenue million Forecast, by Country 2020 & 2033
- Table 40: China Nitrogen 15 Revenue (million) Forecast, by Application 2020 & 2033
- Table 41: India Nitrogen 15 Revenue (million) Forecast, by Application 2020 & 2033
- Table 42: Japan Nitrogen 15 Revenue (million) Forecast, by Application 2020 & 2033
- Table 43: South Korea Nitrogen 15 Revenue (million) Forecast, by Application 2020 & 2033
- Table 44: ASEAN Nitrogen 15 Revenue (million) Forecast, by Application 2020 & 2033
- Table 45: Oceania Nitrogen 15 Revenue (million) Forecast, by Application 2020 & 2033
- Table 46: Rest of Asia Pacific Nitrogen 15 Revenue (million) Forecast, by Application 2020 & 2033
Frequently Asked Questions
1. What is the projected Compound Annual Growth Rate (CAGR) of the Nitrogen 15?
The projected CAGR is approximately 8.4%.
2. Which companies are prominent players in the Nitrogen 15?
Key companies in the market include CPI Georgia, Trace Sciences, Cambridge Isotope Laboratories, Omicron Biochemicals, WITEGA Laboratorien, LGC Standards, Shanghai Research Institute of Chemical Industry Co., Ltd., Wuhan Isotope Technology Co., Ltd..
3. What are the main segments of the Nitrogen 15?
The market segments include Application, Type.
4. Can you provide details about the market size?
The market size is estimated to be USD 86.3 million as of 2022.
5. What are some drivers contributing to market growth?
N/A
6. What are the notable trends driving market growth?
N/A
7. Are there any restraints impacting market growth?
N/A
8. Can you provide examples of recent developments in the market?
N/A
9. What pricing options are available for accessing the report?
Pricing options include single-user, multi-user, and enterprise licenses priced at USD 2900.00, USD 4350.00, and USD 5800.00 respectively.
10. Is the market size provided in terms of value or volume?
The market size is provided in terms of value, measured in million.
11. Are there any specific market keywords associated with the report?
Yes, the market keyword associated with the report is "Nitrogen 15," which aids in identifying and referencing the specific market segment covered.
12. How do I determine which pricing option suits my needs best?
The pricing options vary based on user requirements and access needs. Individual users may opt for single-user licenses, while businesses requiring broader access may choose multi-user or enterprise licenses for cost-effective access to the report.
13. Are there any additional resources or data provided in the Nitrogen 15 report?
While the report offers comprehensive insights, it's advisable to review the specific contents or supplementary materials provided to ascertain if additional resources or data are available.
14. How can I stay updated on further developments or reports in the Nitrogen 15?
To stay informed about further developments, trends, and reports in the Nitrogen 15, consider subscribing to industry newsletters, following relevant companies and organizations, or regularly checking reputable industry news sources and publications.
Methodology
Step 1 - Identification of Relevant Samples Size from Population Database


Step 2 - Approaches for Defining Global Market Size (Value, Volume* & Price*)

Note*: In applicable scenarios
Step 3 - Data Sources
Primary Research
- Web Analytics
- Survey Reports
- Research Institute
- Latest Research Reports
- Opinion Leaders
Secondary Research
- Annual Reports
- White Paper
- Latest Press Release
- Industry Association
- Paid Database
- Investor Presentations

Step 4 - Data Triangulation
Involves using different sources of information in order to increase the validity of a study
These sources are likely to be stakeholders in a program - participants, other researchers, program staff, other community members, and so on.
Then we put all data in single framework & apply various statistical tools to find out the dynamic on the market.
During the analysis stage, feedback from the stakeholder groups would be compared to determine areas of agreement as well as areas of divergence