

Key Insights
The global non-surgical aesthetic devices market is experiencing robust growth, driven by the increasing demand for minimally invasive cosmetic procedures and the rising awareness of aesthetic enhancement options. The market's 7.10% CAGR indicates a significant expansion projected through 2033. Several factors contribute to this growth, including the aging global population seeking to maintain a youthful appearance, technological advancements leading to safer and more effective devices, and the increasing affordability of these procedures. The key application segments are skin resurfacing and tightening, body contouring, and hair removal, with laser-based devices currently holding a significant market share due to their versatility and effectiveness. However, the market is witnessing a shift toward radiofrequency (RF) and ultrasound devices due to their relative lower cost and reduced downtime. The hospital and beauty clinic end-user segments are major contributors to market revenue, reflecting the growing professionalization of the aesthetic industry. Geographic regions such as North America and Europe currently dominate the market due to higher disposable incomes and advanced healthcare infrastructure. However, Asia-Pacific is expected to show significant growth potential in the coming years driven by rising middle-class incomes and adoption of western aesthetic standards. Market restraints include the relatively high cost of devices and procedures, the potential for side effects, and regulatory hurdles in certain regions.
The competitive landscape is characterized by a mix of established players and emerging companies. Major players are focusing on strategic partnerships, product innovation, and geographical expansion to maintain their market share. The forecast period will see continued innovation in device technology, a focus on personalized treatments, and an expansion into new applications, such as scar reduction and acne treatment. Furthermore, increasing integration of technology such as AI and improved data analytics are likely to drive efficiency and improved patient outcomes. The market's trajectory suggests a bright future for non-surgical aesthetic devices, fueled by evolving consumer preferences and technological advancement. While challenges remain, the overall trend points toward sustained growth and increasing market penetration. To accurately capture this dynamic market, it's critical to account for the influence of evolving demographics, technological innovations and emerging health-conscious consumer trends.
Non-Surgical Aesthetic Devices Market: A Comprehensive Report (2019-2033)
This comprehensive report provides an in-depth analysis of the Non-Surgical Aesthetic Devices market, encompassing market dynamics, growth trends, regional analysis, product landscape, key players, and future outlook. The study period covers 2019-2033, with 2025 as the base year and a forecast period of 2025-2033. The report segments the market by application (Skin Resurfacing and Tightening, Body Contouring and Cellulite Reduction, Hair Removal, Tattoo Removal, Other Applications), end-user (Hospital, Beauty Clinics, Other End-Users), and device type (Laser-based Aesthetic Device, Radiofrequency (RF) Based Aesthetic Device, Ultrasound Aesthetic Device, Intense Pulsed Light Device, Other Types). The market size is valued in Million units.
Non-Surgical Aesthetic Devices Market Market Dynamics & Structure
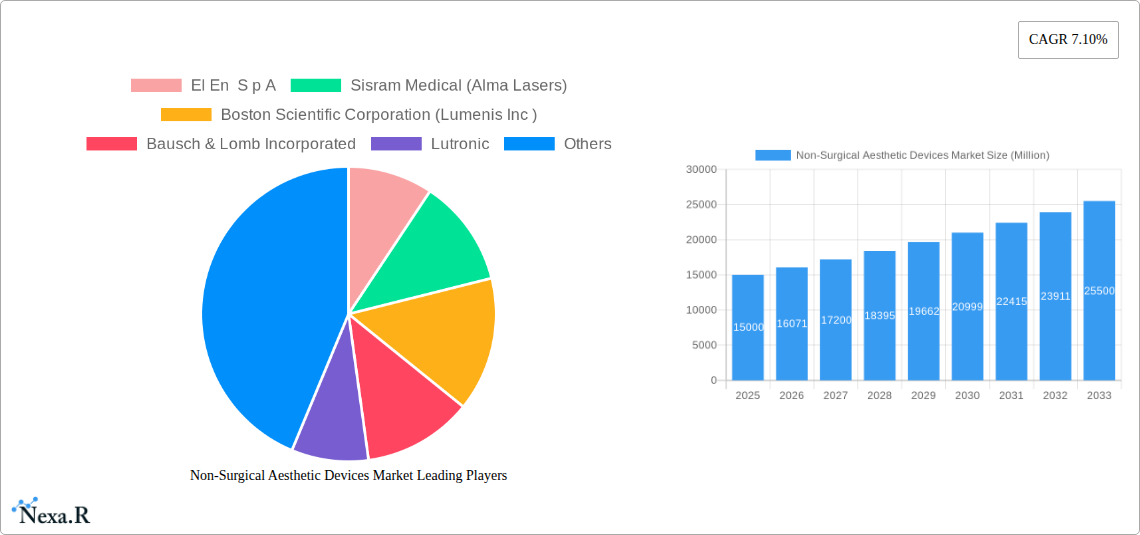
The Non-Surgical Aesthetic Devices market is characterized by moderate concentration, with key players like El En S p A, Sisram Medical (Alma Lasers), Boston Scientific Corporation (Lumenis Inc), Bausch & Lomb Incorporated, Lutronic, Fotona, Cutera Inc, STRATA Skin Sciences, Lynton Lasers Ltd, and Sciton Inc dominating the landscape. Market share distribution amongst these players is estimated to be approximately xx% in 2025. The market is experiencing rapid technological advancements, primarily driven by the development of more effective and less invasive procedures. Stringent regulatory frameworks, particularly concerning device safety and efficacy, influence market growth. Competition from surgical alternatives and the emergence of substitute technologies present considerable challenges. The increasing prevalence of aesthetic concerns among consumers, coupled with rising disposable incomes in several regions, fuels market expansion. The market has also seen several M&A activities with an estimated xx number of deals in the past five years, primarily focused on expanding product portfolios and geographical reach.
- Market Concentration: Moderate, with a few dominant players.
- Technological Innovation: Rapid advancements in laser, RF, ultrasound, and IPL technologies.
- Regulatory Frameworks: Stringent regulations impacting device approval and market entry.
- Competitive Substitutes: Surgical procedures and alternative non-invasive treatments.
- End-User Demographics: Growing demand driven by aging populations and increased aesthetic awareness.
- M&A Trends: Consolidation through acquisitions to enhance market share and technological capabilities.
Non-Surgical Aesthetic Devices Market Growth Trends & Insights
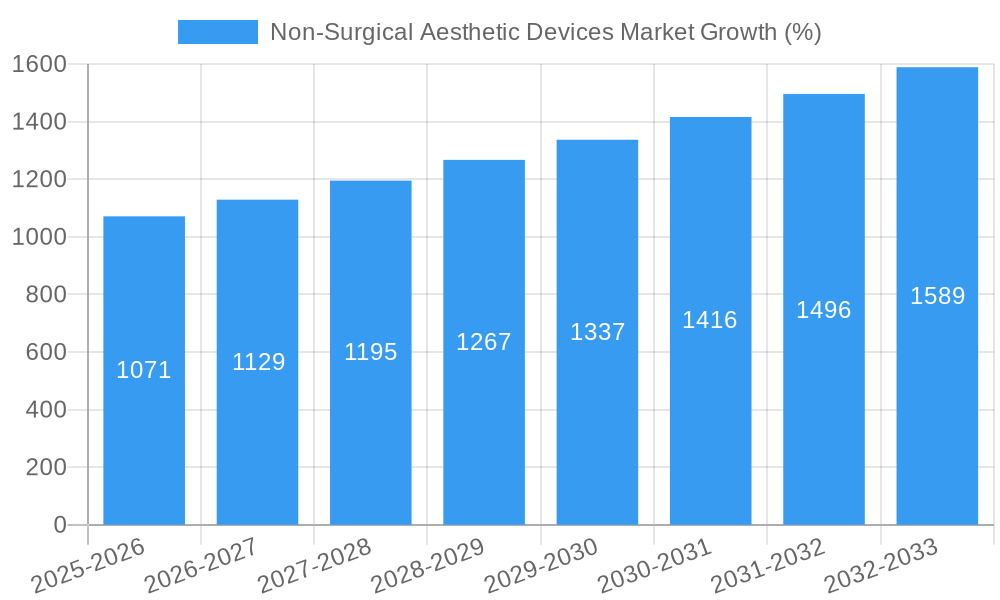
The Non-Surgical Aesthetic Devices market exhibits significant growth potential, with an estimated CAGR of xx% during the forecast period (2025-2033). Market size is predicted to reach xx Million units by 2033, driven by increasing adoption rates across various applications. Technological disruptions, such as the introduction of picosecond lasers and advanced RF technologies, are accelerating market expansion. Consumer behavior shifts, emphasizing minimally invasive procedures with quicker recovery times and improved efficacy, further boost market growth. Market penetration remains relatively low in several developing economies, indicating substantial untapped potential.
Dominant Regions, Countries, or Segments in Non-Surgical Aesthetic Devices Market
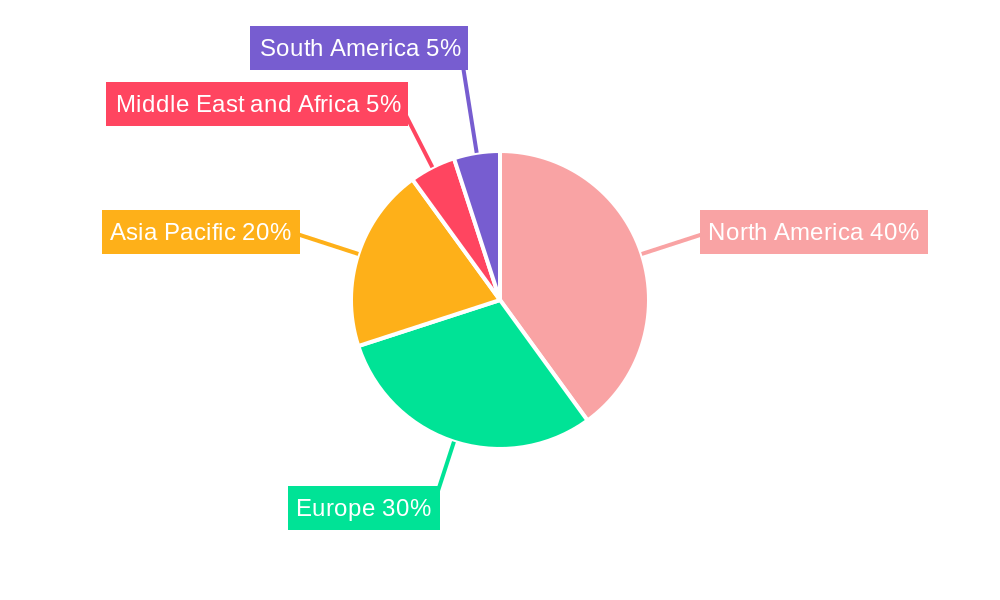
North America currently dominates the Non-Surgical Aesthetic Devices market, driven by high adoption rates, advanced healthcare infrastructure, and strong consumer preference for aesthetic procedures. Within the applications segment, Skin Resurfacing and Tightening holds the largest market share, followed by Hair Removal. Among end-users, Beauty Clinics represent the largest segment, while Laser-based devices dominate the device type segment. Europe and Asia-Pacific are also experiencing strong growth, fueled by increasing awareness of non-surgical aesthetic treatments and rising disposable incomes.
- Key Drivers (North America): High disposable incomes, advanced healthcare infrastructure, strong regulatory framework, high consumer awareness.
- Key Drivers (Europe): Growing aging population, rising disposable incomes, increasing awareness of cosmetic procedures.
- Key Drivers (Asia-Pacific): Rising middle class, increasing disposable incomes, changing aesthetic preferences.
Non-Surgical Aesthetic Devices Market Product Landscape
The Non-Surgical Aesthetic Devices market showcases continuous product innovation, with manufacturers focusing on enhancing device efficacy, safety, and user experience. Recent advancements include the introduction of multi-functional devices offering a broader range of treatments, portable systems for increased accessibility, and improved cooling mechanisms to minimize discomfort. Unique selling propositions often revolve around speed, precision, and minimal downtime. Technological advancements, such as the integration of AI-powered image analysis for treatment personalization and improved energy delivery systems, are shaping the market landscape.
Key Drivers, Barriers & Challenges in Non-Surgical Aesthetic Devices Market
Key Drivers: Growing demand for minimally invasive cosmetic procedures, technological advancements leading to improved efficacy and safety, rising disposable incomes in developing economies, increasing awareness of aesthetic treatments.
Key Challenges: High initial investment costs for clinics, stringent regulatory approvals for new devices, intense competition from established players, potential adverse effects associated with some treatments, supply chain disruptions affecting component availability and device production. These challenges are estimated to impact market growth by approximately xx% in the next 5 years.
Emerging Opportunities in Non-Surgical Aesthetic Devices Market
Emerging opportunities include the expansion into untapped markets in developing economies, the development of innovative applications targeting specific aesthetic concerns, and personalization of treatments based on individual patient needs. The integration of AI and machine learning in device operation and treatment planning presents significant potential. The growing demand for at-home aesthetic devices also presents a lucrative opportunity.
Growth Accelerators in the Non-Surgical Aesthetic Devices Market Industry
Strategic partnerships between device manufacturers and healthcare providers are facilitating market expansion. Technological breakthroughs, such as the development of non-invasive fat reduction technologies and advanced skin rejuvenation methods, are accelerating growth. Furthermore, the expansion into new geographic markets with strong growth potential and the development of effective marketing and distribution strategies contribute to long-term growth.
Key Players Shaping the Non-Surgical Aesthetic Devices Market Market
- El En S p A
- Sisram Medical (Alma Lasers) [Sisram Medical]
- Boston Scientific Corporation (Lumenis Inc) [Boston Scientific]
- Bausch & Lomb Incorporated [Bausch & Lomb]
- Lutronic
- Fotona
- Cutera Inc
- STRATA Skin Sciences
- Lynton Lasers Ltd
- Sciton Inc
Notable Milestones in Non-Surgical Aesthetic Devices Market Sector
- October 2022: Sensus Healthcare launched the Silk Laser Hair Removal System, a portable hair removal laser system in the United States. This launch expanded access to hair removal treatments and potentially increased market penetration.
- June 2022: Cynosure launched the FDA-approved PicoSure Pro device, a 755nm picosecond laser device for pigmentation treatment and skin rejuvenation. This launch introduced advanced technology with improved efficacy and broadened the treatment options available.
In-Depth Non-Surgical Aesthetic Devices Market Market Outlook
The Non-Surgical Aesthetic Devices market is poised for robust growth, driven by technological innovation, increasing consumer awareness, and expanding market penetration in developing economies. Strategic partnerships, product diversification, and the development of innovative treatment applications will shape the future landscape. The focus on personalized treatments and improved patient outcomes will further fuel market expansion, offering substantial opportunities for both established players and new entrants.
Non-Surgical Aesthetic Devices Market Segmentation
-
1. Type
- 1.1. Laser-based Aesthetic Device
- 1.2. Radiofrequency (RF) Based Aesthetic Device
- 1.3. Ultrasound Aesthetic Device
- 1.4. Intense Pulsed Light Device
- 1.5. Other Types
-
2. Application
- 2.1. Skin Resurfacing and Tightening
- 2.2. Body Contouring and Cellulite Reduction
- 2.3. Hair Removal
- 2.4. Tattoo Removal
- 2.5. Other Applications
-
3. End-User
- 3.1. Hospital
- 3.2. Beauty Clinics
- 3.3. Other End-Users
Non-Surgical Aesthetic Devices Market Segmentation By Geography
-
1. North America
- 1.1. United States
- 1.2. Canada
- 1.3. Mexico
-
2. Europe
- 2.1. Germany
- 2.2. United Kingdom
- 2.3. France
- 2.4. Italy
- 2.5. Spain
- 2.6. Rest of Europe
-
3. Asia Pacific
- 3.1. China
- 3.2. Japan
- 3.3. India
- 3.4. Australia
- 3.5. South Korea
- 3.6. Rest of Asia Pacific
-
4. Middle East and Africa
- 4.1. GCC
- 4.2. South Africa
- 4.3. Rest of Middle East and Africa
-
5. South America
- 5.1. Brazil
- 5.2. Argentina
- 5.3. Rest of South America
Non-Surgical Aesthetic Devices Market REPORT HIGHLIGHTS
| Aspects | Details |
|---|---|
| Study Period | 2019-2033 |
| Base Year | 2024 |
| Estimated Year | 2025 |
| Forecast Period | 2025-2033 |
| Historical Period | 2019-2024 |
| Growth Rate | CAGR of 7.10% from 2019-2033 |
| Segmentation |
|
Table of Contents
- 1. Introduction
- 1.1. Research Scope
- 1.2. Market Segmentation
- 1.3. Research Methodology
- 1.4. Definitions and Assumptions
- 2. Executive Summary
- 2.1. Introduction
- 3. Market Dynamics
- 3.1. Introduction
- 3.2. Market Drivers
- 3.2.1. Increasing Demand for Non-surgical Aesthetics Procedures; Technological Advancements in Non-surgical Aesthetic Devices
- 3.3. Market Restrains
- 3.3.1. High Cost of the Devices
- 3.4. Market Trends
- 3.4.1. Skin Resurfacing and Tightening is Expected to Hold the Significant Market Share Over the Forecast period.
- 4. Market Factor Analysis
- 4.1. Porters Five Forces
- 4.2. Supply/Value Chain
- 4.3. PESTEL analysis
- 4.4. Market Entropy
- 4.5. Patent/Trademark Analysis
- 5. Global Non-Surgical Aesthetic Devices Market Analysis, Insights and Forecast, 2019-2031
- 5.1. Market Analysis, Insights and Forecast - by Type
- 5.1.1. Laser-based Aesthetic Device
- 5.1.2. Radiofrequency (RF) Based Aesthetic Device
- 5.1.3. Ultrasound Aesthetic Device
- 5.1.4. Intense Pulsed Light Device
- 5.1.5. Other Types
- 5.2. Market Analysis, Insights and Forecast - by Application
- 5.2.1. Skin Resurfacing and Tightening
- 5.2.2. Body Contouring and Cellulite Reduction
- 5.2.3. Hair Removal
- 5.2.4. Tattoo Removal
- 5.2.5. Other Applications
- 5.3. Market Analysis, Insights and Forecast - by End-User
- 5.3.1. Hospital
- 5.3.2. Beauty Clinics
- 5.3.3. Other End-Users
- 5.4. Market Analysis, Insights and Forecast - by Region
- 5.4.1. North America
- 5.4.2. Europe
- 5.4.3. Asia Pacific
- 5.4.4. Middle East and Africa
- 5.4.5. South America
- 5.1. Market Analysis, Insights and Forecast - by Type
- 6. North America Non-Surgical Aesthetic Devices Market Analysis, Insights and Forecast, 2019-2031
- 6.1. Market Analysis, Insights and Forecast - by Type
- 6.1.1. Laser-based Aesthetic Device
- 6.1.2. Radiofrequency (RF) Based Aesthetic Device
- 6.1.3. Ultrasound Aesthetic Device
- 6.1.4. Intense Pulsed Light Device
- 6.1.5. Other Types
- 6.2. Market Analysis, Insights and Forecast - by Application
- 6.2.1. Skin Resurfacing and Tightening
- 6.2.2. Body Contouring and Cellulite Reduction
- 6.2.3. Hair Removal
- 6.2.4. Tattoo Removal
- 6.2.5. Other Applications
- 6.3. Market Analysis, Insights and Forecast - by End-User
- 6.3.1. Hospital
- 6.3.2. Beauty Clinics
- 6.3.3. Other End-Users
- 6.1. Market Analysis, Insights and Forecast - by Type
- 7. Europe Non-Surgical Aesthetic Devices Market Analysis, Insights and Forecast, 2019-2031
- 7.1. Market Analysis, Insights and Forecast - by Type
- 7.1.1. Laser-based Aesthetic Device
- 7.1.2. Radiofrequency (RF) Based Aesthetic Device
- 7.1.3. Ultrasound Aesthetic Device
- 7.1.4. Intense Pulsed Light Device
- 7.1.5. Other Types
- 7.2. Market Analysis, Insights and Forecast - by Application
- 7.2.1. Skin Resurfacing and Tightening
- 7.2.2. Body Contouring and Cellulite Reduction
- 7.2.3. Hair Removal
- 7.2.4. Tattoo Removal
- 7.2.5. Other Applications
- 7.3. Market Analysis, Insights and Forecast - by End-User
- 7.3.1. Hospital
- 7.3.2. Beauty Clinics
- 7.3.3. Other End-Users
- 7.1. Market Analysis, Insights and Forecast - by Type
- 8. Asia Pacific Non-Surgical Aesthetic Devices Market Analysis, Insights and Forecast, 2019-2031
- 8.1. Market Analysis, Insights and Forecast - by Type
- 8.1.1. Laser-based Aesthetic Device
- 8.1.2. Radiofrequency (RF) Based Aesthetic Device
- 8.1.3. Ultrasound Aesthetic Device
- 8.1.4. Intense Pulsed Light Device
- 8.1.5. Other Types
- 8.2. Market Analysis, Insights and Forecast - by Application
- 8.2.1. Skin Resurfacing and Tightening
- 8.2.2. Body Contouring and Cellulite Reduction
- 8.2.3. Hair Removal
- 8.2.4. Tattoo Removal
- 8.2.5. Other Applications
- 8.3. Market Analysis, Insights and Forecast - by End-User
- 8.3.1. Hospital
- 8.3.2. Beauty Clinics
- 8.3.3. Other End-Users
- 8.1. Market Analysis, Insights and Forecast - by Type
- 9. Middle East and Africa Non-Surgical Aesthetic Devices Market Analysis, Insights and Forecast, 2019-2031
- 9.1. Market Analysis, Insights and Forecast - by Type
- 9.1.1. Laser-based Aesthetic Device
- 9.1.2. Radiofrequency (RF) Based Aesthetic Device
- 9.1.3. Ultrasound Aesthetic Device
- 9.1.4. Intense Pulsed Light Device
- 9.1.5. Other Types
- 9.2. Market Analysis, Insights and Forecast - by Application
- 9.2.1. Skin Resurfacing and Tightening
- 9.2.2. Body Contouring and Cellulite Reduction
- 9.2.3. Hair Removal
- 9.2.4. Tattoo Removal
- 9.2.5. Other Applications
- 9.3. Market Analysis, Insights and Forecast - by End-User
- 9.3.1. Hospital
- 9.3.2. Beauty Clinics
- 9.3.3. Other End-Users
- 9.1. Market Analysis, Insights and Forecast - by Type
- 10. South America Non-Surgical Aesthetic Devices Market Analysis, Insights and Forecast, 2019-2031
- 10.1. Market Analysis, Insights and Forecast - by Type
- 10.1.1. Laser-based Aesthetic Device
- 10.1.2. Radiofrequency (RF) Based Aesthetic Device
- 10.1.3. Ultrasound Aesthetic Device
- 10.1.4. Intense Pulsed Light Device
- 10.1.5. Other Types
- 10.2. Market Analysis, Insights and Forecast - by Application
- 10.2.1. Skin Resurfacing and Tightening
- 10.2.2. Body Contouring and Cellulite Reduction
- 10.2.3. Hair Removal
- 10.2.4. Tattoo Removal
- 10.2.5. Other Applications
- 10.3. Market Analysis, Insights and Forecast - by End-User
- 10.3.1. Hospital
- 10.3.2. Beauty Clinics
- 10.3.3. Other End-Users
- 10.1. Market Analysis, Insights and Forecast - by Type
- 11. North America Non-Surgical Aesthetic Devices Market Analysis, Insights and Forecast, 2019-2031
- 11.1. Market Analysis, Insights and Forecast - By Country/Sub-region
- 11.1.1 United States
- 11.1.2 Canada
- 11.1.3 Mexico
- 12. Europe Non-Surgical Aesthetic Devices Market Analysis, Insights and Forecast, 2019-2031
- 12.1. Market Analysis, Insights and Forecast - By Country/Sub-region
- 12.1.1 Germany
- 12.1.2 United Kingdom
- 12.1.3 France
- 12.1.4 Italy
- 12.1.5 Spain
- 12.1.6 Rest of Europe
- 13. Asia Pacific Non-Surgical Aesthetic Devices Market Analysis, Insights and Forecast, 2019-2031
- 13.1. Market Analysis, Insights and Forecast - By Country/Sub-region
- 13.1.1 China
- 13.1.2 Japan
- 13.1.3 India
- 13.1.4 Australia
- 13.1.5 South Korea
- 13.1.6 Rest of Asia Pacific
- 14. Middle East and Africa Non-Surgical Aesthetic Devices Market Analysis, Insights and Forecast, 2019-2031
- 14.1. Market Analysis, Insights and Forecast - By Country/Sub-region
- 14.1.1 GCC
- 14.1.2 South Africa
- 14.1.3 Rest of Middle East and Africa
- 15. South America Non-Surgical Aesthetic Devices Market Analysis, Insights and Forecast, 2019-2031
- 15.1. Market Analysis, Insights and Forecast - By Country/Sub-region
- 15.1.1 Brazil
- 15.1.2 Argentina
- 15.1.3 Rest of South America
- 16. Competitive Analysis
- 16.1. Global Market Share Analysis 2024
- 16.2. Company Profiles
- 16.2.1 El En S p A
- 16.2.1.1. Overview
- 16.2.1.2. Products
- 16.2.1.3. SWOT Analysis
- 16.2.1.4. Recent Developments
- 16.2.1.5. Financials (Based on Availability)
- 16.2.2 Sisram Medical (Alma Lasers)
- 16.2.2.1. Overview
- 16.2.2.2. Products
- 16.2.2.3. SWOT Analysis
- 16.2.2.4. Recent Developments
- 16.2.2.5. Financials (Based on Availability)
- 16.2.3 Boston Scientific Corporation (Lumenis Inc )
- 16.2.3.1. Overview
- 16.2.3.2. Products
- 16.2.3.3. SWOT Analysis
- 16.2.3.4. Recent Developments
- 16.2.3.5. Financials (Based on Availability)
- 16.2.4 Bausch & Lomb Incorporated
- 16.2.4.1. Overview
- 16.2.4.2. Products
- 16.2.4.3. SWOT Analysis
- 16.2.4.4. Recent Developments
- 16.2.4.5. Financials (Based on Availability)
- 16.2.5 Lutronic
- 16.2.5.1. Overview
- 16.2.5.2. Products
- 16.2.5.3. SWOT Analysis
- 16.2.5.4. Recent Developments
- 16.2.5.5. Financials (Based on Availability)
- 16.2.6 Fotona
- 16.2.6.1. Overview
- 16.2.6.2. Products
- 16.2.6.3. SWOT Analysis
- 16.2.6.4. Recent Developments
- 16.2.6.5. Financials (Based on Availability)
- 16.2.7 Cutera Inc
- 16.2.7.1. Overview
- 16.2.7.2. Products
- 16.2.7.3. SWOT Analysis
- 16.2.7.4. Recent Developments
- 16.2.7.5. Financials (Based on Availability)
- 16.2.8 STRATA Skin Sciences
- 16.2.8.1. Overview
- 16.2.8.2. Products
- 16.2.8.3. SWOT Analysis
- 16.2.8.4. Recent Developments
- 16.2.8.5. Financials (Based on Availability)
- 16.2.9 Lynton Lasers Ltd
- 16.2.9.1. Overview
- 16.2.9.2. Products
- 16.2.9.3. SWOT Analysis
- 16.2.9.4. Recent Developments
- 16.2.9.5. Financials (Based on Availability)
- 16.2.10 Sciton Inc
- 16.2.10.1. Overview
- 16.2.10.2. Products
- 16.2.10.3. SWOT Analysis
- 16.2.10.4. Recent Developments
- 16.2.10.5. Financials (Based on Availability)
- 16.2.1 El En S p A
List of Figures
- Figure 1: Global Non-Surgical Aesthetic Devices Market Revenue Breakdown (Million, %) by Region 2024 & 2032
- Figure 2: Global Non-Surgical Aesthetic Devices Market Volume Breakdown (K Unit, %) by Region 2024 & 2032
- Figure 3: North America Non-Surgical Aesthetic Devices Market Revenue (Million), by Country 2024 & 2032
- Figure 4: North America Non-Surgical Aesthetic Devices Market Volume (K Unit), by Country 2024 & 2032
- Figure 5: North America Non-Surgical Aesthetic Devices Market Revenue Share (%), by Country 2024 & 2032
- Figure 6: North America Non-Surgical Aesthetic Devices Market Volume Share (%), by Country 2024 & 2032
- Figure 7: Europe Non-Surgical Aesthetic Devices Market Revenue (Million), by Country 2024 & 2032
- Figure 8: Europe Non-Surgical Aesthetic Devices Market Volume (K Unit), by Country 2024 & 2032
- Figure 9: Europe Non-Surgical Aesthetic Devices Market Revenue Share (%), by Country 2024 & 2032
- Figure 10: Europe Non-Surgical Aesthetic Devices Market Volume Share (%), by Country 2024 & 2032
- Figure 11: Asia Pacific Non-Surgical Aesthetic Devices Market Revenue (Million), by Country 2024 & 2032
- Figure 12: Asia Pacific Non-Surgical Aesthetic Devices Market Volume (K Unit), by Country 2024 & 2032
- Figure 13: Asia Pacific Non-Surgical Aesthetic Devices Market Revenue Share (%), by Country 2024 & 2032
- Figure 14: Asia Pacific Non-Surgical Aesthetic Devices Market Volume Share (%), by Country 2024 & 2032
- Figure 15: Middle East and Africa Non-Surgical Aesthetic Devices Market Revenue (Million), by Country 2024 & 2032
- Figure 16: Middle East and Africa Non-Surgical Aesthetic Devices Market Volume (K Unit), by Country 2024 & 2032
- Figure 17: Middle East and Africa Non-Surgical Aesthetic Devices Market Revenue Share (%), by Country 2024 & 2032
- Figure 18: Middle East and Africa Non-Surgical Aesthetic Devices Market Volume Share (%), by Country 2024 & 2032
- Figure 19: South America Non-Surgical Aesthetic Devices Market Revenue (Million), by Country 2024 & 2032
- Figure 20: South America Non-Surgical Aesthetic Devices Market Volume (K Unit), by Country 2024 & 2032
- Figure 21: South America Non-Surgical Aesthetic Devices Market Revenue Share (%), by Country 2024 & 2032
- Figure 22: South America Non-Surgical Aesthetic Devices Market Volume Share (%), by Country 2024 & 2032
- Figure 23: North America Non-Surgical Aesthetic Devices Market Revenue (Million), by Type 2024 & 2032
- Figure 24: North America Non-Surgical Aesthetic Devices Market Volume (K Unit), by Type 2024 & 2032
- Figure 25: North America Non-Surgical Aesthetic Devices Market Revenue Share (%), by Type 2024 & 2032
- Figure 26: North America Non-Surgical Aesthetic Devices Market Volume Share (%), by Type 2024 & 2032
- Figure 27: North America Non-Surgical Aesthetic Devices Market Revenue (Million), by Application 2024 & 2032
- Figure 28: North America Non-Surgical Aesthetic Devices Market Volume (K Unit), by Application 2024 & 2032
- Figure 29: North America Non-Surgical Aesthetic Devices Market Revenue Share (%), by Application 2024 & 2032
- Figure 30: North America Non-Surgical Aesthetic Devices Market Volume Share (%), by Application 2024 & 2032
- Figure 31: North America Non-Surgical Aesthetic Devices Market Revenue (Million), by End-User 2024 & 2032
- Figure 32: North America Non-Surgical Aesthetic Devices Market Volume (K Unit), by End-User 2024 & 2032
- Figure 33: North America Non-Surgical Aesthetic Devices Market Revenue Share (%), by End-User 2024 & 2032
- Figure 34: North America Non-Surgical Aesthetic Devices Market Volume Share (%), by End-User 2024 & 2032
- Figure 35: North America Non-Surgical Aesthetic Devices Market Revenue (Million), by Country 2024 & 2032
- Figure 36: North America Non-Surgical Aesthetic Devices Market Volume (K Unit), by Country 2024 & 2032
- Figure 37: North America Non-Surgical Aesthetic Devices Market Revenue Share (%), by Country 2024 & 2032
- Figure 38: North America Non-Surgical Aesthetic Devices Market Volume Share (%), by Country 2024 & 2032
- Figure 39: Europe Non-Surgical Aesthetic Devices Market Revenue (Million), by Type 2024 & 2032
- Figure 40: Europe Non-Surgical Aesthetic Devices Market Volume (K Unit), by Type 2024 & 2032
- Figure 41: Europe Non-Surgical Aesthetic Devices Market Revenue Share (%), by Type 2024 & 2032
- Figure 42: Europe Non-Surgical Aesthetic Devices Market Volume Share (%), by Type 2024 & 2032
- Figure 43: Europe Non-Surgical Aesthetic Devices Market Revenue (Million), by Application 2024 & 2032
- Figure 44: Europe Non-Surgical Aesthetic Devices Market Volume (K Unit), by Application 2024 & 2032
- Figure 45: Europe Non-Surgical Aesthetic Devices Market Revenue Share (%), by Application 2024 & 2032
- Figure 46: Europe Non-Surgical Aesthetic Devices Market Volume Share (%), by Application 2024 & 2032
- Figure 47: Europe Non-Surgical Aesthetic Devices Market Revenue (Million), by End-User 2024 & 2032
- Figure 48: Europe Non-Surgical Aesthetic Devices Market Volume (K Unit), by End-User 2024 & 2032
- Figure 49: Europe Non-Surgical Aesthetic Devices Market Revenue Share (%), by End-User 2024 & 2032
- Figure 50: Europe Non-Surgical Aesthetic Devices Market Volume Share (%), by End-User 2024 & 2032
- Figure 51: Europe Non-Surgical Aesthetic Devices Market Revenue (Million), by Country 2024 & 2032
- Figure 52: Europe Non-Surgical Aesthetic Devices Market Volume (K Unit), by Country 2024 & 2032
- Figure 53: Europe Non-Surgical Aesthetic Devices Market Revenue Share (%), by Country 2024 & 2032
- Figure 54: Europe Non-Surgical Aesthetic Devices Market Volume Share (%), by Country 2024 & 2032
- Figure 55: Asia Pacific Non-Surgical Aesthetic Devices Market Revenue (Million), by Type 2024 & 2032
- Figure 56: Asia Pacific Non-Surgical Aesthetic Devices Market Volume (K Unit), by Type 2024 & 2032
- Figure 57: Asia Pacific Non-Surgical Aesthetic Devices Market Revenue Share (%), by Type 2024 & 2032
- Figure 58: Asia Pacific Non-Surgical Aesthetic Devices Market Volume Share (%), by Type 2024 & 2032
- Figure 59: Asia Pacific Non-Surgical Aesthetic Devices Market Revenue (Million), by Application 2024 & 2032
- Figure 60: Asia Pacific Non-Surgical Aesthetic Devices Market Volume (K Unit), by Application 2024 & 2032
- Figure 61: Asia Pacific Non-Surgical Aesthetic Devices Market Revenue Share (%), by Application 2024 & 2032
- Figure 62: Asia Pacific Non-Surgical Aesthetic Devices Market Volume Share (%), by Application 2024 & 2032
- Figure 63: Asia Pacific Non-Surgical Aesthetic Devices Market Revenue (Million), by End-User 2024 & 2032
- Figure 64: Asia Pacific Non-Surgical Aesthetic Devices Market Volume (K Unit), by End-User 2024 & 2032
- Figure 65: Asia Pacific Non-Surgical Aesthetic Devices Market Revenue Share (%), by End-User 2024 & 2032
- Figure 66: Asia Pacific Non-Surgical Aesthetic Devices Market Volume Share (%), by End-User 2024 & 2032
- Figure 67: Asia Pacific Non-Surgical Aesthetic Devices Market Revenue (Million), by Country 2024 & 2032
- Figure 68: Asia Pacific Non-Surgical Aesthetic Devices Market Volume (K Unit), by Country 2024 & 2032
- Figure 69: Asia Pacific Non-Surgical Aesthetic Devices Market Revenue Share (%), by Country 2024 & 2032
- Figure 70: Asia Pacific Non-Surgical Aesthetic Devices Market Volume Share (%), by Country 2024 & 2032
- Figure 71: Middle East and Africa Non-Surgical Aesthetic Devices Market Revenue (Million), by Type 2024 & 2032
- Figure 72: Middle East and Africa Non-Surgical Aesthetic Devices Market Volume (K Unit), by Type 2024 & 2032
- Figure 73: Middle East and Africa Non-Surgical Aesthetic Devices Market Revenue Share (%), by Type 2024 & 2032
- Figure 74: Middle East and Africa Non-Surgical Aesthetic Devices Market Volume Share (%), by Type 2024 & 2032
- Figure 75: Middle East and Africa Non-Surgical Aesthetic Devices Market Revenue (Million), by Application 2024 & 2032
- Figure 76: Middle East and Africa Non-Surgical Aesthetic Devices Market Volume (K Unit), by Application 2024 & 2032
- Figure 77: Middle East and Africa Non-Surgical Aesthetic Devices Market Revenue Share (%), by Application 2024 & 2032
- Figure 78: Middle East and Africa Non-Surgical Aesthetic Devices Market Volume Share (%), by Application 2024 & 2032
- Figure 79: Middle East and Africa Non-Surgical Aesthetic Devices Market Revenue (Million), by End-User 2024 & 2032
- Figure 80: Middle East and Africa Non-Surgical Aesthetic Devices Market Volume (K Unit), by End-User 2024 & 2032
- Figure 81: Middle East and Africa Non-Surgical Aesthetic Devices Market Revenue Share (%), by End-User 2024 & 2032
- Figure 82: Middle East and Africa Non-Surgical Aesthetic Devices Market Volume Share (%), by End-User 2024 & 2032
- Figure 83: Middle East and Africa Non-Surgical Aesthetic Devices Market Revenue (Million), by Country 2024 & 2032
- Figure 84: Middle East and Africa Non-Surgical Aesthetic Devices Market Volume (K Unit), by Country 2024 & 2032
- Figure 85: Middle East and Africa Non-Surgical Aesthetic Devices Market Revenue Share (%), by Country 2024 & 2032
- Figure 86: Middle East and Africa Non-Surgical Aesthetic Devices Market Volume Share (%), by Country 2024 & 2032
- Figure 87: South America Non-Surgical Aesthetic Devices Market Revenue (Million), by Type 2024 & 2032
- Figure 88: South America Non-Surgical Aesthetic Devices Market Volume (K Unit), by Type 2024 & 2032
- Figure 89: South America Non-Surgical Aesthetic Devices Market Revenue Share (%), by Type 2024 & 2032
- Figure 90: South America Non-Surgical Aesthetic Devices Market Volume Share (%), by Type 2024 & 2032
- Figure 91: South America Non-Surgical Aesthetic Devices Market Revenue (Million), by Application 2024 & 2032
- Figure 92: South America Non-Surgical Aesthetic Devices Market Volume (K Unit), by Application 2024 & 2032
- Figure 93: South America Non-Surgical Aesthetic Devices Market Revenue Share (%), by Application 2024 & 2032
- Figure 94: South America Non-Surgical Aesthetic Devices Market Volume Share (%), by Application 2024 & 2032
- Figure 95: South America Non-Surgical Aesthetic Devices Market Revenue (Million), by End-User 2024 & 2032
- Figure 96: South America Non-Surgical Aesthetic Devices Market Volume (K Unit), by End-User 2024 & 2032
- Figure 97: South America Non-Surgical Aesthetic Devices Market Revenue Share (%), by End-User 2024 & 2032
- Figure 98: South America Non-Surgical Aesthetic Devices Market Volume Share (%), by End-User 2024 & 2032
- Figure 99: South America Non-Surgical Aesthetic Devices Market Revenue (Million), by Country 2024 & 2032
- Figure 100: South America Non-Surgical Aesthetic Devices Market Volume (K Unit), by Country 2024 & 2032
- Figure 101: South America Non-Surgical Aesthetic Devices Market Revenue Share (%), by Country 2024 & 2032
- Figure 102: South America Non-Surgical Aesthetic Devices Market Volume Share (%), by Country 2024 & 2032
List of Tables
- Table 1: Global Non-Surgical Aesthetic Devices Market Revenue Million Forecast, by Region 2019 & 2032
- Table 2: Global Non-Surgical Aesthetic Devices Market Volume K Unit Forecast, by Region 2019 & 2032
- Table 3: Global Non-Surgical Aesthetic Devices Market Revenue Million Forecast, by Type 2019 & 2032
- Table 4: Global Non-Surgical Aesthetic Devices Market Volume K Unit Forecast, by Type 2019 & 2032
- Table 5: Global Non-Surgical Aesthetic Devices Market Revenue Million Forecast, by Application 2019 & 2032
- Table 6: Global Non-Surgical Aesthetic Devices Market Volume K Unit Forecast, by Application 2019 & 2032
- Table 7: Global Non-Surgical Aesthetic Devices Market Revenue Million Forecast, by End-User 2019 & 2032
- Table 8: Global Non-Surgical Aesthetic Devices Market Volume K Unit Forecast, by End-User 2019 & 2032
- Table 9: Global Non-Surgical Aesthetic Devices Market Revenue Million Forecast, by Region 2019 & 2032
- Table 10: Global Non-Surgical Aesthetic Devices Market Volume K Unit Forecast, by Region 2019 & 2032
- Table 11: Global Non-Surgical Aesthetic Devices Market Revenue Million Forecast, by Country 2019 & 2032
- Table 12: Global Non-Surgical Aesthetic Devices Market Volume K Unit Forecast, by Country 2019 & 2032
- Table 13: United States Non-Surgical Aesthetic Devices Market Revenue (Million) Forecast, by Application 2019 & 2032
- Table 14: United States Non-Surgical Aesthetic Devices Market Volume (K Unit) Forecast, by Application 2019 & 2032
- Table 15: Canada Non-Surgical Aesthetic Devices Market Revenue (Million) Forecast, by Application 2019 & 2032
- Table 16: Canada Non-Surgical Aesthetic Devices Market Volume (K Unit) Forecast, by Application 2019 & 2032
- Table 17: Mexico Non-Surgical Aesthetic Devices Market Revenue (Million) Forecast, by Application 2019 & 2032
- Table 18: Mexico Non-Surgical Aesthetic Devices Market Volume (K Unit) Forecast, by Application 2019 & 2032
- Table 19: Global Non-Surgical Aesthetic Devices Market Revenue Million Forecast, by Country 2019 & 2032
- Table 20: Global Non-Surgical Aesthetic Devices Market Volume K Unit Forecast, by Country 2019 & 2032
- Table 21: Germany Non-Surgical Aesthetic Devices Market Revenue (Million) Forecast, by Application 2019 & 2032
- Table 22: Germany Non-Surgical Aesthetic Devices Market Volume (K Unit) Forecast, by Application 2019 & 2032
- Table 23: United Kingdom Non-Surgical Aesthetic Devices Market Revenue (Million) Forecast, by Application 2019 & 2032
- Table 24: United Kingdom Non-Surgical Aesthetic Devices Market Volume (K Unit) Forecast, by Application 2019 & 2032
- Table 25: France Non-Surgical Aesthetic Devices Market Revenue (Million) Forecast, by Application 2019 & 2032
- Table 26: France Non-Surgical Aesthetic Devices Market Volume (K Unit) Forecast, by Application 2019 & 2032
- Table 27: Italy Non-Surgical Aesthetic Devices Market Revenue (Million) Forecast, by Application 2019 & 2032
- Table 28: Italy Non-Surgical Aesthetic Devices Market Volume (K Unit) Forecast, by Application 2019 & 2032
- Table 29: Spain Non-Surgical Aesthetic Devices Market Revenue (Million) Forecast, by Application 2019 & 2032
- Table 30: Spain Non-Surgical Aesthetic Devices Market Volume (K Unit) Forecast, by Application 2019 & 2032
- Table 31: Rest of Europe Non-Surgical Aesthetic Devices Market Revenue (Million) Forecast, by Application 2019 & 2032
- Table 32: Rest of Europe Non-Surgical Aesthetic Devices Market Volume (K Unit) Forecast, by Application 2019 & 2032
- Table 33: Global Non-Surgical Aesthetic Devices Market Revenue Million Forecast, by Country 2019 & 2032
- Table 34: Global Non-Surgical Aesthetic Devices Market Volume K Unit Forecast, by Country 2019 & 2032
- Table 35: China Non-Surgical Aesthetic Devices Market Revenue (Million) Forecast, by Application 2019 & 2032
- Table 36: China Non-Surgical Aesthetic Devices Market Volume (K Unit) Forecast, by Application 2019 & 2032
- Table 37: Japan Non-Surgical Aesthetic Devices Market Revenue (Million) Forecast, by Application 2019 & 2032
- Table 38: Japan Non-Surgical Aesthetic Devices Market Volume (K Unit) Forecast, by Application 2019 & 2032
- Table 39: India Non-Surgical Aesthetic Devices Market Revenue (Million) Forecast, by Application 2019 & 2032
- Table 40: India Non-Surgical Aesthetic Devices Market Volume (K Unit) Forecast, by Application 2019 & 2032
- Table 41: Australia Non-Surgical Aesthetic Devices Market Revenue (Million) Forecast, by Application 2019 & 2032
- Table 42: Australia Non-Surgical Aesthetic Devices Market Volume (K Unit) Forecast, by Application 2019 & 2032
- Table 43: South Korea Non-Surgical Aesthetic Devices Market Revenue (Million) Forecast, by Application 2019 & 2032
- Table 44: South Korea Non-Surgical Aesthetic Devices Market Volume (K Unit) Forecast, by Application 2019 & 2032
- Table 45: Rest of Asia Pacific Non-Surgical Aesthetic Devices Market Revenue (Million) Forecast, by Application 2019 & 2032
- Table 46: Rest of Asia Pacific Non-Surgical Aesthetic Devices Market Volume (K Unit) Forecast, by Application 2019 & 2032
- Table 47: Global Non-Surgical Aesthetic Devices Market Revenue Million Forecast, by Country 2019 & 2032
- Table 48: Global Non-Surgical Aesthetic Devices Market Volume K Unit Forecast, by Country 2019 & 2032
- Table 49: GCC Non-Surgical Aesthetic Devices Market Revenue (Million) Forecast, by Application 2019 & 2032
- Table 50: GCC Non-Surgical Aesthetic Devices Market Volume (K Unit) Forecast, by Application 2019 & 2032
- Table 51: South Africa Non-Surgical Aesthetic Devices Market Revenue (Million) Forecast, by Application 2019 & 2032
- Table 52: South Africa Non-Surgical Aesthetic Devices Market Volume (K Unit) Forecast, by Application 2019 & 2032
- Table 53: Rest of Middle East and Africa Non-Surgical Aesthetic Devices Market Revenue (Million) Forecast, by Application 2019 & 2032
- Table 54: Rest of Middle East and Africa Non-Surgical Aesthetic Devices Market Volume (K Unit) Forecast, by Application 2019 & 2032
- Table 55: Global Non-Surgical Aesthetic Devices Market Revenue Million Forecast, by Country 2019 & 2032
- Table 56: Global Non-Surgical Aesthetic Devices Market Volume K Unit Forecast, by Country 2019 & 2032
- Table 57: Brazil Non-Surgical Aesthetic Devices Market Revenue (Million) Forecast, by Application 2019 & 2032
- Table 58: Brazil Non-Surgical Aesthetic Devices Market Volume (K Unit) Forecast, by Application 2019 & 2032
- Table 59: Argentina Non-Surgical Aesthetic Devices Market Revenue (Million) Forecast, by Application 2019 & 2032
- Table 60: Argentina Non-Surgical Aesthetic Devices Market Volume (K Unit) Forecast, by Application 2019 & 2032
- Table 61: Rest of South America Non-Surgical Aesthetic Devices Market Revenue (Million) Forecast, by Application 2019 & 2032
- Table 62: Rest of South America Non-Surgical Aesthetic Devices Market Volume (K Unit) Forecast, by Application 2019 & 2032
- Table 63: Global Non-Surgical Aesthetic Devices Market Revenue Million Forecast, by Type 2019 & 2032
- Table 64: Global Non-Surgical Aesthetic Devices Market Volume K Unit Forecast, by Type 2019 & 2032
- Table 65: Global Non-Surgical Aesthetic Devices Market Revenue Million Forecast, by Application 2019 & 2032
- Table 66: Global Non-Surgical Aesthetic Devices Market Volume K Unit Forecast, by Application 2019 & 2032
- Table 67: Global Non-Surgical Aesthetic Devices Market Revenue Million Forecast, by End-User 2019 & 2032
- Table 68: Global Non-Surgical Aesthetic Devices Market Volume K Unit Forecast, by End-User 2019 & 2032
- Table 69: Global Non-Surgical Aesthetic Devices Market Revenue Million Forecast, by Country 2019 & 2032
- Table 70: Global Non-Surgical Aesthetic Devices Market Volume K Unit Forecast, by Country 2019 & 2032
- Table 71: United States Non-Surgical Aesthetic Devices Market Revenue (Million) Forecast, by Application 2019 & 2032
- Table 72: United States Non-Surgical Aesthetic Devices Market Volume (K Unit) Forecast, by Application 2019 & 2032
- Table 73: Canada Non-Surgical Aesthetic Devices Market Revenue (Million) Forecast, by Application 2019 & 2032
- Table 74: Canada Non-Surgical Aesthetic Devices Market Volume (K Unit) Forecast, by Application 2019 & 2032
- Table 75: Mexico Non-Surgical Aesthetic Devices Market Revenue (Million) Forecast, by Application 2019 & 2032
- Table 76: Mexico Non-Surgical Aesthetic Devices Market Volume (K Unit) Forecast, by Application 2019 & 2032
- Table 77: Global Non-Surgical Aesthetic Devices Market Revenue Million Forecast, by Type 2019 & 2032
- Table 78: Global Non-Surgical Aesthetic Devices Market Volume K Unit Forecast, by Type 2019 & 2032
- Table 79: Global Non-Surgical Aesthetic Devices Market Revenue Million Forecast, by Application 2019 & 2032
- Table 80: Global Non-Surgical Aesthetic Devices Market Volume K Unit Forecast, by Application 2019 & 2032
- Table 81: Global Non-Surgical Aesthetic Devices Market Revenue Million Forecast, by End-User 2019 & 2032
- Table 82: Global Non-Surgical Aesthetic Devices Market Volume K Unit Forecast, by End-User 2019 & 2032
- Table 83: Global Non-Surgical Aesthetic Devices Market Revenue Million Forecast, by Country 2019 & 2032
- Table 84: Global Non-Surgical Aesthetic Devices Market Volume K Unit Forecast, by Country 2019 & 2032
- Table 85: Germany Non-Surgical Aesthetic Devices Market Revenue (Million) Forecast, by Application 2019 & 2032
- Table 86: Germany Non-Surgical Aesthetic Devices Market Volume (K Unit) Forecast, by Application 2019 & 2032
- Table 87: United Kingdom Non-Surgical Aesthetic Devices Market Revenue (Million) Forecast, by Application 2019 & 2032
- Table 88: United Kingdom Non-Surgical Aesthetic Devices Market Volume (K Unit) Forecast, by Application 2019 & 2032
- Table 89: France Non-Surgical Aesthetic Devices Market Revenue (Million) Forecast, by Application 2019 & 2032
- Table 90: France Non-Surgical Aesthetic Devices Market Volume (K Unit) Forecast, by Application 2019 & 2032
- Table 91: Italy Non-Surgical Aesthetic Devices Market Revenue (Million) Forecast, by Application 2019 & 2032
- Table 92: Italy Non-Surgical Aesthetic Devices Market Volume (K Unit) Forecast, by Application 2019 & 2032
- Table 93: Spain Non-Surgical Aesthetic Devices Market Revenue (Million) Forecast, by Application 2019 & 2032
- Table 94: Spain Non-Surgical Aesthetic Devices Market Volume (K Unit) Forecast, by Application 2019 & 2032
- Table 95: Rest of Europe Non-Surgical Aesthetic Devices Market Revenue (Million) Forecast, by Application 2019 & 2032
- Table 96: Rest of Europe Non-Surgical Aesthetic Devices Market Volume (K Unit) Forecast, by Application 2019 & 2032
- Table 97: Global Non-Surgical Aesthetic Devices Market Revenue Million Forecast, by Type 2019 & 2032
- Table 98: Global Non-Surgical Aesthetic Devices Market Volume K Unit Forecast, by Type 2019 & 2032
- Table 99: Global Non-Surgical Aesthetic Devices Market Revenue Million Forecast, by Application 2019 & 2032
- Table 100: Global Non-Surgical Aesthetic Devices Market Volume K Unit Forecast, by Application 2019 & 2032
- Table 101: Global Non-Surgical Aesthetic Devices Market Revenue Million Forecast, by End-User 2019 & 2032
- Table 102: Global Non-Surgical Aesthetic Devices Market Volume K Unit Forecast, by End-User 2019 & 2032
- Table 103: Global Non-Surgical Aesthetic Devices Market Revenue Million Forecast, by Country 2019 & 2032
- Table 104: Global Non-Surgical Aesthetic Devices Market Volume K Unit Forecast, by Country 2019 & 2032
- Table 105: China Non-Surgical Aesthetic Devices Market Revenue (Million) Forecast, by Application 2019 & 2032
- Table 106: China Non-Surgical Aesthetic Devices Market Volume (K Unit) Forecast, by Application 2019 & 2032
- Table 107: Japan Non-Surgical Aesthetic Devices Market Revenue (Million) Forecast, by Application 2019 & 2032
- Table 108: Japan Non-Surgical Aesthetic Devices Market Volume (K Unit) Forecast, by Application 2019 & 2032
- Table 109: India Non-Surgical Aesthetic Devices Market Revenue (Million) Forecast, by Application 2019 & 2032
- Table 110: India Non-Surgical Aesthetic Devices Market Volume (K Unit) Forecast, by Application 2019 & 2032
- Table 111: Australia Non-Surgical Aesthetic Devices Market Revenue (Million) Forecast, by Application 2019 & 2032
- Table 112: Australia Non-Surgical Aesthetic Devices Market Volume (K Unit) Forecast, by Application 2019 & 2032
- Table 113: South Korea Non-Surgical Aesthetic Devices Market Revenue (Million) Forecast, by Application 2019 & 2032
- Table 114: South Korea Non-Surgical Aesthetic Devices Market Volume (K Unit) Forecast, by Application 2019 & 2032
- Table 115: Rest of Asia Pacific Non-Surgical Aesthetic Devices Market Revenue (Million) Forecast, by Application 2019 & 2032
- Table 116: Rest of Asia Pacific Non-Surgical Aesthetic Devices Market Volume (K Unit) Forecast, by Application 2019 & 2032
- Table 117: Global Non-Surgical Aesthetic Devices Market Revenue Million Forecast, by Type 2019 & 2032
- Table 118: Global Non-Surgical Aesthetic Devices Market Volume K Unit Forecast, by Type 2019 & 2032
- Table 119: Global Non-Surgical Aesthetic Devices Market Revenue Million Forecast, by Application 2019 & 2032
- Table 120: Global Non-Surgical Aesthetic Devices Market Volume K Unit Forecast, by Application 2019 & 2032
- Table 121: Global Non-Surgical Aesthetic Devices Market Revenue Million Forecast, by End-User 2019 & 2032
- Table 122: Global Non-Surgical Aesthetic Devices Market Volume K Unit Forecast, by End-User 2019 & 2032
- Table 123: Global Non-Surgical Aesthetic Devices Market Revenue Million Forecast, by Country 2019 & 2032
- Table 124: Global Non-Surgical Aesthetic Devices Market Volume K Unit Forecast, by Country 2019 & 2032
- Table 125: GCC Non-Surgical Aesthetic Devices Market Revenue (Million) Forecast, by Application 2019 & 2032
- Table 126: GCC Non-Surgical Aesthetic Devices Market Volume (K Unit) Forecast, by Application 2019 & 2032
- Table 127: South Africa Non-Surgical Aesthetic Devices Market Revenue (Million) Forecast, by Application 2019 & 2032
- Table 128: South Africa Non-Surgical Aesthetic Devices Market Volume (K Unit) Forecast, by Application 2019 & 2032
- Table 129: Rest of Middle East and Africa Non-Surgical Aesthetic Devices Market Revenue (Million) Forecast, by Application 2019 & 2032
- Table 130: Rest of Middle East and Africa Non-Surgical Aesthetic Devices Market Volume (K Unit) Forecast, by Application 2019 & 2032
- Table 131: Global Non-Surgical Aesthetic Devices Market Revenue Million Forecast, by Type 2019 & 2032
- Table 132: Global Non-Surgical Aesthetic Devices Market Volume K Unit Forecast, by Type 2019 & 2032
- Table 133: Global Non-Surgical Aesthetic Devices Market Revenue Million Forecast, by Application 2019 & 2032
- Table 134: Global Non-Surgical Aesthetic Devices Market Volume K Unit Forecast, by Application 2019 & 2032
- Table 135: Global Non-Surgical Aesthetic Devices Market Revenue Million Forecast, by End-User 2019 & 2032
- Table 136: Global Non-Surgical Aesthetic Devices Market Volume K Unit Forecast, by End-User 2019 & 2032
- Table 137: Global Non-Surgical Aesthetic Devices Market Revenue Million Forecast, by Country 2019 & 2032
- Table 138: Global Non-Surgical Aesthetic Devices Market Volume K Unit Forecast, by Country 2019 & 2032
- Table 139: Brazil Non-Surgical Aesthetic Devices Market Revenue (Million) Forecast, by Application 2019 & 2032
- Table 140: Brazil Non-Surgical Aesthetic Devices Market Volume (K Unit) Forecast, by Application 2019 & 2032
- Table 141: Argentina Non-Surgical Aesthetic Devices Market Revenue (Million) Forecast, by Application 2019 & 2032
- Table 142: Argentina Non-Surgical Aesthetic Devices Market Volume (K Unit) Forecast, by Application 2019 & 2032
- Table 143: Rest of South America Non-Surgical Aesthetic Devices Market Revenue (Million) Forecast, by Application 2019 & 2032
- Table 144: Rest of South America Non-Surgical Aesthetic Devices Market Volume (K Unit) Forecast, by Application 2019 & 2032
Frequently Asked Questions
1. What is the projected Compound Annual Growth Rate (CAGR) of the Non-Surgical Aesthetic Devices Market?
The projected CAGR is approximately 7.10%.
2. Which companies are prominent players in the Non-Surgical Aesthetic Devices Market?
Key companies in the market include El En S p A, Sisram Medical (Alma Lasers), Boston Scientific Corporation (Lumenis Inc ), Bausch & Lomb Incorporated, Lutronic, Fotona, Cutera Inc, STRATA Skin Sciences, Lynton Lasers Ltd, Sciton Inc.
3. What are the main segments of the Non-Surgical Aesthetic Devices Market?
The market segments include Type, Application, End-User.
4. Can you provide details about the market size?
The market size is estimated to be USD XX Million as of 2022.
5. What are some drivers contributing to market growth?
Increasing Demand for Non-surgical Aesthetics Procedures; Technological Advancements in Non-surgical Aesthetic Devices.
6. What are the notable trends driving market growth?
Skin Resurfacing and Tightening is Expected to Hold the Significant Market Share Over the Forecast period..
7. Are there any restraints impacting market growth?
High Cost of the Devices.
8. Can you provide examples of recent developments in the market?
October 2022: Sensus Healthcare launched a portable hair removal laser system named Silk Laser Hair Removal System in the United States.
9. What pricing options are available for accessing the report?
Pricing options include single-user, multi-user, and enterprise licenses priced at USD 4750, USD 5250, and USD 8750 respectively.
10. Is the market size provided in terms of value or volume?
The market size is provided in terms of value, measured in Million and volume, measured in K Unit.
11. Are there any specific market keywords associated with the report?
Yes, the market keyword associated with the report is "Non-Surgical Aesthetic Devices Market," which aids in identifying and referencing the specific market segment covered.
12. How do I determine which pricing option suits my needs best?
The pricing options vary based on user requirements and access needs. Individual users may opt for single-user licenses, while businesses requiring broader access may choose multi-user or enterprise licenses for cost-effective access to the report.
13. Are there any additional resources or data provided in the Non-Surgical Aesthetic Devices Market report?
While the report offers comprehensive insights, it's advisable to review the specific contents or supplementary materials provided to ascertain if additional resources or data are available.
14. How can I stay updated on further developments or reports in the Non-Surgical Aesthetic Devices Market?
To stay informed about further developments, trends, and reports in the Non-Surgical Aesthetic Devices Market, consider subscribing to industry newsletters, following relevant companies and organizations, or regularly checking reputable industry news sources and publications.
Methodology
Step 1 - Identification of Relevant Samples Size from Population Database


Step 2 - Approaches for Defining Global Market Size (Value, Volume* & Price*)

Note*: In applicable scenarios
Step 3 - Data Sources
Primary Research
- Web Analytics
- Survey Reports
- Research Institute
- Latest Research Reports
- Opinion Leaders
Secondary Research
- Annual Reports
- White Paper
- Latest Press Release
- Industry Association
- Paid Database
- Investor Presentations

Step 4 - Data Triangulation
Involves using different sources of information in order to increase the validity of a study
These sources are likely to be stakeholders in a program - participants, other researchers, program staff, other community members, and so on.
Then we put all data in single framework & apply various statistical tools to find out the dynamic on the market.
During the analysis stage, feedback from the stakeholder groups would be compared to determine areas of agreement as well as areas of divergence
