

Key Insights
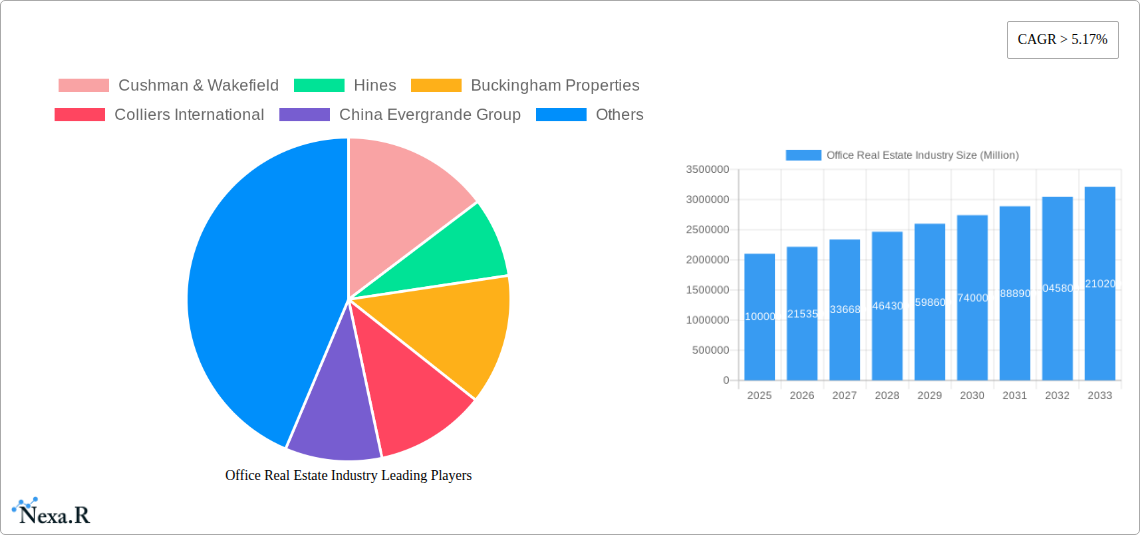
The global office real estate market, currently valued at $2.10 trillion (2025), is poised for robust growth, exhibiting a Compound Annual Growth Rate (CAGR) exceeding 5.17% from 2025 to 2033. This expansion is driven by several key factors. Firstly, the ongoing urbanization and population growth in major global cities fuel the demand for office spaces, particularly in burgeoning economies within Asia-Pacific and other rapidly developing regions. Secondly, the increasing adoption of hybrid work models, while initially impacting demand, is ultimately leading to a shift in office space requirements. Companies are opting for more flexible, amenity-rich spaces designed to foster collaboration and innovation, thereby stimulating investment in high-quality office buildings and renovations. Furthermore, technological advancements within the sector, such as smart building technologies improving energy efficiency and optimizing workspace utilization, are enhancing the appeal and value of modern office spaces. Finally, the continued expansion of multinational corporations and their need for strategically located global headquarters further contributes to market growth.
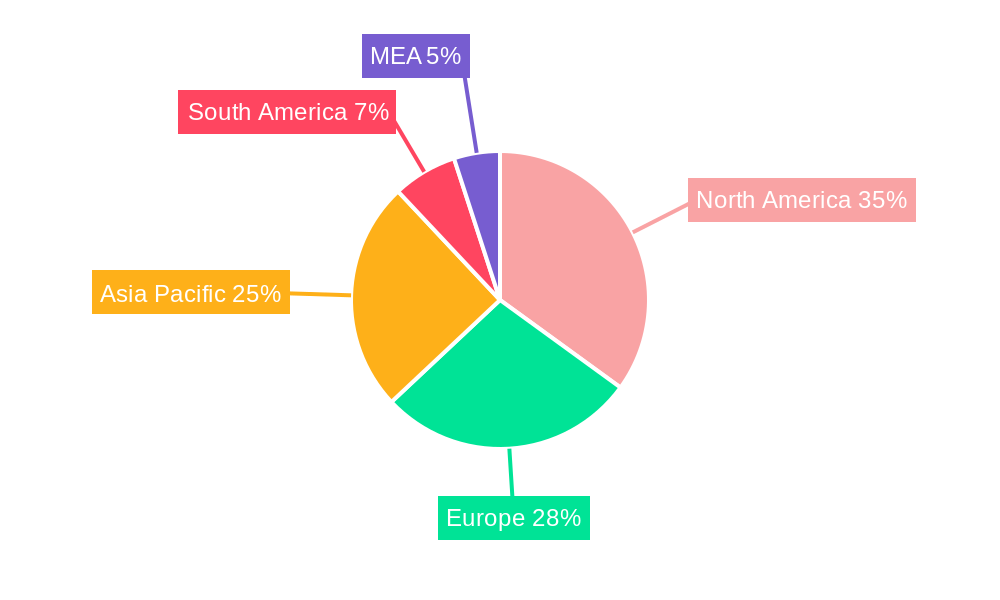
However, the market also faces challenges. Economic fluctuations, particularly recessions or periods of uncertainty, can significantly impact corporate leasing decisions and investment in new office developments. The rise of remote work and the potential for long-term changes in work patterns represent a significant headwind, though the adaptation to hybrid models is mitigating this effect. Moreover, increased construction costs and the availability of skilled labor in certain regions can impact the pace of development and potentially constrain supply. Competition amongst major players like Cushman & Wakefield, JLL, Hines, and Colliers International is intense, driving innovation in service offerings and property management but also influencing pricing and market dynamics. The geographic distribution of growth is uneven, with North America and Asia-Pacific expected to remain dominant, though emerging markets in other regions also offer significant opportunities. This dynamic interplay of drivers and restraints creates a complex, evolving market landscape characterized by both substantial growth potential and inherent risks.
This comprehensive report provides an in-depth analysis of the global office real estate market, covering the period 2019-2033, with a focus on 2025. It examines market dynamics, growth trends, dominant segments, key players, and future opportunities within the parent market of Commercial Real Estate and its child market of Office Real Estate. The report is essential for investors, industry professionals, and anyone seeking a thorough understanding of this dynamic sector. Market values are presented in millions of units.
Office Real Estate Industry Market Dynamics & Structure
This section analyzes the competitive landscape, technological influences, regulatory environment, and market evolution of the office real estate industry. The market is characterized by a moderately concentrated structure, with key players like Cushman & Wakefield, JLL, and Hines holding significant market share. However, the emergence of smaller, specialized firms and the increasing influence of technology are reshaping the competitive dynamics.
Market Concentration:
- Top 5 players hold approximately xx% market share (2025).
- High barriers to entry due to capital requirements and specialized expertise.
- Increasing consolidation through mergers and acquisitions (M&A) activity.
Technological Innovation:
- Smart building technologies (e.g., IoT, automation) driving efficiency and attracting tenants.
- Proptech solutions improving property management, tenant experience, and leasing processes.
- Data analytics increasingly used for market forecasting, risk assessment, and investment decisions.
Regulatory Frameworks:
- Varying zoning regulations and building codes across regions impacting development costs and timelines.
- Environmental regulations driving sustainable building practices and energy efficiency upgrades.
- Tax incentives and government policies influencing investment and development activities.
Competitive Product Substitutes:
- Co-working spaces and flexible office solutions offering alternatives to traditional leases.
- Remote work trends influencing demand for office space.
- Growth of virtual office solutions impacting traditional occupancy rates.
End-User Demographics:
- Shifting demand from large corporate tenants towards smaller businesses and startups.
- Growing preference for flexible and collaborative workspaces.
- Increased focus on employee well-being and workplace amenities.
M&A Trends:
- An estimated xx M&A deals in the office real estate sector between 2019-2024.
- Consolidation driven by economies of scale, geographic expansion, and technological advancements.
- Private equity firms actively investing in the sector fueling deal volume.
Office Real Estate Industry Growth Trends & Insights
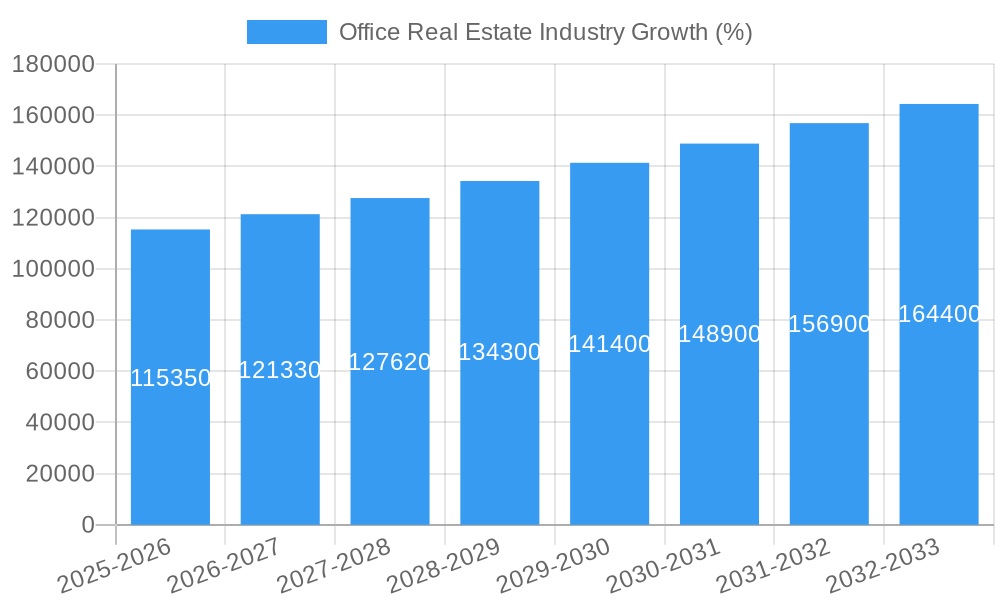
The office real estate market experienced significant growth between 2019 and 2024, with a Compound Annual Growth Rate (CAGR) of xx%. The market size reached xx million in 2025 and is projected to reach xx million by 2033, demonstrating continued expansion. The adoption rate of new technologies, like smart building solutions and property management software, is accelerating, influencing both supply and demand. Consumer behavior shifts, primarily towards flexible work arrangements and a focus on workplace experience, present both challenges and opportunities. This has led to an increased demand for flexible workspace solutions and a decreased demand for traditional office spaces in some regions.
The post-pandemic period saw a re-evaluation of office space needs, with a greater focus on hybrid working models. However, the long-term impact remains to be seen, as companies continue to adapt their workplace strategies. Market penetration of green building certifications is steadily increasing, reflecting a growing emphasis on environmental sustainability within the industry.
Dominant Regions, Countries, or Segments in Office Real Estate Industry
The North American and European markets have historically dominated the office real estate sector, but the Asia-Pacific region shows strong growth potential, particularly in major economic hubs like Shanghai, Beijing, Tokyo, and Singapore. Within product types, Office Accommodation holds the largest market share, followed by Office Equipment and Office Services.
Dominant Segments (2025):
- Product Types: Office Accommodation (xx million), Office Equipment (xx million), Office Services (xx million).
- Applications: Corporate Offices (xx million), Government Offices (xx million), Financial Institutions (xx million).
Key Drivers by Region:
- North America: Strong economic growth, robust technology sector, and high demand for premium office spaces.
- Europe: Significant investment in infrastructure, growing demand from tech companies, and favorable government policies.
- Asia-Pacific: Rapid urbanization, expanding middle class, and increasing foreign direct investment.
Dominance Factors:
- Strong economic growth and population density are key factors in determining regional dominance.
- Availability of skilled labor and infrastructure significantly influences investment decisions.
- Favorable regulatory environment and government policies promote market growth.
Office Real Estate Industry Product Landscape
The office real estate industry offers a diverse range of products and services catering to various needs and preferences. Technological advancements are transforming traditional office spaces into smart, interconnected environments. Innovations include smart building technologies, energy-efficient systems, improved security features, and flexible workspace configurations. These innovations are enhancing the user experience, increasing efficiency, and attracting tenants. Unique selling propositions now often center around sustainability features, collaborative workspaces, and cutting-edge technology integration.
Key Drivers, Barriers & Challenges in Office Real Estate Industry
Key Drivers:
- Technological advancements enhancing efficiency and attracting tenants.
- Urbanization and population growth driving demand for office space.
- Government initiatives and tax incentives promoting real estate development.
Challenges & Restraints:
- Supply chain disruptions impacting construction timelines and costs. (estimated xx% increase in construction costs in 2024).
- Regulatory hurdles and permitting processes adding to development complexities.
- Competition from co-working spaces and remote work options reducing traditional office demand.
Emerging Opportunities in Office Real Estate Industry
- Growing demand for sustainable and energy-efficient office buildings.
- Expansion of flexible workspace solutions to cater to diverse needs.
- Integration of technology to enhance tenant experience and building efficiency.
- Untapped markets in emerging economies present significant growth potential.
Growth Accelerators in the Office Real Estate Industry
Technological advancements, strategic partnerships, and expansion into new markets are key catalysts driving long-term growth. Smart building technologies are revolutionizing the sector, increasing energy efficiency and creating more attractive workspaces. Collaboration between developers, tech companies, and service providers leads to innovative solutions and enhanced market offerings. Expansion into emerging markets and a focus on sustainable development provide significant opportunities for future growth.
Key Players Shaping the Office Real Estate Industry Market
- Cushman & Wakefield
- Hines
- Buckingham Properties
- Colliers International
- China Evergrande Group
- Delhi Land & Finance
- JLL
- Skanska
Notable Milestones in Office Real Estate Industry Sector
- 2020: Increased adoption of remote work significantly impacts office demand.
- 2021: Focus shifts towards flexible and hybrid work models, impacting office design and leasing strategies.
- 2022: Significant investment in technology for smart buildings and property management.
- 2023: Increased focus on sustainability and environmental responsibility in new developments.
- 2024: Several major M&A deals reshape the competitive landscape.
In-Depth Office Real Estate Industry Market Outlook
The office real estate market is poised for continued growth, driven by technological advancements, urbanization, and the increasing demand for flexible workspaces. Strategic partnerships and a focus on sustainability will be crucial for long-term success. Emerging markets and innovative building technologies represent significant untapped potential. The industry will likely see ongoing consolidation, with larger firms acquiring smaller players to gain market share and leverage economies of scale. Continued adaptation to evolving workplace trends will be vital for future growth and success.
Office Real Estate Industry Segmentation
- 1. Production Analysis
- 2. Consumption Analysis
- 3. Import Market Analysis (Value & Volume)
- 4. Export Market Analysis (Value & Volume)
- 5. Price Trend Analysis
Office Real Estate Industry Segmentation By Geography
-
1. North America
- 1.1. United States
- 1.2. Canada
- 1.3. Mexico
-
2. Europe
- 2.1. United Kingdom
- 2.2. France
- 2.3. Germany
- 2.4. Rest of Europe
-
3. Asia Pacific
- 3.1. China
- 3.2. India
- 3.3. Japan
- 3.4. South Korea
- 3.5. Rest of Asia Pacific
- 4. Middle East
-
5. United Arab Emirates
- 5.1. Saudi Arabia
- 5.2. South Africa
- 5.3. Rest of Middle East
-
6. Latin America
- 6.1. Brazil
- 6.2. Argentina
- 6.3. Rest of Latin America
- 7. Rest of the World
Office Real Estate Industry REPORT HIGHLIGHTS
| Aspects | Details |
|---|---|
| Study Period | 2019-2033 |
| Base Year | 2024 |
| Estimated Year | 2025 |
| Forecast Period | 2025-2033 |
| Historical Period | 2019-2024 |
| Growth Rate | CAGR of > 5.17% from 2019-2033 |
| Segmentation |
|
Table of Contents
- 1. Introduction
- 1.1. Research Scope
- 1.2. Market Segmentation
- 1.3. Research Methodology
- 1.4. Definitions and Assumptions
- 2. Executive Summary
- 2.1. Introduction
- 3. Market Dynamics
- 3.1. Introduction
- 3.2. Market Drivers
- 3.2.1. Office Leasing Volume is Witnessing Significant Growth; Increasing Rental Prices of Office Spaces
- 3.3. Market Restrains
- 3.3.1. Remote Work and Hybrid Models; High vacancy rates can be a significant challenge in the office market
- 3.4. Market Trends
- 3.4.1. Rise in Demand for Coworking Spaces
- 4. Market Factor Analysis
- 4.1. Porters Five Forces
- 4.2. Supply/Value Chain
- 4.3. PESTEL analysis
- 4.4. Market Entropy
- 4.5. Patent/Trademark Analysis
- 5. Global Office Real Estate Industry Analysis, Insights and Forecast, 2019-2031
- 5.1. Market Analysis, Insights and Forecast - by Production Analysis
- 5.2. Market Analysis, Insights and Forecast - by Consumption Analysis
- 5.3. Market Analysis, Insights and Forecast - by Import Market Analysis (Value & Volume)
- 5.4. Market Analysis, Insights and Forecast - by Export Market Analysis (Value & Volume)
- 5.5. Market Analysis, Insights and Forecast - by Price Trend Analysis
- 5.6. Market Analysis, Insights and Forecast - by Region
- 5.6.1. North America
- 5.6.2. Europe
- 5.6.3. Asia Pacific
- 5.6.4. Middle East
- 5.6.5. United Arab Emirates
- 5.6.6. Latin America
- 5.6.7. Rest of the World
- 5.1. Market Analysis, Insights and Forecast - by Production Analysis
- 6. North America Office Real Estate Industry Analysis, Insights and Forecast, 2019-2031
- 6.1. Market Analysis, Insights and Forecast - by Production Analysis
- 6.2. Market Analysis, Insights and Forecast - by Consumption Analysis
- 6.3. Market Analysis, Insights and Forecast - by Import Market Analysis (Value & Volume)
- 6.4. Market Analysis, Insights and Forecast - by Export Market Analysis (Value & Volume)
- 6.5. Market Analysis, Insights and Forecast - by Price Trend Analysis
- 6.1. Market Analysis, Insights and Forecast - by Production Analysis
- 7. Europe Office Real Estate Industry Analysis, Insights and Forecast, 2019-2031
- 7.1. Market Analysis, Insights and Forecast - by Production Analysis
- 7.2. Market Analysis, Insights and Forecast - by Consumption Analysis
- 7.3. Market Analysis, Insights and Forecast - by Import Market Analysis (Value & Volume)
- 7.4. Market Analysis, Insights and Forecast - by Export Market Analysis (Value & Volume)
- 7.5. Market Analysis, Insights and Forecast - by Price Trend Analysis
- 7.1. Market Analysis, Insights and Forecast - by Production Analysis
- 8. Asia Pacific Office Real Estate Industry Analysis, Insights and Forecast, 2019-2031
- 8.1. Market Analysis, Insights and Forecast - by Production Analysis
- 8.2. Market Analysis, Insights and Forecast - by Consumption Analysis
- 8.3. Market Analysis, Insights and Forecast - by Import Market Analysis (Value & Volume)
- 8.4. Market Analysis, Insights and Forecast - by Export Market Analysis (Value & Volume)
- 8.5. Market Analysis, Insights and Forecast - by Price Trend Analysis
- 8.1. Market Analysis, Insights and Forecast - by Production Analysis
- 9. Middle East Office Real Estate Industry Analysis, Insights and Forecast, 2019-2031
- 9.1. Market Analysis, Insights and Forecast - by Production Analysis
- 9.2. Market Analysis, Insights and Forecast - by Consumption Analysis
- 9.3. Market Analysis, Insights and Forecast - by Import Market Analysis (Value & Volume)
- 9.4. Market Analysis, Insights and Forecast - by Export Market Analysis (Value & Volume)
- 9.5. Market Analysis, Insights and Forecast - by Price Trend Analysis
- 9.1. Market Analysis, Insights and Forecast - by Production Analysis
- 10. United Arab Emirates Office Real Estate Industry Analysis, Insights and Forecast, 2019-2031
- 10.1. Market Analysis, Insights and Forecast - by Production Analysis
- 10.2. Market Analysis, Insights and Forecast - by Consumption Analysis
- 10.3. Market Analysis, Insights and Forecast - by Import Market Analysis (Value & Volume)
- 10.4. Market Analysis, Insights and Forecast - by Export Market Analysis (Value & Volume)
- 10.5. Market Analysis, Insights and Forecast - by Price Trend Analysis
- 10.1. Market Analysis, Insights and Forecast - by Production Analysis
- 11. Latin America Office Real Estate Industry Analysis, Insights and Forecast, 2019-2031
- 11.1. Market Analysis, Insights and Forecast - by Production Analysis
- 11.2. Market Analysis, Insights and Forecast - by Consumption Analysis
- 11.3. Market Analysis, Insights and Forecast - by Import Market Analysis (Value & Volume)
- 11.4. Market Analysis, Insights and Forecast - by Export Market Analysis (Value & Volume)
- 11.5. Market Analysis, Insights and Forecast - by Price Trend Analysis
- 11.1. Market Analysis, Insights and Forecast - by Production Analysis
- 12. Rest of the World Office Real Estate Industry Analysis, Insights and Forecast, 2019-2031
- 12.1. Market Analysis, Insights and Forecast - by Production Analysis
- 12.2. Market Analysis, Insights and Forecast - by Consumption Analysis
- 12.3. Market Analysis, Insights and Forecast - by Import Market Analysis (Value & Volume)
- 12.4. Market Analysis, Insights and Forecast - by Export Market Analysis (Value & Volume)
- 12.5. Market Analysis, Insights and Forecast - by Price Trend Analysis
- 12.1. Market Analysis, Insights and Forecast - by Production Analysis
- 13. North America Office Real Estate Industry Analysis, Insights and Forecast, 2019-2031
- 13.1. Market Analysis, Insights and Forecast - By Country/Sub-region
- 13.1.1 United States
- 13.1.2 Canada
- 13.1.3 Mexico
- 14. Europe Office Real Estate Industry Analysis, Insights and Forecast, 2019-2031
- 14.1. Market Analysis, Insights and Forecast - By Country/Sub-region
- 14.1.1 United Kingdom
- 14.1.2 France
- 14.1.3 Germany
- 14.1.4 Rest of Europe
- 15. Asia Pacific Office Real Estate Industry Analysis, Insights and Forecast, 2019-2031
- 15.1. Market Analysis, Insights and Forecast - By Country/Sub-region
- 15.1.1 China
- 15.1.2 India
- 15.1.3 Japan
- 15.1.4 South Korea
- 15.1.5 Rest of Asia Pacific
- 16. South America Office Real Estate Industry Analysis, Insights and Forecast, 2019-2031
- 16.1. Market Analysis, Insights and Forecast - By Country/Sub-region
- 16.1.1 Brazil
- 16.1.2 Argentina
- 16.1.3 Rest of South America
- 17. MEA Office Real Estate Industry Analysis, Insights and Forecast, 2019-2031
- 17.1. Market Analysis, Insights and Forecast - By Country/Sub-region
- 17.1.1 United Arab Emirates
- 17.1.2 Saudi Arabia
- 17.1.3 South Africa
- 17.1.4 Rest of Middle East and Africa
- 18. Competitive Analysis
- 18.1. Global Market Share Analysis 2024
- 18.2. Company Profiles
- 18.2.1 Cushman & Wakefield
- 18.2.1.1. Overview
- 18.2.1.2. Products
- 18.2.1.3. SWOT Analysis
- 18.2.1.4. Recent Developments
- 18.2.1.5. Financials (Based on Availability)
- 18.2.2 Hines
- 18.2.2.1. Overview
- 18.2.2.2. Products
- 18.2.2.3. SWOT Analysis
- 18.2.2.4. Recent Developments
- 18.2.2.5. Financials (Based on Availability)
- 18.2.3 Buckingham Properties
- 18.2.3.1. Overview
- 18.2.3.2. Products
- 18.2.3.3. SWOT Analysis
- 18.2.3.4. Recent Developments
- 18.2.3.5. Financials (Based on Availability)
- 18.2.4 Colliers International
- 18.2.4.1. Overview
- 18.2.4.2. Products
- 18.2.4.3. SWOT Analysis
- 18.2.4.4. Recent Developments
- 18.2.4.5. Financials (Based on Availability)
- 18.2.5 China Evergrande Group
- 18.2.5.1. Overview
- 18.2.5.2. Products
- 18.2.5.3. SWOT Analysis
- 18.2.5.4. Recent Developments
- 18.2.5.5. Financials (Based on Availability)
- 18.2.6 Delhi Land & Finance
- 18.2.6.1. Overview
- 18.2.6.2. Products
- 18.2.6.3. SWOT Analysis
- 18.2.6.4. Recent Developments
- 18.2.6.5. Financials (Based on Availability)
- 18.2.7 JLL
- 18.2.7.1. Overview
- 18.2.7.2. Products
- 18.2.7.3. SWOT Analysis
- 18.2.7.4. Recent Developments
- 18.2.7.5. Financials (Based on Availability)
- 18.2.8 Skanska
- 18.2.8.1. Overview
- 18.2.8.2. Products
- 18.2.8.3. SWOT Analysis
- 18.2.8.4. Recent Developments
- 18.2.8.5. Financials (Based on Availability)
- 18.2.1 Cushman & Wakefield
List of Figures
- Figure 1: Global Office Real Estate Industry Revenue Breakdown (Million, %) by Region 2024 & 2032
- Figure 2: North America Office Real Estate Industry Revenue (Million), by Country 2024 & 2032
- Figure 3: North America Office Real Estate Industry Revenue Share (%), by Country 2024 & 2032
- Figure 4: Europe Office Real Estate Industry Revenue (Million), by Country 2024 & 2032
- Figure 5: Europe Office Real Estate Industry Revenue Share (%), by Country 2024 & 2032
- Figure 6: Asia Pacific Office Real Estate Industry Revenue (Million), by Country 2024 & 2032
- Figure 7: Asia Pacific Office Real Estate Industry Revenue Share (%), by Country 2024 & 2032
- Figure 8: South America Office Real Estate Industry Revenue (Million), by Country 2024 & 2032
- Figure 9: South America Office Real Estate Industry Revenue Share (%), by Country 2024 & 2032
- Figure 10: MEA Office Real Estate Industry Revenue (Million), by Country 2024 & 2032
- Figure 11: MEA Office Real Estate Industry Revenue Share (%), by Country 2024 & 2032
- Figure 12: North America Office Real Estate Industry Revenue (Million), by Production Analysis 2024 & 2032
- Figure 13: North America Office Real Estate Industry Revenue Share (%), by Production Analysis 2024 & 2032
- Figure 14: North America Office Real Estate Industry Revenue (Million), by Consumption Analysis 2024 & 2032
- Figure 15: North America Office Real Estate Industry Revenue Share (%), by Consumption Analysis 2024 & 2032
- Figure 16: North America Office Real Estate Industry Revenue (Million), by Import Market Analysis (Value & Volume) 2024 & 2032
- Figure 17: North America Office Real Estate Industry Revenue Share (%), by Import Market Analysis (Value & Volume) 2024 & 2032
- Figure 18: North America Office Real Estate Industry Revenue (Million), by Export Market Analysis (Value & Volume) 2024 & 2032
- Figure 19: North America Office Real Estate Industry Revenue Share (%), by Export Market Analysis (Value & Volume) 2024 & 2032
- Figure 20: North America Office Real Estate Industry Revenue (Million), by Price Trend Analysis 2024 & 2032
- Figure 21: North America Office Real Estate Industry Revenue Share (%), by Price Trend Analysis 2024 & 2032
- Figure 22: North America Office Real Estate Industry Revenue (Million), by Country 2024 & 2032
- Figure 23: North America Office Real Estate Industry Revenue Share (%), by Country 2024 & 2032
- Figure 24: Europe Office Real Estate Industry Revenue (Million), by Production Analysis 2024 & 2032
- Figure 25: Europe Office Real Estate Industry Revenue Share (%), by Production Analysis 2024 & 2032
- Figure 26: Europe Office Real Estate Industry Revenue (Million), by Consumption Analysis 2024 & 2032
- Figure 27: Europe Office Real Estate Industry Revenue Share (%), by Consumption Analysis 2024 & 2032
- Figure 28: Europe Office Real Estate Industry Revenue (Million), by Import Market Analysis (Value & Volume) 2024 & 2032
- Figure 29: Europe Office Real Estate Industry Revenue Share (%), by Import Market Analysis (Value & Volume) 2024 & 2032
- Figure 30: Europe Office Real Estate Industry Revenue (Million), by Export Market Analysis (Value & Volume) 2024 & 2032
- Figure 31: Europe Office Real Estate Industry Revenue Share (%), by Export Market Analysis (Value & Volume) 2024 & 2032
- Figure 32: Europe Office Real Estate Industry Revenue (Million), by Price Trend Analysis 2024 & 2032
- Figure 33: Europe Office Real Estate Industry Revenue Share (%), by Price Trend Analysis 2024 & 2032
- Figure 34: Europe Office Real Estate Industry Revenue (Million), by Country 2024 & 2032
- Figure 35: Europe Office Real Estate Industry Revenue Share (%), by Country 2024 & 2032
- Figure 36: Asia Pacific Office Real Estate Industry Revenue (Million), by Production Analysis 2024 & 2032
- Figure 37: Asia Pacific Office Real Estate Industry Revenue Share (%), by Production Analysis 2024 & 2032
- Figure 38: Asia Pacific Office Real Estate Industry Revenue (Million), by Consumption Analysis 2024 & 2032
- Figure 39: Asia Pacific Office Real Estate Industry Revenue Share (%), by Consumption Analysis 2024 & 2032
- Figure 40: Asia Pacific Office Real Estate Industry Revenue (Million), by Import Market Analysis (Value & Volume) 2024 & 2032
- Figure 41: Asia Pacific Office Real Estate Industry Revenue Share (%), by Import Market Analysis (Value & Volume) 2024 & 2032
- Figure 42: Asia Pacific Office Real Estate Industry Revenue (Million), by Export Market Analysis (Value & Volume) 2024 & 2032
- Figure 43: Asia Pacific Office Real Estate Industry Revenue Share (%), by Export Market Analysis (Value & Volume) 2024 & 2032
- Figure 44: Asia Pacific Office Real Estate Industry Revenue (Million), by Price Trend Analysis 2024 & 2032
- Figure 45: Asia Pacific Office Real Estate Industry Revenue Share (%), by Price Trend Analysis 2024 & 2032
- Figure 46: Asia Pacific Office Real Estate Industry Revenue (Million), by Country 2024 & 2032
- Figure 47: Asia Pacific Office Real Estate Industry Revenue Share (%), by Country 2024 & 2032
- Figure 48: Middle East Office Real Estate Industry Revenue (Million), by Production Analysis 2024 & 2032
- Figure 49: Middle East Office Real Estate Industry Revenue Share (%), by Production Analysis 2024 & 2032
- Figure 50: Middle East Office Real Estate Industry Revenue (Million), by Consumption Analysis 2024 & 2032
- Figure 51: Middle East Office Real Estate Industry Revenue Share (%), by Consumption Analysis 2024 & 2032
- Figure 52: Middle East Office Real Estate Industry Revenue (Million), by Import Market Analysis (Value & Volume) 2024 & 2032
- Figure 53: Middle East Office Real Estate Industry Revenue Share (%), by Import Market Analysis (Value & Volume) 2024 & 2032
- Figure 54: Middle East Office Real Estate Industry Revenue (Million), by Export Market Analysis (Value & Volume) 2024 & 2032
- Figure 55: Middle East Office Real Estate Industry Revenue Share (%), by Export Market Analysis (Value & Volume) 2024 & 2032
- Figure 56: Middle East Office Real Estate Industry Revenue (Million), by Price Trend Analysis 2024 & 2032
- Figure 57: Middle East Office Real Estate Industry Revenue Share (%), by Price Trend Analysis 2024 & 2032
- Figure 58: Middle East Office Real Estate Industry Revenue (Million), by Country 2024 & 2032
- Figure 59: Middle East Office Real Estate Industry Revenue Share (%), by Country 2024 & 2032
- Figure 60: United Arab Emirates Office Real Estate Industry Revenue (Million), by Production Analysis 2024 & 2032
- Figure 61: United Arab Emirates Office Real Estate Industry Revenue Share (%), by Production Analysis 2024 & 2032
- Figure 62: United Arab Emirates Office Real Estate Industry Revenue (Million), by Consumption Analysis 2024 & 2032
- Figure 63: United Arab Emirates Office Real Estate Industry Revenue Share (%), by Consumption Analysis 2024 & 2032
- Figure 64: United Arab Emirates Office Real Estate Industry Revenue (Million), by Import Market Analysis (Value & Volume) 2024 & 2032
- Figure 65: United Arab Emirates Office Real Estate Industry Revenue Share (%), by Import Market Analysis (Value & Volume) 2024 & 2032
- Figure 66: United Arab Emirates Office Real Estate Industry Revenue (Million), by Export Market Analysis (Value & Volume) 2024 & 2032
- Figure 67: United Arab Emirates Office Real Estate Industry Revenue Share (%), by Export Market Analysis (Value & Volume) 2024 & 2032
- Figure 68: United Arab Emirates Office Real Estate Industry Revenue (Million), by Price Trend Analysis 2024 & 2032
- Figure 69: United Arab Emirates Office Real Estate Industry Revenue Share (%), by Price Trend Analysis 2024 & 2032
- Figure 70: United Arab Emirates Office Real Estate Industry Revenue (Million), by Country 2024 & 2032
- Figure 71: United Arab Emirates Office Real Estate Industry Revenue Share (%), by Country 2024 & 2032
- Figure 72: Latin America Office Real Estate Industry Revenue (Million), by Production Analysis 2024 & 2032
- Figure 73: Latin America Office Real Estate Industry Revenue Share (%), by Production Analysis 2024 & 2032
- Figure 74: Latin America Office Real Estate Industry Revenue (Million), by Consumption Analysis 2024 & 2032
- Figure 75: Latin America Office Real Estate Industry Revenue Share (%), by Consumption Analysis 2024 & 2032
- Figure 76: Latin America Office Real Estate Industry Revenue (Million), by Import Market Analysis (Value & Volume) 2024 & 2032
- Figure 77: Latin America Office Real Estate Industry Revenue Share (%), by Import Market Analysis (Value & Volume) 2024 & 2032
- Figure 78: Latin America Office Real Estate Industry Revenue (Million), by Export Market Analysis (Value & Volume) 2024 & 2032
- Figure 79: Latin America Office Real Estate Industry Revenue Share (%), by Export Market Analysis (Value & Volume) 2024 & 2032
- Figure 80: Latin America Office Real Estate Industry Revenue (Million), by Price Trend Analysis 2024 & 2032
- Figure 81: Latin America Office Real Estate Industry Revenue Share (%), by Price Trend Analysis 2024 & 2032
- Figure 82: Latin America Office Real Estate Industry Revenue (Million), by Country 2024 & 2032
- Figure 83: Latin America Office Real Estate Industry Revenue Share (%), by Country 2024 & 2032
- Figure 84: Rest of the World Office Real Estate Industry Revenue (Million), by Production Analysis 2024 & 2032
- Figure 85: Rest of the World Office Real Estate Industry Revenue Share (%), by Production Analysis 2024 & 2032
- Figure 86: Rest of the World Office Real Estate Industry Revenue (Million), by Consumption Analysis 2024 & 2032
- Figure 87: Rest of the World Office Real Estate Industry Revenue Share (%), by Consumption Analysis 2024 & 2032
- Figure 88: Rest of the World Office Real Estate Industry Revenue (Million), by Import Market Analysis (Value & Volume) 2024 & 2032
- Figure 89: Rest of the World Office Real Estate Industry Revenue Share (%), by Import Market Analysis (Value & Volume) 2024 & 2032
- Figure 90: Rest of the World Office Real Estate Industry Revenue (Million), by Export Market Analysis (Value & Volume) 2024 & 2032
- Figure 91: Rest of the World Office Real Estate Industry Revenue Share (%), by Export Market Analysis (Value & Volume) 2024 & 2032
- Figure 92: Rest of the World Office Real Estate Industry Revenue (Million), by Price Trend Analysis 2024 & 2032
- Figure 93: Rest of the World Office Real Estate Industry Revenue Share (%), by Price Trend Analysis 2024 & 2032
- Figure 94: Rest of the World Office Real Estate Industry Revenue (Million), by Country 2024 & 2032
- Figure 95: Rest of the World Office Real Estate Industry Revenue Share (%), by Country 2024 & 2032
List of Tables
- Table 1: Global Office Real Estate Industry Revenue Million Forecast, by Region 2019 & 2032
- Table 2: Global Office Real Estate Industry Revenue Million Forecast, by Production Analysis 2019 & 2032
- Table 3: Global Office Real Estate Industry Revenue Million Forecast, by Consumption Analysis 2019 & 2032
- Table 4: Global Office Real Estate Industry Revenue Million Forecast, by Import Market Analysis (Value & Volume) 2019 & 2032
- Table 5: Global Office Real Estate Industry Revenue Million Forecast, by Export Market Analysis (Value & Volume) 2019 & 2032
- Table 6: Global Office Real Estate Industry Revenue Million Forecast, by Price Trend Analysis 2019 & 2032
- Table 7: Global Office Real Estate Industry Revenue Million Forecast, by Region 2019 & 2032
- Table 8: Global Office Real Estate Industry Revenue Million Forecast, by Country 2019 & 2032
- Table 9: United States Office Real Estate Industry Revenue (Million) Forecast, by Application 2019 & 2032
- Table 10: Canada Office Real Estate Industry Revenue (Million) Forecast, by Application 2019 & 2032
- Table 11: Mexico Office Real Estate Industry Revenue (Million) Forecast, by Application 2019 & 2032
- Table 12: Global Office Real Estate Industry Revenue Million Forecast, by Country 2019 & 2032
- Table 13: United Kingdom Office Real Estate Industry Revenue (Million) Forecast, by Application 2019 & 2032
- Table 14: France Office Real Estate Industry Revenue (Million) Forecast, by Application 2019 & 2032
- Table 15: Germany Office Real Estate Industry Revenue (Million) Forecast, by Application 2019 & 2032
- Table 16: Rest of Europe Office Real Estate Industry Revenue (Million) Forecast, by Application 2019 & 2032
- Table 17: Global Office Real Estate Industry Revenue Million Forecast, by Country 2019 & 2032
- Table 18: China Office Real Estate Industry Revenue (Million) Forecast, by Application 2019 & 2032
- Table 19: India Office Real Estate Industry Revenue (Million) Forecast, by Application 2019 & 2032
- Table 20: Japan Office Real Estate Industry Revenue (Million) Forecast, by Application 2019 & 2032
- Table 21: South Korea Office Real Estate Industry Revenue (Million) Forecast, by Application 2019 & 2032
- Table 22: Rest of Asia Pacific Office Real Estate Industry Revenue (Million) Forecast, by Application 2019 & 2032
- Table 23: Global Office Real Estate Industry Revenue Million Forecast, by Country 2019 & 2032
- Table 24: Brazil Office Real Estate Industry Revenue (Million) Forecast, by Application 2019 & 2032
- Table 25: Argentina Office Real Estate Industry Revenue (Million) Forecast, by Application 2019 & 2032
- Table 26: Rest of South America Office Real Estate Industry Revenue (Million) Forecast, by Application 2019 & 2032
- Table 27: Global Office Real Estate Industry Revenue Million Forecast, by Country 2019 & 2032
- Table 28: United Arab Emirates Office Real Estate Industry Revenue (Million) Forecast, by Application 2019 & 2032
- Table 29: Saudi Arabia Office Real Estate Industry Revenue (Million) Forecast, by Application 2019 & 2032
- Table 30: South Africa Office Real Estate Industry Revenue (Million) Forecast, by Application 2019 & 2032
- Table 31: Rest of Middle East and Africa Office Real Estate Industry Revenue (Million) Forecast, by Application 2019 & 2032
- Table 32: Global Office Real Estate Industry Revenue Million Forecast, by Production Analysis 2019 & 2032
- Table 33: Global Office Real Estate Industry Revenue Million Forecast, by Consumption Analysis 2019 & 2032
- Table 34: Global Office Real Estate Industry Revenue Million Forecast, by Import Market Analysis (Value & Volume) 2019 & 2032
- Table 35: Global Office Real Estate Industry Revenue Million Forecast, by Export Market Analysis (Value & Volume) 2019 & 2032
- Table 36: Global Office Real Estate Industry Revenue Million Forecast, by Price Trend Analysis 2019 & 2032
- Table 37: Global Office Real Estate Industry Revenue Million Forecast, by Country 2019 & 2032
- Table 38: United States Office Real Estate Industry Revenue (Million) Forecast, by Application 2019 & 2032
- Table 39: Canada Office Real Estate Industry Revenue (Million) Forecast, by Application 2019 & 2032
- Table 40: Mexico Office Real Estate Industry Revenue (Million) Forecast, by Application 2019 & 2032
- Table 41: Global Office Real Estate Industry Revenue Million Forecast, by Production Analysis 2019 & 2032
- Table 42: Global Office Real Estate Industry Revenue Million Forecast, by Consumption Analysis 2019 & 2032
- Table 43: Global Office Real Estate Industry Revenue Million Forecast, by Import Market Analysis (Value & Volume) 2019 & 2032
- Table 44: Global Office Real Estate Industry Revenue Million Forecast, by Export Market Analysis (Value & Volume) 2019 & 2032
- Table 45: Global Office Real Estate Industry Revenue Million Forecast, by Price Trend Analysis 2019 & 2032
- Table 46: Global Office Real Estate Industry Revenue Million Forecast, by Country 2019 & 2032
- Table 47: United Kingdom Office Real Estate Industry Revenue (Million) Forecast, by Application 2019 & 2032
- Table 48: France Office Real Estate Industry Revenue (Million) Forecast, by Application 2019 & 2032
- Table 49: Germany Office Real Estate Industry Revenue (Million) Forecast, by Application 2019 & 2032
- Table 50: Rest of Europe Office Real Estate Industry Revenue (Million) Forecast, by Application 2019 & 2032
- Table 51: Global Office Real Estate Industry Revenue Million Forecast, by Production Analysis 2019 & 2032
- Table 52: Global Office Real Estate Industry Revenue Million Forecast, by Consumption Analysis 2019 & 2032
- Table 53: Global Office Real Estate Industry Revenue Million Forecast, by Import Market Analysis (Value & Volume) 2019 & 2032
- Table 54: Global Office Real Estate Industry Revenue Million Forecast, by Export Market Analysis (Value & Volume) 2019 & 2032
- Table 55: Global Office Real Estate Industry Revenue Million Forecast, by Price Trend Analysis 2019 & 2032
- Table 56: Global Office Real Estate Industry Revenue Million Forecast, by Country 2019 & 2032
- Table 57: China Office Real Estate Industry Revenue (Million) Forecast, by Application 2019 & 2032
- Table 58: India Office Real Estate Industry Revenue (Million) Forecast, by Application 2019 & 2032
- Table 59: Japan Office Real Estate Industry Revenue (Million) Forecast, by Application 2019 & 2032
- Table 60: South Korea Office Real Estate Industry Revenue (Million) Forecast, by Application 2019 & 2032
- Table 61: Rest of Asia Pacific Office Real Estate Industry Revenue (Million) Forecast, by Application 2019 & 2032
- Table 62: Global Office Real Estate Industry Revenue Million Forecast, by Production Analysis 2019 & 2032
- Table 63: Global Office Real Estate Industry Revenue Million Forecast, by Consumption Analysis 2019 & 2032
- Table 64: Global Office Real Estate Industry Revenue Million Forecast, by Import Market Analysis (Value & Volume) 2019 & 2032
- Table 65: Global Office Real Estate Industry Revenue Million Forecast, by Export Market Analysis (Value & Volume) 2019 & 2032
- Table 66: Global Office Real Estate Industry Revenue Million Forecast, by Price Trend Analysis 2019 & 2032
- Table 67: Global Office Real Estate Industry Revenue Million Forecast, by Country 2019 & 2032
- Table 68: Global Office Real Estate Industry Revenue Million Forecast, by Production Analysis 2019 & 2032
- Table 69: Global Office Real Estate Industry Revenue Million Forecast, by Consumption Analysis 2019 & 2032
- Table 70: Global Office Real Estate Industry Revenue Million Forecast, by Import Market Analysis (Value & Volume) 2019 & 2032
- Table 71: Global Office Real Estate Industry Revenue Million Forecast, by Export Market Analysis (Value & Volume) 2019 & 2032
- Table 72: Global Office Real Estate Industry Revenue Million Forecast, by Price Trend Analysis 2019 & 2032
- Table 73: Global Office Real Estate Industry Revenue Million Forecast, by Country 2019 & 2032
- Table 74: Saudi Arabia Office Real Estate Industry Revenue (Million) Forecast, by Application 2019 & 2032
- Table 75: South Africa Office Real Estate Industry Revenue (Million) Forecast, by Application 2019 & 2032
- Table 76: Rest of Middle East Office Real Estate Industry Revenue (Million) Forecast, by Application 2019 & 2032
- Table 77: Global Office Real Estate Industry Revenue Million Forecast, by Production Analysis 2019 & 2032
- Table 78: Global Office Real Estate Industry Revenue Million Forecast, by Consumption Analysis 2019 & 2032
- Table 79: Global Office Real Estate Industry Revenue Million Forecast, by Import Market Analysis (Value & Volume) 2019 & 2032
- Table 80: Global Office Real Estate Industry Revenue Million Forecast, by Export Market Analysis (Value & Volume) 2019 & 2032
- Table 81: Global Office Real Estate Industry Revenue Million Forecast, by Price Trend Analysis 2019 & 2032
- Table 82: Global Office Real Estate Industry Revenue Million Forecast, by Country 2019 & 2032
- Table 83: Brazil Office Real Estate Industry Revenue (Million) Forecast, by Application 2019 & 2032
- Table 84: Argentina Office Real Estate Industry Revenue (Million) Forecast, by Application 2019 & 2032
- Table 85: Rest of Latin America Office Real Estate Industry Revenue (Million) Forecast, by Application 2019 & 2032
- Table 86: Global Office Real Estate Industry Revenue Million Forecast, by Production Analysis 2019 & 2032
- Table 87: Global Office Real Estate Industry Revenue Million Forecast, by Consumption Analysis 2019 & 2032
- Table 88: Global Office Real Estate Industry Revenue Million Forecast, by Import Market Analysis (Value & Volume) 2019 & 2032
- Table 89: Global Office Real Estate Industry Revenue Million Forecast, by Export Market Analysis (Value & Volume) 2019 & 2032
- Table 90: Global Office Real Estate Industry Revenue Million Forecast, by Price Trend Analysis 2019 & 2032
- Table 91: Global Office Real Estate Industry Revenue Million Forecast, by Country 2019 & 2032
Frequently Asked Questions
1. What is the projected Compound Annual Growth Rate (CAGR) of the Office Real Estate Industry?
The projected CAGR is approximately > 5.17%.
2. Which companies are prominent players in the Office Real Estate Industry?
Key companies in the market include Cushman & Wakefield, Hines, Buckingham Properties, Colliers International, China Evergrande Group, Delhi Land & Finance, JLL, Skanska.
3. What are the main segments of the Office Real Estate Industry?
The market segments include Production Analysis, Consumption Analysis, Import Market Analysis (Value & Volume), Export Market Analysis (Value & Volume), Price Trend Analysis.
4. Can you provide details about the market size?
The market size is estimated to be USD 2.10 Million as of 2022.
5. What are some drivers contributing to market growth?
Office Leasing Volume is Witnessing Significant Growth; Increasing Rental Prices of Office Spaces.
6. What are the notable trends driving market growth?
Rise in Demand for Coworking Spaces.
7. Are there any restraints impacting market growth?
Remote Work and Hybrid Models; High vacancy rates can be a significant challenge in the office market.
8. Can you provide examples of recent developments in the market?
N/A
9. What pricing options are available for accessing the report?
Pricing options include single-user, multi-user, and enterprise licenses priced at USD 4750, USD 5250, and USD 8750 respectively.
10. Is the market size provided in terms of value or volume?
The market size is provided in terms of value, measured in Million.
11. Are there any specific market keywords associated with the report?
Yes, the market keyword associated with the report is "Office Real Estate Industry," which aids in identifying and referencing the specific market segment covered.
12. How do I determine which pricing option suits my needs best?
The pricing options vary based on user requirements and access needs. Individual users may opt for single-user licenses, while businesses requiring broader access may choose multi-user or enterprise licenses for cost-effective access to the report.
13. Are there any additional resources or data provided in the Office Real Estate Industry report?
While the report offers comprehensive insights, it's advisable to review the specific contents or supplementary materials provided to ascertain if additional resources or data are available.
14. How can I stay updated on further developments or reports in the Office Real Estate Industry?
To stay informed about further developments, trends, and reports in the Office Real Estate Industry, consider subscribing to industry newsletters, following relevant companies and organizations, or regularly checking reputable industry news sources and publications.
Methodology
Step 1 - Identification of Relevant Samples Size from Population Database


Step 2 - Approaches for Defining Global Market Size (Value, Volume* & Price*)

Note*: In applicable scenarios
Step 3 - Data Sources
Primary Research
- Web Analytics
- Survey Reports
- Research Institute
- Latest Research Reports
- Opinion Leaders
Secondary Research
- Annual Reports
- White Paper
- Latest Press Release
- Industry Association
- Paid Database
- Investor Presentations

Step 4 - Data Triangulation
Involves using different sources of information in order to increase the validity of a study
These sources are likely to be stakeholders in a program - participants, other researchers, program staff, other community members, and so on.
Then we put all data in single framework & apply various statistical tools to find out the dynamic on the market.
During the analysis stage, feedback from the stakeholder groups would be compared to determine areas of agreement as well as areas of divergence
