

Key Insights
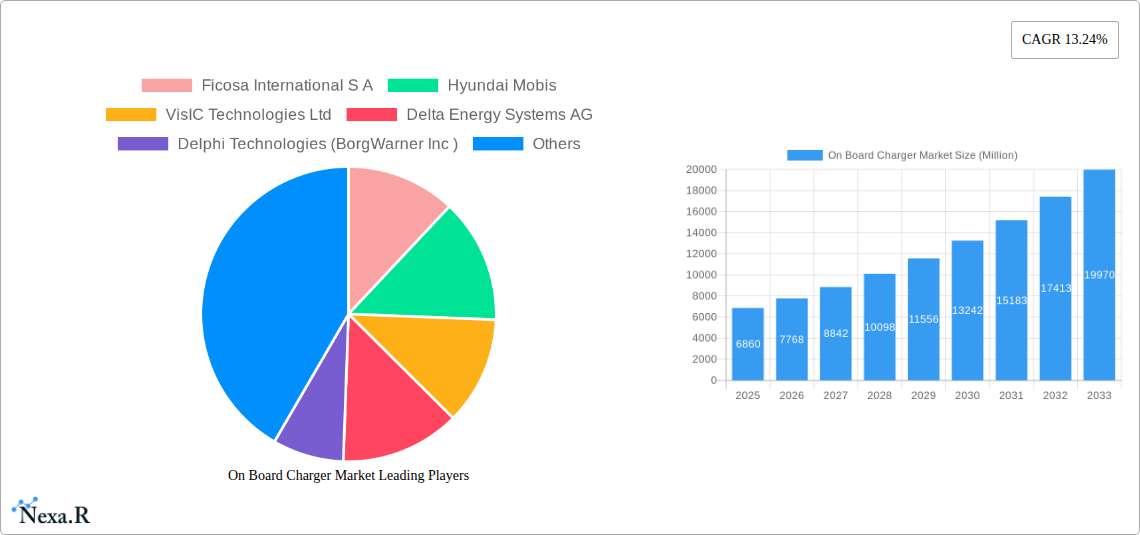
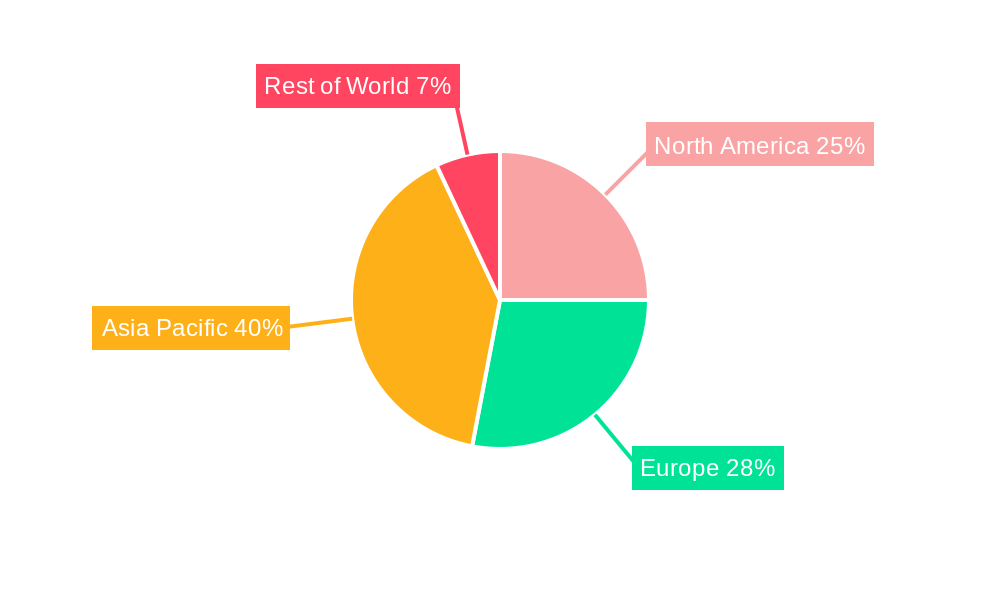
The On-Board Charger (OBC) market is experiencing robust growth, driven by the escalating adoption of electric vehicles (EVs) globally. The market, valued at $6.86 billion in 2025, is projected to expand at a Compound Annual Growth Rate (CAGR) of 13.24% from 2025 to 2033. This surge is fueled by several key factors. Stringent government regulations aimed at reducing carbon emissions are incentivizing EV adoption, thereby increasing the demand for OBCs. Furthermore, advancements in battery technology, leading to higher energy density and faster charging capabilities, are contributing to market expansion. The increasing affordability of EVs and the expanding charging infrastructure are also significant drivers. The market segmentation reveals a strong preference for Battery Electric Vehicles (BEVs) over Plug-in Hybrid Electric Vehicles (PHEVs), reflecting the growing consumer interest in fully electric vehicles. The dominance of Original Equipment Manufacturers (OEMs) in the sales channel indicates a strong integration of OBCs within the vehicle manufacturing process. Geographically, the Asia-Pacific region, particularly China, is expected to lead the market due to substantial government support for EV adoption and a large automotive manufacturing base. North America and Europe are also anticipated to witness significant growth, driven by increasing consumer awareness and government initiatives.
The competitive landscape is characterized by a mix of established automotive component suppliers and emerging technology companies. Key players like Ficosa, Hyundai Mobis, and Valeo are leveraging their extensive automotive industry experience to capture market share. Simultaneously, companies specializing in power electronics, such as VisIC Technologies and Delta Energy Systems, are contributing to technological advancements in OBC design and efficiency. The market is likely to witness increased consolidation and strategic partnerships as companies seek to expand their product portfolios and geographic reach. Future growth will be influenced by the pace of EV adoption, technological innovations in charging technologies (such as wireless charging), and the overall development of the EV ecosystem. The focus on improving charging speed, efficiency, and cost-effectiveness will be crucial in shaping the future of the OBC market.
On Board Charger Market Report: 2019-2033
This comprehensive report provides an in-depth analysis of the On Board Charger (OBC) market, encompassing historical data (2019-2024), the base year (2025), and a detailed forecast (2025-2033). The report segments the market by vehicle type (Passenger Cars, Commercial Vehicles), powertrain type (Battery Electric Vehicles (BEVs), Plug-In Hybrid Electric Vehicles (PHEVs)), power rating (Less than 11 kW, More than 11 kW), and sales channel (OEM, Aftermarket), offering granular insights into growth drivers, challenges, and emerging opportunities within this dynamic sector. The market is expected to reach xx Million units by 2033.
On Board Charger Market Dynamics & Structure
The On Board Charger market is characterized by a moderately concentrated landscape with key players such as Ficosa International S.A., Hyundai Mobis, VisIC Technologies Ltd, Delta Energy Systems AG, Delphi Technologies (BorgWarner Inc.), Bel Fuse Inc, Brusa Elektronik AG, Toyota Industries Corporation, STMicroelectronics, Valeo SE, and LG Corporation vying for market share. The market's structure is influenced by technological advancements, stringent emission regulations, and the increasing demand for electric vehicles (EVs).
- Market Concentration: The market exhibits a moderate level of concentration, with the top 5 players holding approximately xx% of the market share in 2024.
- Technological Innovation: Continuous advancements in power electronics, particularly in silicon carbide (SiC) and gallium nitride (GaN) based inverters, are driving efficiency improvements and miniaturization of OBCs. However, high R&D costs pose a significant barrier to entry for smaller players.
- Regulatory Framework: Governments worldwide are implementing stricter emission norms, pushing the adoption of EVs and consequently boosting the demand for OBCs. However, varying regulatory standards across different regions can create complexities for manufacturers.
- Competitive Product Substitutes: While OBCs are currently the standard for onboard charging in EVs, emerging technologies like wireless charging are potential substitutes, though currently limited in adoption due to cost and efficiency constraints.
- End-User Demographics: The primary end-users are OEMs, who integrate OBCs into their vehicles during manufacturing. The aftermarket segment is comparatively smaller, focusing primarily on replacement and upgrades.
- M&A Trends: The past five years have witnessed xx M&A deals in the OBC market, primarily focused on strengthening technology portfolios and expanding geographical reach.
On Board Charger Market Growth Trends & Insights
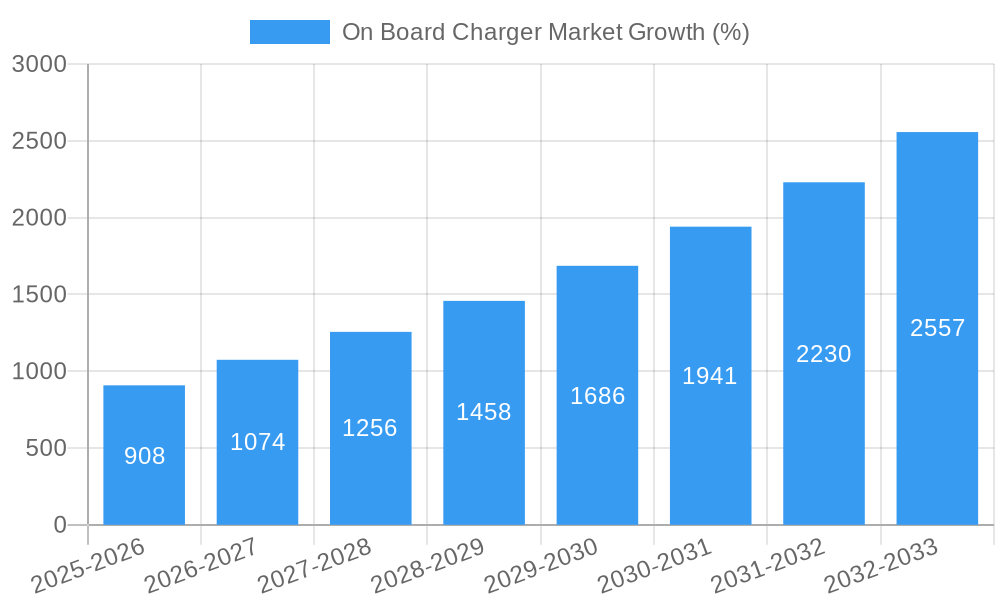
The global On Board Charger market witnessed significant growth during the historical period (2019-2024), driven by the increasing adoption of EVs and PHEVs. The market size expanded from xx Million units in 2019 to xx Million units in 2024, exhibiting a CAGR of xx%. This growth is expected to continue throughout the forecast period (2025-2033), with the market projected to reach xx Million units by 2033, driven by factors such as government incentives, declining battery prices, and improved charging infrastructure. Technological disruptions, such as the introduction of higher power OBCs and advancements in power semiconductor technologies, are further accelerating market growth. Consumer preference for longer driving ranges and faster charging times are influencing demand for higher-power OBCs. The market penetration rate of OBCs in EVs is expected to increase from xx% in 2024 to xx% by 2033.
Dominant Regions, Countries, or Segments in On Board Charger Market
The On Board Charger market is witnessing strong growth across various regions and segments. However, some areas demonstrate significantly higher potential.
- By Vehicle Type: The passenger car segment currently dominates the market, accounting for xx% of the total market share in 2024. However, the commercial vehicle segment is projected to witness higher growth rates during the forecast period, driven by the increasing adoption of electric commercial fleets.
- By Powertrain Type: BEVs represent the largest segment, holding approximately xx% of the market share in 2024, reflecting the increasing preference for fully electric vehicles. PHEVs are expected to maintain steady growth, though at a slower pace compared to BEVs.
- By Power Rating: The demand for OBCs with power ratings above 11 kW is growing rapidly, particularly among high-performance EVs that require faster charging times. This segment is expected to be a major driver of market growth in the coming years.
- By Sales Channel: OEMs currently dominate the sales channel, accounting for xx% of the market share in 2024. However, the aftermarket segment is anticipated to show growth, driven by the increasing number of EVs on the road and the need for replacement or upgrades.
- Leading Regions: China currently holds the largest market share, followed by Europe and North America. However, emerging markets in Asia-Pacific are expected to show significant growth potential in the coming years due to government support for EV adoption and expanding infrastructure. Government policies and economic growth are primary drivers, particularly in regions with aggressive EV adoption targets.
On Board Charger Market Product Landscape
On-board chargers are evolving rapidly, incorporating advanced features such as higher power ratings, improved efficiency, smaller size, and integration with smart charging technologies. These advancements are driven by the need for faster charging times, reduced vehicle weight, and enhanced user experience. Key features include advanced thermal management systems, improved power density, and enhanced compatibility with various charging standards. Unique selling propositions often center around charging speed, efficiency, and integration capabilities.
Key Drivers, Barriers & Challenges in On Board Charger Market
Key Drivers:
- The increasing global demand for electric vehicles, driven by environmental concerns and government regulations.
- Advancements in power semiconductor technologies, leading to higher efficiency and power density OBCs.
- Development of improved battery technologies, enabling faster charging rates.
Challenges and Restraints:
- High initial costs associated with OBC technology can hinder adoption, particularly in emerging markets.
- The complexity of integrating OBCs into different vehicle architectures poses a significant challenge.
- Competition from alternative charging technologies, such as wireless charging, could affect market growth. The impact of these alternative technologies is currently estimated at xx% reduction in the overall OBC market by 2033.
Emerging Opportunities in On Board Charger Market
- Growth in the commercial vehicle segment presents a significant opportunity for OBC manufacturers.
- Development of innovative OBCs with integrated functionalities, such as battery management systems, presents potential for higher margins.
- Expansion into emerging markets with supportive government policies offers substantial growth opportunities.
Growth Accelerators in the On Board Charger Market Industry
The long-term growth of the On Board Charger market will be fueled by technological innovations leading to higher power density, improved efficiency, and reduced costs. Strategic partnerships between OBC manufacturers and automotive OEMs will play a crucial role in accelerating market penetration. Expansion into new geographical markets, particularly in developing economies with growing EV adoption, will also drive substantial growth.
Key Players Shaping the On Board Charger Market Market
- Ficosa International S.A.
- Hyundai Mobis
- VisIC Technologies Ltd
- Delta Energy Systems AG
- Delphi Technologies (BorgWarner Inc.)
- Bel Fuse Inc
- Brusa Elektronik AG
- Toyota Industries Corporation
- STMicroelectronics
- Valeo SE
- LG Corporation
Notable Milestones in On Board Charger Market Sector
- March 2024: Ford's announcement of dual 176 kW on-board chargers in its E-Transit van significantly boosts the high-power OBC segment and showcases the potential for faster charging times.
- July 2023: Stellantis' collaboration to eliminate inverters and OBCs presents a significant headwind, potentially impacting future market growth. This innovation highlights the need for OBC manufacturers to adapt and innovate.
- April 2023: Coulom Solution's 20 kW OBC for commercial vehicles demonstrates cost-effective solutions for this growing market segment, indicating a potential shift towards price-competitive offerings.
In-Depth On Board Charger Market Market Outlook
The future of the On Board Charger market looks promising, driven by the continued growth of the EV sector and technological advancements. The focus on higher power ratings, improved efficiency, and cost reduction will be key factors shaping the market. Strategic collaborations and expansion into new markets will further contribute to the long-term growth potential. Opportunities exist in developing cost-effective solutions for the commercial vehicle sector and integrating OBCs with other vehicle systems to enhance functionality and user experience.
On Board Charger Market Segmentation
-
1. Vehicle Type
- 1.1. Passenger Cars
- 1.2. Commercial Vehicles
-
2. Powertrain Type
- 2.1. Battery Electric Vehicles (BEVs)
- 2.2. Plug-In Hybrid Electric Vehicles (PHEVs)
-
3. Power Rating
- 3.1. Less than 3.3 kW
- 3.2. 3.3-11 kW
- 3.3. More than 11 kW
-
4. Sales Channel
- 4.1. Original Equipment Manufacturer (OEM)
- 4.2. Aftermarket
On Board Charger Market Segmentation By Geography
-
1. North America
- 1.1. United States
- 1.2. Canada
- 1.3. Rest of North America
-
2. Europe
- 2.1. Germany
- 2.2. United Kingdom
- 2.3. France
- 2.4. Italy
- 2.5. Rest of Europe
-
3. Asia Pacific
- 3.1. China
- 3.2. India
- 3.3. Japan
- 3.4. South Korea
- 3.5. Rest of Asia Pacific
-
4. Rest of the World
- 4.1. Brazil
- 4.2. Mexico
- 4.3. United Arab Emirates
- 4.4. Other Countries
On Board Charger Market REPORT HIGHLIGHTS
| Aspects | Details |
|---|---|
| Study Period | 2019-2033 |
| Base Year | 2024 |
| Estimated Year | 2025 |
| Forecast Period | 2025-2033 |
| Historical Period | 2019-2024 |
| Growth Rate | CAGR of 13.24% from 2019-2033 |
| Segmentation |
|
Table of Contents
- 1. Introduction
- 1.1. Research Scope
- 1.2. Market Segmentation
- 1.3. Research Methodology
- 1.4. Definitions and Assumptions
- 2. Executive Summary
- 2.1. Introduction
- 3. Market Dynamics
- 3.1. Introduction
- 3.2. Market Drivers
- 3.2.1. Aggressive Government Focus to Promote the Adoption of Electric Vehicles Fosters the Growth of the Market
- 3.3. Market Restrains
- 3.3.1. High Cost of On Board Chargers Hampers the Growth of the Market
- 3.4. Market Trends
- 3.4.1. The Passenger Cars Segment is Leading the On Board Charger Market
- 4. Market Factor Analysis
- 4.1. Porters Five Forces
- 4.2. Supply/Value Chain
- 4.3. PESTEL analysis
- 4.4. Market Entropy
- 4.5. Patent/Trademark Analysis
- 5. Global On Board Charger Market Analysis, Insights and Forecast, 2019-2031
- 5.1. Market Analysis, Insights and Forecast - by Vehicle Type
- 5.1.1. Passenger Cars
- 5.1.2. Commercial Vehicles
- 5.2. Market Analysis, Insights and Forecast - by Powertrain Type
- 5.2.1. Battery Electric Vehicles (BEVs)
- 5.2.2. Plug-In Hybrid Electric Vehicles (PHEVs)
- 5.3. Market Analysis, Insights and Forecast - by Power Rating
- 5.3.1. Less than 3.3 kW
- 5.3.2. 3.3-11 kW
- 5.3.3. More than 11 kW
- 5.4. Market Analysis, Insights and Forecast - by Sales Channel
- 5.4.1. Original Equipment Manufacturer (OEM)
- 5.4.2. Aftermarket
- 5.5. Market Analysis, Insights and Forecast - by Region
- 5.5.1. North America
- 5.5.2. Europe
- 5.5.3. Asia Pacific
- 5.5.4. Rest of the World
- 5.1. Market Analysis, Insights and Forecast - by Vehicle Type
- 6. North America On Board Charger Market Analysis, Insights and Forecast, 2019-2031
- 6.1. Market Analysis, Insights and Forecast - by Vehicle Type
- 6.1.1. Passenger Cars
- 6.1.2. Commercial Vehicles
- 6.2. Market Analysis, Insights and Forecast - by Powertrain Type
- 6.2.1. Battery Electric Vehicles (BEVs)
- 6.2.2. Plug-In Hybrid Electric Vehicles (PHEVs)
- 6.3. Market Analysis, Insights and Forecast - by Power Rating
- 6.3.1. Less than 3.3 kW
- 6.3.2. 3.3-11 kW
- 6.3.3. More than 11 kW
- 6.4. Market Analysis, Insights and Forecast - by Sales Channel
- 6.4.1. Original Equipment Manufacturer (OEM)
- 6.4.2. Aftermarket
- 6.1. Market Analysis, Insights and Forecast - by Vehicle Type
- 7. Europe On Board Charger Market Analysis, Insights and Forecast, 2019-2031
- 7.1. Market Analysis, Insights and Forecast - by Vehicle Type
- 7.1.1. Passenger Cars
- 7.1.2. Commercial Vehicles
- 7.2. Market Analysis, Insights and Forecast - by Powertrain Type
- 7.2.1. Battery Electric Vehicles (BEVs)
- 7.2.2. Plug-In Hybrid Electric Vehicles (PHEVs)
- 7.3. Market Analysis, Insights and Forecast - by Power Rating
- 7.3.1. Less than 3.3 kW
- 7.3.2. 3.3-11 kW
- 7.3.3. More than 11 kW
- 7.4. Market Analysis, Insights and Forecast - by Sales Channel
- 7.4.1. Original Equipment Manufacturer (OEM)
- 7.4.2. Aftermarket
- 7.1. Market Analysis, Insights and Forecast - by Vehicle Type
- 8. Asia Pacific On Board Charger Market Analysis, Insights and Forecast, 2019-2031
- 8.1. Market Analysis, Insights and Forecast - by Vehicle Type
- 8.1.1. Passenger Cars
- 8.1.2. Commercial Vehicles
- 8.2. Market Analysis, Insights and Forecast - by Powertrain Type
- 8.2.1. Battery Electric Vehicles (BEVs)
- 8.2.2. Plug-In Hybrid Electric Vehicles (PHEVs)
- 8.3. Market Analysis, Insights and Forecast - by Power Rating
- 8.3.1. Less than 3.3 kW
- 8.3.2. 3.3-11 kW
- 8.3.3. More than 11 kW
- 8.4. Market Analysis, Insights and Forecast - by Sales Channel
- 8.4.1. Original Equipment Manufacturer (OEM)
- 8.4.2. Aftermarket
- 8.1. Market Analysis, Insights and Forecast - by Vehicle Type
- 9. Rest of the World On Board Charger Market Analysis, Insights and Forecast, 2019-2031
- 9.1. Market Analysis, Insights and Forecast - by Vehicle Type
- 9.1.1. Passenger Cars
- 9.1.2. Commercial Vehicles
- 9.2. Market Analysis, Insights and Forecast - by Powertrain Type
- 9.2.1. Battery Electric Vehicles (BEVs)
- 9.2.2. Plug-In Hybrid Electric Vehicles (PHEVs)
- 9.3. Market Analysis, Insights and Forecast - by Power Rating
- 9.3.1. Less than 3.3 kW
- 9.3.2. 3.3-11 kW
- 9.3.3. More than 11 kW
- 9.4. Market Analysis, Insights and Forecast - by Sales Channel
- 9.4.1. Original Equipment Manufacturer (OEM)
- 9.4.2. Aftermarket
- 9.1. Market Analysis, Insights and Forecast - by Vehicle Type
- 10. North America On Board Charger Market Analysis, Insights and Forecast, 2019-2031
- 10.1. Market Analysis, Insights and Forecast - By Country/Sub-region
- 10.1.1 United States
- 10.1.2 Canada
- 10.1.3 Rest of North America
- 11. Europe On Board Charger Market Analysis, Insights and Forecast, 2019-2031
- 11.1. Market Analysis, Insights and Forecast - By Country/Sub-region
- 11.1.1 Germany
- 11.1.2 United Kingdom
- 11.1.3 France
- 11.1.4 Italy
- 11.1.5 Rest of Europe
- 12. Asia Pacific On Board Charger Market Analysis, Insights and Forecast, 2019-2031
- 12.1. Market Analysis, Insights and Forecast - By Country/Sub-region
- 12.1.1 China
- 12.1.2 India
- 12.1.3 Japan
- 12.1.4 South Korea
- 12.1.5 Rest of Asia Pacific
- 13. Rest of the World On Board Charger Market Analysis, Insights and Forecast, 2019-2031
- 13.1. Market Analysis, Insights and Forecast - By Country/Sub-region
- 13.1.1 Brazil
- 13.1.2 Mexico
- 13.1.3 United Arab Emirates
- 13.1.4 Other Countries
- 14. Competitive Analysis
- 14.1. Global Market Share Analysis 2024
- 14.2. Company Profiles
- 14.2.1 Ficosa International S A
- 14.2.1.1. Overview
- 14.2.1.2. Products
- 14.2.1.3. SWOT Analysis
- 14.2.1.4. Recent Developments
- 14.2.1.5. Financials (Based on Availability)
- 14.2.2 Hyundai Mobis
- 14.2.2.1. Overview
- 14.2.2.2. Products
- 14.2.2.3. SWOT Analysis
- 14.2.2.4. Recent Developments
- 14.2.2.5. Financials (Based on Availability)
- 14.2.3 VisIC Technologies Ltd
- 14.2.3.1. Overview
- 14.2.3.2. Products
- 14.2.3.3. SWOT Analysis
- 14.2.3.4. Recent Developments
- 14.2.3.5. Financials (Based on Availability)
- 14.2.4 Delta Energy Systems AG
- 14.2.4.1. Overview
- 14.2.4.2. Products
- 14.2.4.3. SWOT Analysis
- 14.2.4.4. Recent Developments
- 14.2.4.5. Financials (Based on Availability)
- 14.2.5 Delphi Technologies (BorgWarner Inc )
- 14.2.5.1. Overview
- 14.2.5.2. Products
- 14.2.5.3. SWOT Analysis
- 14.2.5.4. Recent Developments
- 14.2.5.5. Financials (Based on Availability)
- 14.2.6 Bel Fuse Inc
- 14.2.6.1. Overview
- 14.2.6.2. Products
- 14.2.6.3. SWOT Analysis
- 14.2.6.4. Recent Developments
- 14.2.6.5. Financials (Based on Availability)
- 14.2.7 Brusa Elektronik AG
- 14.2.7.1. Overview
- 14.2.7.2. Products
- 14.2.7.3. SWOT Analysis
- 14.2.7.4. Recent Developments
- 14.2.7.5. Financials (Based on Availability)
- 14.2.8 Toyota Industries Corporation
- 14.2.8.1. Overview
- 14.2.8.2. Products
- 14.2.8.3. SWOT Analysis
- 14.2.8.4. Recent Developments
- 14.2.8.5. Financials (Based on Availability)
- 14.2.9 STMicroelectronics
- 14.2.9.1. Overview
- 14.2.9.2. Products
- 14.2.9.3. SWOT Analysis
- 14.2.9.4. Recent Developments
- 14.2.9.5. Financials (Based on Availability)
- 14.2.10 Valeo SE
- 14.2.10.1. Overview
- 14.2.10.2. Products
- 14.2.10.3. SWOT Analysis
- 14.2.10.4. Recent Developments
- 14.2.10.5. Financials (Based on Availability)
- 14.2.11 LG Corporation
- 14.2.11.1. Overview
- 14.2.11.2. Products
- 14.2.11.3. SWOT Analysis
- 14.2.11.4. Recent Developments
- 14.2.11.5. Financials (Based on Availability)
- 14.2.1 Ficosa International S A
List of Figures
- Figure 1: Global On Board Charger Market Revenue Breakdown (Million, %) by Region 2024 & 2032
- Figure 2: North America On Board Charger Market Revenue (Million), by Country 2024 & 2032
- Figure 3: North America On Board Charger Market Revenue Share (%), by Country 2024 & 2032
- Figure 4: Europe On Board Charger Market Revenue (Million), by Country 2024 & 2032
- Figure 5: Europe On Board Charger Market Revenue Share (%), by Country 2024 & 2032
- Figure 6: Asia Pacific On Board Charger Market Revenue (Million), by Country 2024 & 2032
- Figure 7: Asia Pacific On Board Charger Market Revenue Share (%), by Country 2024 & 2032
- Figure 8: Rest of the World On Board Charger Market Revenue (Million), by Country 2024 & 2032
- Figure 9: Rest of the World On Board Charger Market Revenue Share (%), by Country 2024 & 2032
- Figure 10: North America On Board Charger Market Revenue (Million), by Vehicle Type 2024 & 2032
- Figure 11: North America On Board Charger Market Revenue Share (%), by Vehicle Type 2024 & 2032
- Figure 12: North America On Board Charger Market Revenue (Million), by Powertrain Type 2024 & 2032
- Figure 13: North America On Board Charger Market Revenue Share (%), by Powertrain Type 2024 & 2032
- Figure 14: North America On Board Charger Market Revenue (Million), by Power Rating 2024 & 2032
- Figure 15: North America On Board Charger Market Revenue Share (%), by Power Rating 2024 & 2032
- Figure 16: North America On Board Charger Market Revenue (Million), by Sales Channel 2024 & 2032
- Figure 17: North America On Board Charger Market Revenue Share (%), by Sales Channel 2024 & 2032
- Figure 18: North America On Board Charger Market Revenue (Million), by Country 2024 & 2032
- Figure 19: North America On Board Charger Market Revenue Share (%), by Country 2024 & 2032
- Figure 20: Europe On Board Charger Market Revenue (Million), by Vehicle Type 2024 & 2032
- Figure 21: Europe On Board Charger Market Revenue Share (%), by Vehicle Type 2024 & 2032
- Figure 22: Europe On Board Charger Market Revenue (Million), by Powertrain Type 2024 & 2032
- Figure 23: Europe On Board Charger Market Revenue Share (%), by Powertrain Type 2024 & 2032
- Figure 24: Europe On Board Charger Market Revenue (Million), by Power Rating 2024 & 2032
- Figure 25: Europe On Board Charger Market Revenue Share (%), by Power Rating 2024 & 2032
- Figure 26: Europe On Board Charger Market Revenue (Million), by Sales Channel 2024 & 2032
- Figure 27: Europe On Board Charger Market Revenue Share (%), by Sales Channel 2024 & 2032
- Figure 28: Europe On Board Charger Market Revenue (Million), by Country 2024 & 2032
- Figure 29: Europe On Board Charger Market Revenue Share (%), by Country 2024 & 2032
- Figure 30: Asia Pacific On Board Charger Market Revenue (Million), by Vehicle Type 2024 & 2032
- Figure 31: Asia Pacific On Board Charger Market Revenue Share (%), by Vehicle Type 2024 & 2032
- Figure 32: Asia Pacific On Board Charger Market Revenue (Million), by Powertrain Type 2024 & 2032
- Figure 33: Asia Pacific On Board Charger Market Revenue Share (%), by Powertrain Type 2024 & 2032
- Figure 34: Asia Pacific On Board Charger Market Revenue (Million), by Power Rating 2024 & 2032
- Figure 35: Asia Pacific On Board Charger Market Revenue Share (%), by Power Rating 2024 & 2032
- Figure 36: Asia Pacific On Board Charger Market Revenue (Million), by Sales Channel 2024 & 2032
- Figure 37: Asia Pacific On Board Charger Market Revenue Share (%), by Sales Channel 2024 & 2032
- Figure 38: Asia Pacific On Board Charger Market Revenue (Million), by Country 2024 & 2032
- Figure 39: Asia Pacific On Board Charger Market Revenue Share (%), by Country 2024 & 2032
- Figure 40: Rest of the World On Board Charger Market Revenue (Million), by Vehicle Type 2024 & 2032
- Figure 41: Rest of the World On Board Charger Market Revenue Share (%), by Vehicle Type 2024 & 2032
- Figure 42: Rest of the World On Board Charger Market Revenue (Million), by Powertrain Type 2024 & 2032
- Figure 43: Rest of the World On Board Charger Market Revenue Share (%), by Powertrain Type 2024 & 2032
- Figure 44: Rest of the World On Board Charger Market Revenue (Million), by Power Rating 2024 & 2032
- Figure 45: Rest of the World On Board Charger Market Revenue Share (%), by Power Rating 2024 & 2032
- Figure 46: Rest of the World On Board Charger Market Revenue (Million), by Sales Channel 2024 & 2032
- Figure 47: Rest of the World On Board Charger Market Revenue Share (%), by Sales Channel 2024 & 2032
- Figure 48: Rest of the World On Board Charger Market Revenue (Million), by Country 2024 & 2032
- Figure 49: Rest of the World On Board Charger Market Revenue Share (%), by Country 2024 & 2032
List of Tables
- Table 1: Global On Board Charger Market Revenue Million Forecast, by Region 2019 & 2032
- Table 2: Global On Board Charger Market Revenue Million Forecast, by Vehicle Type 2019 & 2032
- Table 3: Global On Board Charger Market Revenue Million Forecast, by Powertrain Type 2019 & 2032
- Table 4: Global On Board Charger Market Revenue Million Forecast, by Power Rating 2019 & 2032
- Table 5: Global On Board Charger Market Revenue Million Forecast, by Sales Channel 2019 & 2032
- Table 6: Global On Board Charger Market Revenue Million Forecast, by Region 2019 & 2032
- Table 7: Global On Board Charger Market Revenue Million Forecast, by Country 2019 & 2032
- Table 8: United States On Board Charger Market Revenue (Million) Forecast, by Application 2019 & 2032
- Table 9: Canada On Board Charger Market Revenue (Million) Forecast, by Application 2019 & 2032
- Table 10: Rest of North America On Board Charger Market Revenue (Million) Forecast, by Application 2019 & 2032
- Table 11: Global On Board Charger Market Revenue Million Forecast, by Country 2019 & 2032
- Table 12: Germany On Board Charger Market Revenue (Million) Forecast, by Application 2019 & 2032
- Table 13: United Kingdom On Board Charger Market Revenue (Million) Forecast, by Application 2019 & 2032
- Table 14: France On Board Charger Market Revenue (Million) Forecast, by Application 2019 & 2032
- Table 15: Italy On Board Charger Market Revenue (Million) Forecast, by Application 2019 & 2032
- Table 16: Rest of Europe On Board Charger Market Revenue (Million) Forecast, by Application 2019 & 2032
- Table 17: Global On Board Charger Market Revenue Million Forecast, by Country 2019 & 2032
- Table 18: China On Board Charger Market Revenue (Million) Forecast, by Application 2019 & 2032
- Table 19: India On Board Charger Market Revenue (Million) Forecast, by Application 2019 & 2032
- Table 20: Japan On Board Charger Market Revenue (Million) Forecast, by Application 2019 & 2032
- Table 21: South Korea On Board Charger Market Revenue (Million) Forecast, by Application 2019 & 2032
- Table 22: Rest of Asia Pacific On Board Charger Market Revenue (Million) Forecast, by Application 2019 & 2032
- Table 23: Global On Board Charger Market Revenue Million Forecast, by Country 2019 & 2032
- Table 24: Brazil On Board Charger Market Revenue (Million) Forecast, by Application 2019 & 2032
- Table 25: Mexico On Board Charger Market Revenue (Million) Forecast, by Application 2019 & 2032
- Table 26: United Arab Emirates On Board Charger Market Revenue (Million) Forecast, by Application 2019 & 2032
- Table 27: Other Countries On Board Charger Market Revenue (Million) Forecast, by Application 2019 & 2032
- Table 28: Global On Board Charger Market Revenue Million Forecast, by Vehicle Type 2019 & 2032
- Table 29: Global On Board Charger Market Revenue Million Forecast, by Powertrain Type 2019 & 2032
- Table 30: Global On Board Charger Market Revenue Million Forecast, by Power Rating 2019 & 2032
- Table 31: Global On Board Charger Market Revenue Million Forecast, by Sales Channel 2019 & 2032
- Table 32: Global On Board Charger Market Revenue Million Forecast, by Country 2019 & 2032
- Table 33: United States On Board Charger Market Revenue (Million) Forecast, by Application 2019 & 2032
- Table 34: Canada On Board Charger Market Revenue (Million) Forecast, by Application 2019 & 2032
- Table 35: Rest of North America On Board Charger Market Revenue (Million) Forecast, by Application 2019 & 2032
- Table 36: Global On Board Charger Market Revenue Million Forecast, by Vehicle Type 2019 & 2032
- Table 37: Global On Board Charger Market Revenue Million Forecast, by Powertrain Type 2019 & 2032
- Table 38: Global On Board Charger Market Revenue Million Forecast, by Power Rating 2019 & 2032
- Table 39: Global On Board Charger Market Revenue Million Forecast, by Sales Channel 2019 & 2032
- Table 40: Global On Board Charger Market Revenue Million Forecast, by Country 2019 & 2032
- Table 41: Germany On Board Charger Market Revenue (Million) Forecast, by Application 2019 & 2032
- Table 42: United Kingdom On Board Charger Market Revenue (Million) Forecast, by Application 2019 & 2032
- Table 43: France On Board Charger Market Revenue (Million) Forecast, by Application 2019 & 2032
- Table 44: Italy On Board Charger Market Revenue (Million) Forecast, by Application 2019 & 2032
- Table 45: Rest of Europe On Board Charger Market Revenue (Million) Forecast, by Application 2019 & 2032
- Table 46: Global On Board Charger Market Revenue Million Forecast, by Vehicle Type 2019 & 2032
- Table 47: Global On Board Charger Market Revenue Million Forecast, by Powertrain Type 2019 & 2032
- Table 48: Global On Board Charger Market Revenue Million Forecast, by Power Rating 2019 & 2032
- Table 49: Global On Board Charger Market Revenue Million Forecast, by Sales Channel 2019 & 2032
- Table 50: Global On Board Charger Market Revenue Million Forecast, by Country 2019 & 2032
- Table 51: China On Board Charger Market Revenue (Million) Forecast, by Application 2019 & 2032
- Table 52: India On Board Charger Market Revenue (Million) Forecast, by Application 2019 & 2032
- Table 53: Japan On Board Charger Market Revenue (Million) Forecast, by Application 2019 & 2032
- Table 54: South Korea On Board Charger Market Revenue (Million) Forecast, by Application 2019 & 2032
- Table 55: Rest of Asia Pacific On Board Charger Market Revenue (Million) Forecast, by Application 2019 & 2032
- Table 56: Global On Board Charger Market Revenue Million Forecast, by Vehicle Type 2019 & 2032
- Table 57: Global On Board Charger Market Revenue Million Forecast, by Powertrain Type 2019 & 2032
- Table 58: Global On Board Charger Market Revenue Million Forecast, by Power Rating 2019 & 2032
- Table 59: Global On Board Charger Market Revenue Million Forecast, by Sales Channel 2019 & 2032
- Table 60: Global On Board Charger Market Revenue Million Forecast, by Country 2019 & 2032
- Table 61: Brazil On Board Charger Market Revenue (Million) Forecast, by Application 2019 & 2032
- Table 62: Mexico On Board Charger Market Revenue (Million) Forecast, by Application 2019 & 2032
- Table 63: United Arab Emirates On Board Charger Market Revenue (Million) Forecast, by Application 2019 & 2032
- Table 64: Other Countries On Board Charger Market Revenue (Million) Forecast, by Application 2019 & 2032
Frequently Asked Questions
1. What is the projected Compound Annual Growth Rate (CAGR) of the On Board Charger Market?
The projected CAGR is approximately 13.24%.
2. Which companies are prominent players in the On Board Charger Market?
Key companies in the market include Ficosa International S A, Hyundai Mobis, VisIC Technologies Ltd, Delta Energy Systems AG, Delphi Technologies (BorgWarner Inc ), Bel Fuse Inc, Brusa Elektronik AG, Toyota Industries Corporation, STMicroelectronics, Valeo SE, LG Corporation.
3. What are the main segments of the On Board Charger Market?
The market segments include Vehicle Type, Powertrain Type, Power Rating, Sales Channel.
4. Can you provide details about the market size?
The market size is estimated to be USD 6.86 Million as of 2022.
5. What are some drivers contributing to market growth?
Aggressive Government Focus to Promote the Adoption of Electric Vehicles Fosters the Growth of the Market.
6. What are the notable trends driving market growth?
The Passenger Cars Segment is Leading the On Board Charger Market.
7. Are there any restraints impacting market growth?
High Cost of On Board Chargers Hampers the Growth of the Market.
8. Can you provide examples of recent developments in the market?
March 2024: Ford announced the integration of dual on board chargers into its E-Transit electric commercial van, capable of charging at a power of 176 kW. The company stated that its latest incorporation will help vehicles charge from zero to 100% in six hours and eleven minutes when using the Ford Pro Series 2 80A charging station.
9. What pricing options are available for accessing the report?
Pricing options include single-user, multi-user, and enterprise licenses priced at USD 4750, USD 5250, and USD 8750 respectively.
10. Is the market size provided in terms of value or volume?
The market size is provided in terms of value, measured in Million.
11. Are there any specific market keywords associated with the report?
Yes, the market keyword associated with the report is "On Board Charger Market," which aids in identifying and referencing the specific market segment covered.
12. How do I determine which pricing option suits my needs best?
The pricing options vary based on user requirements and access needs. Individual users may opt for single-user licenses, while businesses requiring broader access may choose multi-user or enterprise licenses for cost-effective access to the report.
13. Are there any additional resources or data provided in the On Board Charger Market report?
While the report offers comprehensive insights, it's advisable to review the specific contents or supplementary materials provided to ascertain if additional resources or data are available.
14. How can I stay updated on further developments or reports in the On Board Charger Market?
To stay informed about further developments, trends, and reports in the On Board Charger Market, consider subscribing to industry newsletters, following relevant companies and organizations, or regularly checking reputable industry news sources and publications.
Methodology
Step 1 - Identification of Relevant Samples Size from Population Database


Step 2 - Approaches for Defining Global Market Size (Value, Volume* & Price*)

Note*: In applicable scenarios
Step 3 - Data Sources
Primary Research
- Web Analytics
- Survey Reports
- Research Institute
- Latest Research Reports
- Opinion Leaders
Secondary Research
- Annual Reports
- White Paper
- Latest Press Release
- Industry Association
- Paid Database
- Investor Presentations

Step 4 - Data Triangulation
Involves using different sources of information in order to increase the validity of a study
These sources are likely to be stakeholders in a program - participants, other researchers, program staff, other community members, and so on.
Then we put all data in single framework & apply various statistical tools to find out the dynamic on the market.
During the analysis stage, feedback from the stakeholder groups would be compared to determine areas of agreement as well as areas of divergence
