

Key Insights
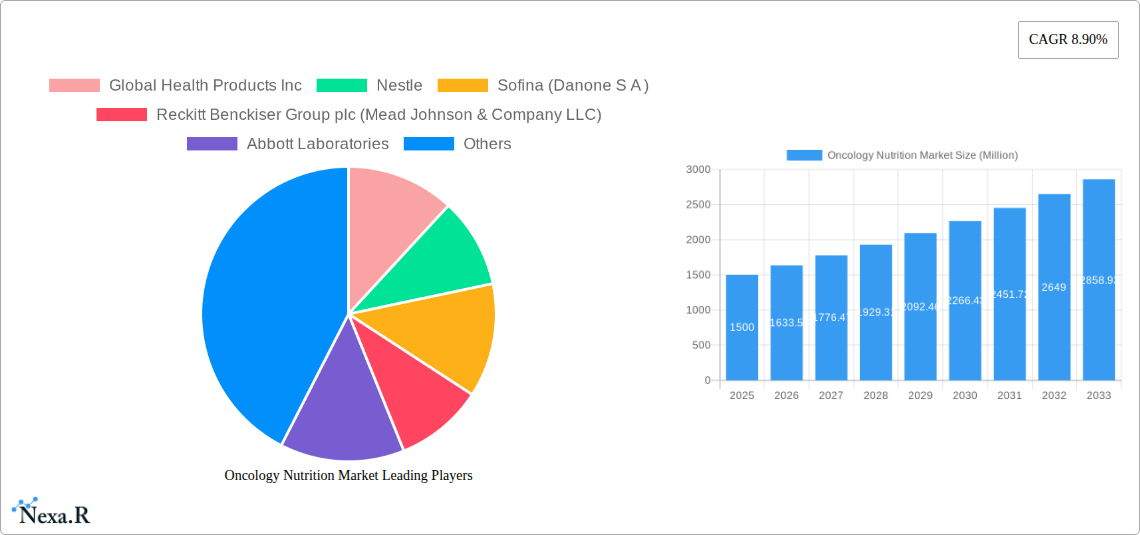
The oncology nutrition market, valued at approximately $XX million in 2025, is experiencing robust growth, projected to expand at a compound annual growth rate (CAGR) of 8.90% from 2025 to 2033. This significant expansion is fueled by several key factors. The rising prevalence of cancer globally, coupled with an aging population in many developed and developing nations, creates a substantial and growing demand for specialized nutritional products designed to support cancer patients. Furthermore, advancements in cancer treatment are leading to longer survival rates, increasing the need for nutritional interventions to manage treatment-related side effects, such as nausea, fatigue, and loss of appetite. Increased awareness among healthcare professionals and patients regarding the crucial role of nutrition in cancer management is further driving market growth. The market is segmented by cancer type, with head and neck, stomach & gastrointestinal, blood, breast, and lung cancers representing significant segments, and by end-user, with hospitals and home care settings playing a dominant role. Competition is fierce, with major players like Nestlé, Abbott Laboratories, and Fresenius Kabi, alongside specialized companies like Victus Inc., vying for market share through product innovation and strategic partnerships.
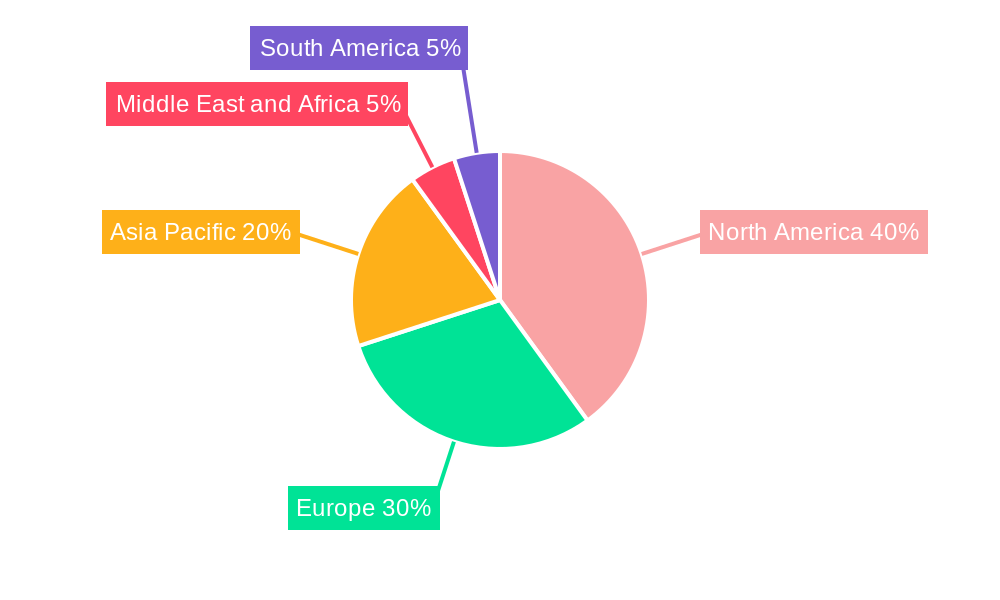
The market's growth trajectory is influenced by several trends. The increasing adoption of personalized nutrition plans tailored to individual patient needs and cancer types is gaining traction. Technological advancements in nutritional product development, such as the incorporation of functional ingredients and improved formulations, are enhancing product efficacy and appeal. Furthermore, a growing focus on preventative nutrition and the development of products aimed at reducing cancer risk are emerging trends. However, market growth is somewhat constrained by factors such as the high cost of specialized oncology nutrition products, limited insurance coverage in some regions, and challenges associated with ensuring consistent patient adherence to prescribed nutritional plans. Geographic variations in healthcare infrastructure and access to specialized nutritional support also influence market dynamics. North America and Europe currently hold substantial market shares, but the Asia-Pacific region is expected to exhibit significant growth in the coming years due to rising cancer incidence and increasing healthcare spending.
Oncology Nutrition Market: A Comprehensive Report (2019-2033)
This comprehensive report provides an in-depth analysis of the Oncology Nutrition Market, encompassing market dynamics, growth trends, regional dominance, product landscape, key players, and future outlook. The study period spans from 2019 to 2033, with 2025 serving as the base and estimated year. The forecast period covers 2025-2033, and the historical period encompasses 2019-2024. This report is crucial for industry professionals, investors, and researchers seeking a thorough understanding of this rapidly evolving market segment. The parent market is the broader nutrition market, and the child market is specifically focused on oncology nutrition products tailored for cancer patients. The market is valued at xx Million in 2025 and is projected to reach xx Million by 2033.
Oncology Nutrition Market Dynamics & Structure
The Oncology Nutrition Market exhibits a moderately concentrated structure, with key players like Nestle, Abbott Laboratories, and Fresenius Kabi holding significant market share. Technological innovation, driven by advancements in personalized nutrition and delivery systems, is a key growth driver. Stringent regulatory frameworks, particularly concerning labeling and safety standards for medical foods, significantly influence market operations. Competitive pressures arise from the availability of substitute products, including generic nutritional supplements. The end-user demographic is primarily composed of oncology patients across various cancer types, impacting product formulation and demand. Market consolidation through mergers and acquisitions (M&A) is anticipated, with deal volume estimated at xx in the past five years, reflecting a growing industry trend.
- Market Concentration: Moderately concentrated, with top 5 players holding approximately xx% market share in 2025.
- Technological Innovation: Focus on personalized nutrition, advanced delivery systems (e.g., oral, enteral, parenteral), and digital health integration.
- Regulatory Landscape: Stringent regulations concerning safety, labeling, and efficacy of medical foods and FSMPs.
- Competitive Substitutes: Generic nutritional supplements and other dietary interventions.
- End-User Demographics: Primarily oncology patients with varying needs based on cancer type, treatment phase, and overall health status.
- M&A Activity: xx deals observed between 2020-2025, indicating a trend of consolidation and strategic partnerships.
Oncology Nutrition Market Growth Trends & Insights
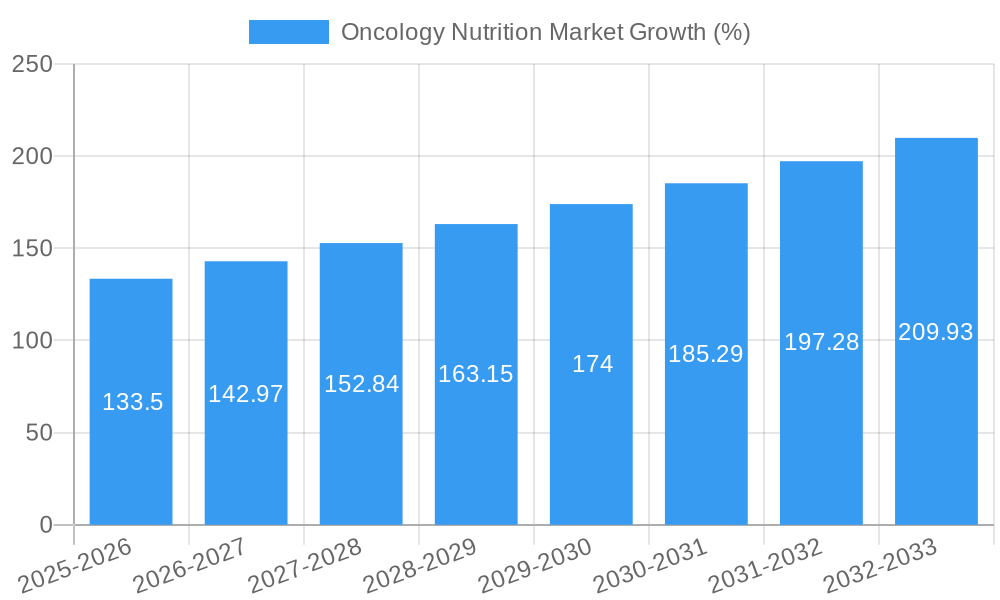
The Oncology Nutrition Market is experiencing robust growth, driven by increasing cancer prevalence, rising healthcare expenditure, and a growing awareness of the critical role of nutrition in cancer management. The market size has demonstrated a CAGR of xx% during the historical period (2019-2024) and is projected to maintain a CAGR of xx% during the forecast period (2025-2033), reaching a market value of xx Million by 2033. Market penetration remains relatively low, particularly in emerging markets, presenting significant growth opportunities. Technological disruptions, such as personalized nutrition platforms and advanced delivery systems, are further accelerating market expansion. Consumer behavior shifts, including increased health consciousness and demand for convenient and palatable products, are also impacting the market.
Dominant Regions, Countries, or Segments in Oncology Nutrition Market
North America currently dominates the Oncology Nutrition Market, driven by high cancer incidence rates, advanced healthcare infrastructure, and robust regulatory frameworks. Within cancer types, Breast Cancer and Lung Cancer represent substantial market segments due to their high prevalence. The Hospitals segment leads in end-user market share due to its significant role in providing specialized nutritional support to cancer patients. However, the Home Care segment is witnessing rapid growth due to increasing patient preference for at-home care and advancements in home-based nutritional delivery solutions.
- Key Regional Driver (North America): High cancer incidence rates, well-developed healthcare infrastructure, and high healthcare spending.
- Leading Cancer Type Segments: Breast Cancer and Lung Cancer due to high prevalence and treatment needs.
- Dominant End-User Segment: Hospitals due to its role in specialized nutritional support, followed by the rapidly growing Home Care segment.
- Growth Potential: Significant untapped potential in emerging markets due to increasing cancer awareness and improved healthcare accessibility.
Oncology Nutrition Market Product Landscape
The Oncology Nutrition Market features a diverse range of products, including oral nutritional supplements, enteral formulas, parenteral nutrition solutions, and specialized medical foods. These products are formulated to address specific nutritional deficiencies, manage side effects of cancer treatment, and support overall patient well-being. Key features include customized nutrient profiles, improved palatability, convenient formats, and enhanced safety profiles. Technological advancements are driving the development of products with enhanced bioavailability, targeted nutrient delivery, and personalized formulations based on individual patient needs.
Key Drivers, Barriers & Challenges in Oncology Nutrition Market
Key Drivers: Rising cancer incidence, increasing healthcare spending, growing awareness of the importance of nutrition in cancer care, technological advancements in product formulation and delivery, and supportive regulatory frameworks in developed markets.
Key Barriers & Challenges: High cost of specialized medical foods, limited insurance coverage in some regions, challenges in ensuring product accessibility and affordability in emerging markets, stringent regulatory hurdles for new product approvals, and intense competition from generic nutritional supplements.
Emerging Opportunities in Oncology Nutrition Market
Significant opportunities exist in the development of personalized nutrition solutions tailored to specific cancer types and individual patient needs. The integration of digital health technologies, such as telehealth platforms and remote patient monitoring systems, presents substantial opportunities for improving patient adherence and outcomes. Untapped markets in emerging economies offer substantial growth potential with increasing cancer awareness and improved healthcare infrastructure. Focus on developing products with improved palatability and convenience will further expand market access.
Growth Accelerators in the Oncology Nutrition Market Industry
Technological breakthroughs in personalized nutrition, the development of novel delivery systems, and strategic collaborations between nutrition companies and healthcare providers are key growth catalysts. Expansion into emerging markets, particularly in Asia and Africa, coupled with increased product awareness and improved affordability will further accelerate growth. Stronger regulatory frameworks facilitating market access and increased investment in clinical research support market expansion.
Key Players Shaping the Oncology Nutrition Market Market
- Global Health Products Inc
- Nestle
- Sofina (Danone S.A)
- Reckitt Benckiser Group plc (Mead Johnson & Company LLC)
- Abbott Laboratories
- Fresenius Kabi AG
- Hormel Foods Corporation
- Victus Inc
- Meiji Holdings Company Ltd
- B Braun SE
Notable Milestones in Oncology Nutrition Market Sector
- July 2022: Nestle launched China's first Foods for Special Medical Purpose (FSMP) for patients suffering from tumor-related conditions, signifying increased market access in a key emerging market.
- January 2022: Faeth Therapeutics secured USD 47 million in Series A funding, highlighting investor confidence and the potential for innovative approaches in oncology nutrition.
In-Depth Oncology Nutrition Market Market Outlook
The Oncology Nutrition Market is poised for continued robust growth, driven by several factors. The increasing prevalence of cancer globally, coupled with advancements in personalized nutrition and convenient delivery systems, will fuel market expansion. Strategic partnerships between nutrition companies and healthcare providers will improve product accessibility and patient adherence. Continued investment in research and development will lead to the introduction of innovative products with enhanced efficacy and safety profiles. This creates a positive outlook for long-term growth and significant opportunities for key players to capture market share.
Oncology Nutrition Market Segmentation
-
1. Cancer Type
- 1.1. Head & Neck Cancer
- 1.2. Stomach & Gastrointestinal Cancers
- 1.3. Blood Cancer
- 1.4. Breast Cancer
- 1.5. Lung Cancer
- 1.6. Other Cancers
-
2. End-User
- 2.1. Hospitals
- 2.2. Home Care
- 2.3. Other End-Users
Oncology Nutrition Market Segmentation By Geography
-
1. North America
- 1.1. United States
- 1.2. Canada
- 1.3. Mexico
-
2. Europe
- 2.1. Germany
- 2.2. United Kingdom
- 2.3. France
- 2.4. Italy
- 2.5. Spain
- 2.6. Rest of Europe
-
3. Asia Pacific
- 3.1. China
- 3.2. Japan
- 3.3. India
- 3.4. Australia
- 3.5. South Korea
- 3.6. Rest of Asia Pacific
-
4. Middle East and Africa
- 4.1. GCC
- 4.2. South Africa
- 4.3. Rest of Middle East and Africa
-
5. South America
- 5.1. Brazil
- 5.2. Argentina
- 5.3. Rest of South America
Oncology Nutrition Market REPORT HIGHLIGHTS
| Aspects | Details |
|---|---|
| Study Period | 2019-2033 |
| Base Year | 2024 |
| Estimated Year | 2025 |
| Forecast Period | 2025-2033 |
| Historical Period | 2019-2024 |
| Growth Rate | CAGR of 8.90% from 2019-2033 |
| Segmentation |
|
Table of Contents
- 1. Introduction
- 1.1. Research Scope
- 1.2. Market Segmentation
- 1.3. Research Methodology
- 1.4. Definitions and Assumptions
- 2. Executive Summary
- 2.1. Introduction
- 3. Market Dynamics
- 3.1. Introduction
- 3.2. Market Drivers
- 3.2.1. Rising prevalence of Cancer Worldwide; Introduction of New Oncology Nutrition Products
- 3.3. Market Restrains
- 3.3.1. High Cost of Premium Nutrition Products for Oncology
- 3.4. Market Trends
- 3.4.1. Lung Cancer is Expected to Witness a Healthy Growth Over the Forecast Period
- 4. Market Factor Analysis
- 4.1. Porters Five Forces
- 4.2. Supply/Value Chain
- 4.3. PESTEL analysis
- 4.4. Market Entropy
- 4.5. Patent/Trademark Analysis
- 5. Global Oncology Nutrition Market Analysis, Insights and Forecast, 2019-2031
- 5.1. Market Analysis, Insights and Forecast - by Cancer Type
- 5.1.1. Head & Neck Cancer
- 5.1.2. Stomach & Gastrointestinal Cancers
- 5.1.3. Blood Cancer
- 5.1.4. Breast Cancer
- 5.1.5. Lung Cancer
- 5.1.6. Other Cancers
- 5.2. Market Analysis, Insights and Forecast - by End-User
- 5.2.1. Hospitals
- 5.2.2. Home Care
- 5.2.3. Other End-Users
- 5.3. Market Analysis, Insights and Forecast - by Region
- 5.3.1. North America
- 5.3.2. Europe
- 5.3.3. Asia Pacific
- 5.3.4. Middle East and Africa
- 5.3.5. South America
- 5.1. Market Analysis, Insights and Forecast - by Cancer Type
- 6. North America Oncology Nutrition Market Analysis, Insights and Forecast, 2019-2031
- 6.1. Market Analysis, Insights and Forecast - by Cancer Type
- 6.1.1. Head & Neck Cancer
- 6.1.2. Stomach & Gastrointestinal Cancers
- 6.1.3. Blood Cancer
- 6.1.4. Breast Cancer
- 6.1.5. Lung Cancer
- 6.1.6. Other Cancers
- 6.2. Market Analysis, Insights and Forecast - by End-User
- 6.2.1. Hospitals
- 6.2.2. Home Care
- 6.2.3. Other End-Users
- 6.1. Market Analysis, Insights and Forecast - by Cancer Type
- 7. Europe Oncology Nutrition Market Analysis, Insights and Forecast, 2019-2031
- 7.1. Market Analysis, Insights and Forecast - by Cancer Type
- 7.1.1. Head & Neck Cancer
- 7.1.2. Stomach & Gastrointestinal Cancers
- 7.1.3. Blood Cancer
- 7.1.4. Breast Cancer
- 7.1.5. Lung Cancer
- 7.1.6. Other Cancers
- 7.2. Market Analysis, Insights and Forecast - by End-User
- 7.2.1. Hospitals
- 7.2.2. Home Care
- 7.2.3. Other End-Users
- 7.1. Market Analysis, Insights and Forecast - by Cancer Type
- 8. Asia Pacific Oncology Nutrition Market Analysis, Insights and Forecast, 2019-2031
- 8.1. Market Analysis, Insights and Forecast - by Cancer Type
- 8.1.1. Head & Neck Cancer
- 8.1.2. Stomach & Gastrointestinal Cancers
- 8.1.3. Blood Cancer
- 8.1.4. Breast Cancer
- 8.1.5. Lung Cancer
- 8.1.6. Other Cancers
- 8.2. Market Analysis, Insights and Forecast - by End-User
- 8.2.1. Hospitals
- 8.2.2. Home Care
- 8.2.3. Other End-Users
- 8.1. Market Analysis, Insights and Forecast - by Cancer Type
- 9. Middle East and Africa Oncology Nutrition Market Analysis, Insights and Forecast, 2019-2031
- 9.1. Market Analysis, Insights and Forecast - by Cancer Type
- 9.1.1. Head & Neck Cancer
- 9.1.2. Stomach & Gastrointestinal Cancers
- 9.1.3. Blood Cancer
- 9.1.4. Breast Cancer
- 9.1.5. Lung Cancer
- 9.1.6. Other Cancers
- 9.2. Market Analysis, Insights and Forecast - by End-User
- 9.2.1. Hospitals
- 9.2.2. Home Care
- 9.2.3. Other End-Users
- 9.1. Market Analysis, Insights and Forecast - by Cancer Type
- 10. South America Oncology Nutrition Market Analysis, Insights and Forecast, 2019-2031
- 10.1. Market Analysis, Insights and Forecast - by Cancer Type
- 10.1.1. Head & Neck Cancer
- 10.1.2. Stomach & Gastrointestinal Cancers
- 10.1.3. Blood Cancer
- 10.1.4. Breast Cancer
- 10.1.5. Lung Cancer
- 10.1.6. Other Cancers
- 10.2. Market Analysis, Insights and Forecast - by End-User
- 10.2.1. Hospitals
- 10.2.2. Home Care
- 10.2.3. Other End-Users
- 10.1. Market Analysis, Insights and Forecast - by Cancer Type
- 11. North America Oncology Nutrition Market Analysis, Insights and Forecast, 2019-2031
- 11.1. Market Analysis, Insights and Forecast - By Country/Sub-region
- 11.1.1. undefined
- 12. Europe Oncology Nutrition Market Analysis, Insights and Forecast, 2019-2031
- 12.1. Market Analysis, Insights and Forecast - By Country/Sub-region
- 12.1.1. undefined
- 13. Asia Pacific Oncology Nutrition Market Analysis, Insights and Forecast, 2019-2031
- 13.1. Market Analysis, Insights and Forecast - By Country/Sub-region
- 13.1.1. undefined
- 14. Middle East and Africa Oncology Nutrition Market Analysis, Insights and Forecast, 2019-2031
- 14.1. Market Analysis, Insights and Forecast - By Country/Sub-region
- 14.1.1. undefined
- 15. South America Oncology Nutrition Market Analysis, Insights and Forecast, 2019-2031
- 15.1. Market Analysis, Insights and Forecast - By Country/Sub-region
- 15.1.1. undefined
- 16. Competitive Analysis
- 16.1. Global Market Share Analysis 2024
- 16.2. Company Profiles
- 16.2.1 Global Health Products Inc
- 16.2.1.1. Overview
- 16.2.1.2. Products
- 16.2.1.3. SWOT Analysis
- 16.2.1.4. Recent Developments
- 16.2.1.5. Financials (Based on Availability)
- 16.2.2 Nestle
- 16.2.2.1. Overview
- 16.2.2.2. Products
- 16.2.2.3. SWOT Analysis
- 16.2.2.4. Recent Developments
- 16.2.2.5. Financials (Based on Availability)
- 16.2.3 Sofina (Danone S A )
- 16.2.3.1. Overview
- 16.2.3.2. Products
- 16.2.3.3. SWOT Analysis
- 16.2.3.4. Recent Developments
- 16.2.3.5. Financials (Based on Availability)
- 16.2.4 Reckitt Benckiser Group plc (Mead Johnson & Company LLC)
- 16.2.4.1. Overview
- 16.2.4.2. Products
- 16.2.4.3. SWOT Analysis
- 16.2.4.4. Recent Developments
- 16.2.4.5. Financials (Based on Availability)
- 16.2.5 Abbott Laboratories
- 16.2.5.1. Overview
- 16.2.5.2. Products
- 16.2.5.3. SWOT Analysis
- 16.2.5.4. Recent Developments
- 16.2.5.5. Financials (Based on Availability)
- 16.2.6 Fresenius Kabi AG
- 16.2.6.1. Overview
- 16.2.6.2. Products
- 16.2.6.3. SWOT Analysis
- 16.2.6.4. Recent Developments
- 16.2.6.5. Financials (Based on Availability)
- 16.2.7 Hormel Foods Corporation
- 16.2.7.1. Overview
- 16.2.7.2. Products
- 16.2.7.3. SWOT Analysis
- 16.2.7.4. Recent Developments
- 16.2.7.5. Financials (Based on Availability)
- 16.2.8 Victus Inc
- 16.2.8.1. Overview
- 16.2.8.2. Products
- 16.2.8.3. SWOT Analysis
- 16.2.8.4. Recent Developments
- 16.2.8.5. Financials (Based on Availability)
- 16.2.9 Meiji Holdings Company Ltd
- 16.2.9.1. Overview
- 16.2.9.2. Products
- 16.2.9.3. SWOT Analysis
- 16.2.9.4. Recent Developments
- 16.2.9.5. Financials (Based on Availability)
- 16.2.10 B Braun SE
- 16.2.10.1. Overview
- 16.2.10.2. Products
- 16.2.10.3. SWOT Analysis
- 16.2.10.4. Recent Developments
- 16.2.10.5. Financials (Based on Availability)
- 16.2.1 Global Health Products Inc
List of Figures
- Figure 1: Global Oncology Nutrition Market Revenue Breakdown (Million, %) by Region 2024 & 2032
- Figure 2: Global Oncology Nutrition Market Volume Breakdown (K Unit, %) by Region 2024 & 2032
- Figure 3: North America Oncology Nutrition Market Revenue (Million), by Country 2024 & 2032
- Figure 4: North America Oncology Nutrition Market Volume (K Unit), by Country 2024 & 2032
- Figure 5: North America Oncology Nutrition Market Revenue Share (%), by Country 2024 & 2032
- Figure 6: North America Oncology Nutrition Market Volume Share (%), by Country 2024 & 2032
- Figure 7: Europe Oncology Nutrition Market Revenue (Million), by Country 2024 & 2032
- Figure 8: Europe Oncology Nutrition Market Volume (K Unit), by Country 2024 & 2032
- Figure 9: Europe Oncology Nutrition Market Revenue Share (%), by Country 2024 & 2032
- Figure 10: Europe Oncology Nutrition Market Volume Share (%), by Country 2024 & 2032
- Figure 11: Asia Pacific Oncology Nutrition Market Revenue (Million), by Country 2024 & 2032
- Figure 12: Asia Pacific Oncology Nutrition Market Volume (K Unit), by Country 2024 & 2032
- Figure 13: Asia Pacific Oncology Nutrition Market Revenue Share (%), by Country 2024 & 2032
- Figure 14: Asia Pacific Oncology Nutrition Market Volume Share (%), by Country 2024 & 2032
- Figure 15: Middle East and Africa Oncology Nutrition Market Revenue (Million), by Country 2024 & 2032
- Figure 16: Middle East and Africa Oncology Nutrition Market Volume (K Unit), by Country 2024 & 2032
- Figure 17: Middle East and Africa Oncology Nutrition Market Revenue Share (%), by Country 2024 & 2032
- Figure 18: Middle East and Africa Oncology Nutrition Market Volume Share (%), by Country 2024 & 2032
- Figure 19: South America Oncology Nutrition Market Revenue (Million), by Country 2024 & 2032
- Figure 20: South America Oncology Nutrition Market Volume (K Unit), by Country 2024 & 2032
- Figure 21: South America Oncology Nutrition Market Revenue Share (%), by Country 2024 & 2032
- Figure 22: South America Oncology Nutrition Market Volume Share (%), by Country 2024 & 2032
- Figure 23: North America Oncology Nutrition Market Revenue (Million), by Cancer Type 2024 & 2032
- Figure 24: North America Oncology Nutrition Market Volume (K Unit), by Cancer Type 2024 & 2032
- Figure 25: North America Oncology Nutrition Market Revenue Share (%), by Cancer Type 2024 & 2032
- Figure 26: North America Oncology Nutrition Market Volume Share (%), by Cancer Type 2024 & 2032
- Figure 27: North America Oncology Nutrition Market Revenue (Million), by End-User 2024 & 2032
- Figure 28: North America Oncology Nutrition Market Volume (K Unit), by End-User 2024 & 2032
- Figure 29: North America Oncology Nutrition Market Revenue Share (%), by End-User 2024 & 2032
- Figure 30: North America Oncology Nutrition Market Volume Share (%), by End-User 2024 & 2032
- Figure 31: North America Oncology Nutrition Market Revenue (Million), by Country 2024 & 2032
- Figure 32: North America Oncology Nutrition Market Volume (K Unit), by Country 2024 & 2032
- Figure 33: North America Oncology Nutrition Market Revenue Share (%), by Country 2024 & 2032
- Figure 34: North America Oncology Nutrition Market Volume Share (%), by Country 2024 & 2032
- Figure 35: Europe Oncology Nutrition Market Revenue (Million), by Cancer Type 2024 & 2032
- Figure 36: Europe Oncology Nutrition Market Volume (K Unit), by Cancer Type 2024 & 2032
- Figure 37: Europe Oncology Nutrition Market Revenue Share (%), by Cancer Type 2024 & 2032
- Figure 38: Europe Oncology Nutrition Market Volume Share (%), by Cancer Type 2024 & 2032
- Figure 39: Europe Oncology Nutrition Market Revenue (Million), by End-User 2024 & 2032
- Figure 40: Europe Oncology Nutrition Market Volume (K Unit), by End-User 2024 & 2032
- Figure 41: Europe Oncology Nutrition Market Revenue Share (%), by End-User 2024 & 2032
- Figure 42: Europe Oncology Nutrition Market Volume Share (%), by End-User 2024 & 2032
- Figure 43: Europe Oncology Nutrition Market Revenue (Million), by Country 2024 & 2032
- Figure 44: Europe Oncology Nutrition Market Volume (K Unit), by Country 2024 & 2032
- Figure 45: Europe Oncology Nutrition Market Revenue Share (%), by Country 2024 & 2032
- Figure 46: Europe Oncology Nutrition Market Volume Share (%), by Country 2024 & 2032
- Figure 47: Asia Pacific Oncology Nutrition Market Revenue (Million), by Cancer Type 2024 & 2032
- Figure 48: Asia Pacific Oncology Nutrition Market Volume (K Unit), by Cancer Type 2024 & 2032
- Figure 49: Asia Pacific Oncology Nutrition Market Revenue Share (%), by Cancer Type 2024 & 2032
- Figure 50: Asia Pacific Oncology Nutrition Market Volume Share (%), by Cancer Type 2024 & 2032
- Figure 51: Asia Pacific Oncology Nutrition Market Revenue (Million), by End-User 2024 & 2032
- Figure 52: Asia Pacific Oncology Nutrition Market Volume (K Unit), by End-User 2024 & 2032
- Figure 53: Asia Pacific Oncology Nutrition Market Revenue Share (%), by End-User 2024 & 2032
- Figure 54: Asia Pacific Oncology Nutrition Market Volume Share (%), by End-User 2024 & 2032
- Figure 55: Asia Pacific Oncology Nutrition Market Revenue (Million), by Country 2024 & 2032
- Figure 56: Asia Pacific Oncology Nutrition Market Volume (K Unit), by Country 2024 & 2032
- Figure 57: Asia Pacific Oncology Nutrition Market Revenue Share (%), by Country 2024 & 2032
- Figure 58: Asia Pacific Oncology Nutrition Market Volume Share (%), by Country 2024 & 2032
- Figure 59: Middle East and Africa Oncology Nutrition Market Revenue (Million), by Cancer Type 2024 & 2032
- Figure 60: Middle East and Africa Oncology Nutrition Market Volume (K Unit), by Cancer Type 2024 & 2032
- Figure 61: Middle East and Africa Oncology Nutrition Market Revenue Share (%), by Cancer Type 2024 & 2032
- Figure 62: Middle East and Africa Oncology Nutrition Market Volume Share (%), by Cancer Type 2024 & 2032
- Figure 63: Middle East and Africa Oncology Nutrition Market Revenue (Million), by End-User 2024 & 2032
- Figure 64: Middle East and Africa Oncology Nutrition Market Volume (K Unit), by End-User 2024 & 2032
- Figure 65: Middle East and Africa Oncology Nutrition Market Revenue Share (%), by End-User 2024 & 2032
- Figure 66: Middle East and Africa Oncology Nutrition Market Volume Share (%), by End-User 2024 & 2032
- Figure 67: Middle East and Africa Oncology Nutrition Market Revenue (Million), by Country 2024 & 2032
- Figure 68: Middle East and Africa Oncology Nutrition Market Volume (K Unit), by Country 2024 & 2032
- Figure 69: Middle East and Africa Oncology Nutrition Market Revenue Share (%), by Country 2024 & 2032
- Figure 70: Middle East and Africa Oncology Nutrition Market Volume Share (%), by Country 2024 & 2032
- Figure 71: South America Oncology Nutrition Market Revenue (Million), by Cancer Type 2024 & 2032
- Figure 72: South America Oncology Nutrition Market Volume (K Unit), by Cancer Type 2024 & 2032
- Figure 73: South America Oncology Nutrition Market Revenue Share (%), by Cancer Type 2024 & 2032
- Figure 74: South America Oncology Nutrition Market Volume Share (%), by Cancer Type 2024 & 2032
- Figure 75: South America Oncology Nutrition Market Revenue (Million), by End-User 2024 & 2032
- Figure 76: South America Oncology Nutrition Market Volume (K Unit), by End-User 2024 & 2032
- Figure 77: South America Oncology Nutrition Market Revenue Share (%), by End-User 2024 & 2032
- Figure 78: South America Oncology Nutrition Market Volume Share (%), by End-User 2024 & 2032
- Figure 79: South America Oncology Nutrition Market Revenue (Million), by Country 2024 & 2032
- Figure 80: South America Oncology Nutrition Market Volume (K Unit), by Country 2024 & 2032
- Figure 81: South America Oncology Nutrition Market Revenue Share (%), by Country 2024 & 2032
- Figure 82: South America Oncology Nutrition Market Volume Share (%), by Country 2024 & 2032
List of Tables
- Table 1: Global Oncology Nutrition Market Revenue Million Forecast, by Region 2019 & 2032
- Table 2: Global Oncology Nutrition Market Volume K Unit Forecast, by Region 2019 & 2032
- Table 3: Global Oncology Nutrition Market Revenue Million Forecast, by Cancer Type 2019 & 2032
- Table 4: Global Oncology Nutrition Market Volume K Unit Forecast, by Cancer Type 2019 & 2032
- Table 5: Global Oncology Nutrition Market Revenue Million Forecast, by End-User 2019 & 2032
- Table 6: Global Oncology Nutrition Market Volume K Unit Forecast, by End-User 2019 & 2032
- Table 7: Global Oncology Nutrition Market Revenue Million Forecast, by Region 2019 & 2032
- Table 8: Global Oncology Nutrition Market Volume K Unit Forecast, by Region 2019 & 2032
- Table 9: Global Oncology Nutrition Market Revenue Million Forecast, by Country 2019 & 2032
- Table 10: Global Oncology Nutrition Market Volume K Unit Forecast, by Country 2019 & 2032
- Table 11: Global Oncology Nutrition Market Revenue Million Forecast, by Country 2019 & 2032
- Table 12: Global Oncology Nutrition Market Volume K Unit Forecast, by Country 2019 & 2032
- Table 13: Global Oncology Nutrition Market Revenue Million Forecast, by Country 2019 & 2032
- Table 14: Global Oncology Nutrition Market Volume K Unit Forecast, by Country 2019 & 2032
- Table 15: Global Oncology Nutrition Market Revenue Million Forecast, by Country 2019 & 2032
- Table 16: Global Oncology Nutrition Market Volume K Unit Forecast, by Country 2019 & 2032
- Table 17: Global Oncology Nutrition Market Revenue Million Forecast, by Country 2019 & 2032
- Table 18: Global Oncology Nutrition Market Volume K Unit Forecast, by Country 2019 & 2032
- Table 19: Global Oncology Nutrition Market Revenue Million Forecast, by Cancer Type 2019 & 2032
- Table 20: Global Oncology Nutrition Market Volume K Unit Forecast, by Cancer Type 2019 & 2032
- Table 21: Global Oncology Nutrition Market Revenue Million Forecast, by End-User 2019 & 2032
- Table 22: Global Oncology Nutrition Market Volume K Unit Forecast, by End-User 2019 & 2032
- Table 23: Global Oncology Nutrition Market Revenue Million Forecast, by Country 2019 & 2032
- Table 24: Global Oncology Nutrition Market Volume K Unit Forecast, by Country 2019 & 2032
- Table 25: United States Oncology Nutrition Market Revenue (Million) Forecast, by Application 2019 & 2032
- Table 26: United States Oncology Nutrition Market Volume (K Unit) Forecast, by Application 2019 & 2032
- Table 27: Canada Oncology Nutrition Market Revenue (Million) Forecast, by Application 2019 & 2032
- Table 28: Canada Oncology Nutrition Market Volume (K Unit) Forecast, by Application 2019 & 2032
- Table 29: Mexico Oncology Nutrition Market Revenue (Million) Forecast, by Application 2019 & 2032
- Table 30: Mexico Oncology Nutrition Market Volume (K Unit) Forecast, by Application 2019 & 2032
- Table 31: Global Oncology Nutrition Market Revenue Million Forecast, by Cancer Type 2019 & 2032
- Table 32: Global Oncology Nutrition Market Volume K Unit Forecast, by Cancer Type 2019 & 2032
- Table 33: Global Oncology Nutrition Market Revenue Million Forecast, by End-User 2019 & 2032
- Table 34: Global Oncology Nutrition Market Volume K Unit Forecast, by End-User 2019 & 2032
- Table 35: Global Oncology Nutrition Market Revenue Million Forecast, by Country 2019 & 2032
- Table 36: Global Oncology Nutrition Market Volume K Unit Forecast, by Country 2019 & 2032
- Table 37: Germany Oncology Nutrition Market Revenue (Million) Forecast, by Application 2019 & 2032
- Table 38: Germany Oncology Nutrition Market Volume (K Unit) Forecast, by Application 2019 & 2032
- Table 39: United Kingdom Oncology Nutrition Market Revenue (Million) Forecast, by Application 2019 & 2032
- Table 40: United Kingdom Oncology Nutrition Market Volume (K Unit) Forecast, by Application 2019 & 2032
- Table 41: France Oncology Nutrition Market Revenue (Million) Forecast, by Application 2019 & 2032
- Table 42: France Oncology Nutrition Market Volume (K Unit) Forecast, by Application 2019 & 2032
- Table 43: Italy Oncology Nutrition Market Revenue (Million) Forecast, by Application 2019 & 2032
- Table 44: Italy Oncology Nutrition Market Volume (K Unit) Forecast, by Application 2019 & 2032
- Table 45: Spain Oncology Nutrition Market Revenue (Million) Forecast, by Application 2019 & 2032
- Table 46: Spain Oncology Nutrition Market Volume (K Unit) Forecast, by Application 2019 & 2032
- Table 47: Rest of Europe Oncology Nutrition Market Revenue (Million) Forecast, by Application 2019 & 2032
- Table 48: Rest of Europe Oncology Nutrition Market Volume (K Unit) Forecast, by Application 2019 & 2032
- Table 49: Global Oncology Nutrition Market Revenue Million Forecast, by Cancer Type 2019 & 2032
- Table 50: Global Oncology Nutrition Market Volume K Unit Forecast, by Cancer Type 2019 & 2032
- Table 51: Global Oncology Nutrition Market Revenue Million Forecast, by End-User 2019 & 2032
- Table 52: Global Oncology Nutrition Market Volume K Unit Forecast, by End-User 2019 & 2032
- Table 53: Global Oncology Nutrition Market Revenue Million Forecast, by Country 2019 & 2032
- Table 54: Global Oncology Nutrition Market Volume K Unit Forecast, by Country 2019 & 2032
- Table 55: China Oncology Nutrition Market Revenue (Million) Forecast, by Application 2019 & 2032
- Table 56: China Oncology Nutrition Market Volume (K Unit) Forecast, by Application 2019 & 2032
- Table 57: Japan Oncology Nutrition Market Revenue (Million) Forecast, by Application 2019 & 2032
- Table 58: Japan Oncology Nutrition Market Volume (K Unit) Forecast, by Application 2019 & 2032
- Table 59: India Oncology Nutrition Market Revenue (Million) Forecast, by Application 2019 & 2032
- Table 60: India Oncology Nutrition Market Volume (K Unit) Forecast, by Application 2019 & 2032
- Table 61: Australia Oncology Nutrition Market Revenue (Million) Forecast, by Application 2019 & 2032
- Table 62: Australia Oncology Nutrition Market Volume (K Unit) Forecast, by Application 2019 & 2032
- Table 63: South Korea Oncology Nutrition Market Revenue (Million) Forecast, by Application 2019 & 2032
- Table 64: South Korea Oncology Nutrition Market Volume (K Unit) Forecast, by Application 2019 & 2032
- Table 65: Rest of Asia Pacific Oncology Nutrition Market Revenue (Million) Forecast, by Application 2019 & 2032
- Table 66: Rest of Asia Pacific Oncology Nutrition Market Volume (K Unit) Forecast, by Application 2019 & 2032
- Table 67: Global Oncology Nutrition Market Revenue Million Forecast, by Cancer Type 2019 & 2032
- Table 68: Global Oncology Nutrition Market Volume K Unit Forecast, by Cancer Type 2019 & 2032
- Table 69: Global Oncology Nutrition Market Revenue Million Forecast, by End-User 2019 & 2032
- Table 70: Global Oncology Nutrition Market Volume K Unit Forecast, by End-User 2019 & 2032
- Table 71: Global Oncology Nutrition Market Revenue Million Forecast, by Country 2019 & 2032
- Table 72: Global Oncology Nutrition Market Volume K Unit Forecast, by Country 2019 & 2032
- Table 73: GCC Oncology Nutrition Market Revenue (Million) Forecast, by Application 2019 & 2032
- Table 74: GCC Oncology Nutrition Market Volume (K Unit) Forecast, by Application 2019 & 2032
- Table 75: South Africa Oncology Nutrition Market Revenue (Million) Forecast, by Application 2019 & 2032
- Table 76: South Africa Oncology Nutrition Market Volume (K Unit) Forecast, by Application 2019 & 2032
- Table 77: Rest of Middle East and Africa Oncology Nutrition Market Revenue (Million) Forecast, by Application 2019 & 2032
- Table 78: Rest of Middle East and Africa Oncology Nutrition Market Volume (K Unit) Forecast, by Application 2019 & 2032
- Table 79: Global Oncology Nutrition Market Revenue Million Forecast, by Cancer Type 2019 & 2032
- Table 80: Global Oncology Nutrition Market Volume K Unit Forecast, by Cancer Type 2019 & 2032
- Table 81: Global Oncology Nutrition Market Revenue Million Forecast, by End-User 2019 & 2032
- Table 82: Global Oncology Nutrition Market Volume K Unit Forecast, by End-User 2019 & 2032
- Table 83: Global Oncology Nutrition Market Revenue Million Forecast, by Country 2019 & 2032
- Table 84: Global Oncology Nutrition Market Volume K Unit Forecast, by Country 2019 & 2032
- Table 85: Brazil Oncology Nutrition Market Revenue (Million) Forecast, by Application 2019 & 2032
- Table 86: Brazil Oncology Nutrition Market Volume (K Unit) Forecast, by Application 2019 & 2032
- Table 87: Argentina Oncology Nutrition Market Revenue (Million) Forecast, by Application 2019 & 2032
- Table 88: Argentina Oncology Nutrition Market Volume (K Unit) Forecast, by Application 2019 & 2032
- Table 89: Rest of South America Oncology Nutrition Market Revenue (Million) Forecast, by Application 2019 & 2032
- Table 90: Rest of South America Oncology Nutrition Market Volume (K Unit) Forecast, by Application 2019 & 2032
Frequently Asked Questions
1. What is the projected Compound Annual Growth Rate (CAGR) of the Oncology Nutrition Market?
The projected CAGR is approximately 8.90%.
2. Which companies are prominent players in the Oncology Nutrition Market?
Key companies in the market include Global Health Products Inc, Nestle, Sofina (Danone S A ), Reckitt Benckiser Group plc (Mead Johnson & Company LLC), Abbott Laboratories, Fresenius Kabi AG, Hormel Foods Corporation, Victus Inc, Meiji Holdings Company Ltd, B Braun SE.
3. What are the main segments of the Oncology Nutrition Market?
The market segments include Cancer Type, End-User.
4. Can you provide details about the market size?
The market size is estimated to be USD XX Million as of 2022.
5. What are some drivers contributing to market growth?
Rising prevalence of Cancer Worldwide; Introduction of New Oncology Nutrition Products.
6. What are the notable trends driving market growth?
Lung Cancer is Expected to Witness a Healthy Growth Over the Forecast Period.
7. Are there any restraints impacting market growth?
High Cost of Premium Nutrition Products for Oncology.
8. Can you provide examples of recent developments in the market?
July 2022: Nestle launched China's first Foods for Special Medical Purpose (FSMP) for patients suffering from tumor-related conditions, after going through a five-year-long approval process from the Chinese regulator.
9. What pricing options are available for accessing the report?
Pricing options include single-user, multi-user, and enterprise licenses priced at USD 4750, USD 5250, and USD 8750 respectively.
10. Is the market size provided in terms of value or volume?
The market size is provided in terms of value, measured in Million and volume, measured in K Unit.
11. Are there any specific market keywords associated with the report?
Yes, the market keyword associated with the report is "Oncology Nutrition Market," which aids in identifying and referencing the specific market segment covered.
12. How do I determine which pricing option suits my needs best?
The pricing options vary based on user requirements and access needs. Individual users may opt for single-user licenses, while businesses requiring broader access may choose multi-user or enterprise licenses for cost-effective access to the report.
13. Are there any additional resources or data provided in the Oncology Nutrition Market report?
While the report offers comprehensive insights, it's advisable to review the specific contents or supplementary materials provided to ascertain if additional resources or data are available.
14. How can I stay updated on further developments or reports in the Oncology Nutrition Market?
To stay informed about further developments, trends, and reports in the Oncology Nutrition Market, consider subscribing to industry newsletters, following relevant companies and organizations, or regularly checking reputable industry news sources and publications.
Methodology
Step 1 - Identification of Relevant Samples Size from Population Database


Step 2 - Approaches for Defining Global Market Size (Value, Volume* & Price*)

Note*: In applicable scenarios
Step 3 - Data Sources
Primary Research
- Web Analytics
- Survey Reports
- Research Institute
- Latest Research Reports
- Opinion Leaders
Secondary Research
- Annual Reports
- White Paper
- Latest Press Release
- Industry Association
- Paid Database
- Investor Presentations

Step 4 - Data Triangulation
Involves using different sources of information in order to increase the validity of a study
These sources are likely to be stakeholders in a program - participants, other researchers, program staff, other community members, and so on.
Then we put all data in single framework & apply various statistical tools to find out the dynamic on the market.
During the analysis stage, feedback from the stakeholder groups would be compared to determine areas of agreement as well as areas of divergence
