

Key Insights
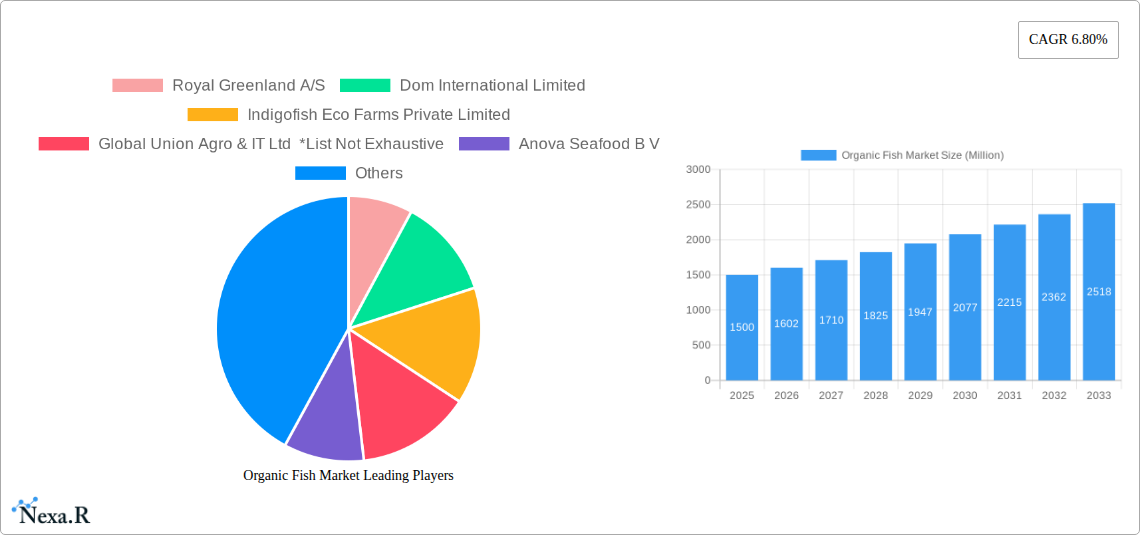
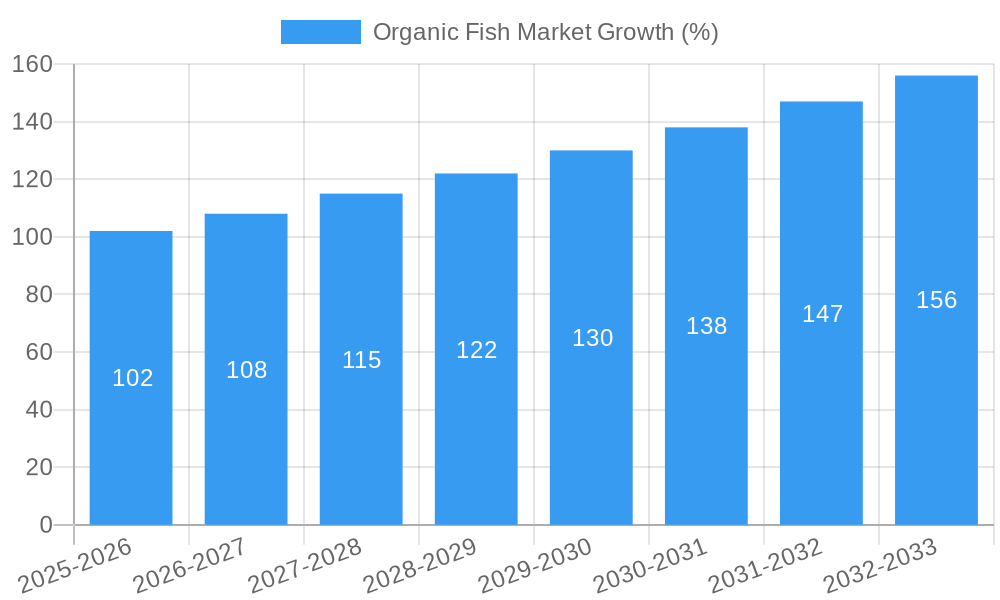
The global organic fish market, currently experiencing robust growth, is projected to maintain a Compound Annual Growth Rate (CAGR) of 6.80% from 2025 to 2033. This expansion is fueled by several key drivers. Increasing consumer awareness of the health benefits associated with organic food, including reduced exposure to harmful chemicals and antibiotics, is a primary factor. Growing concerns about the environmental impact of conventional aquaculture practices are also significantly impacting consumer choices, driving demand for sustainably sourced, organic fish. The rising disposable incomes in developing economies, particularly in Asia-Pacific, are further bolstering market growth, as consumers increasingly prioritize premium, high-quality food products. Market segmentation reveals a preference for fresh/chilled organic fish, followed by frozen/canned options. The off-trade channel (supermarkets, retail stores) currently dominates distribution, but the on-trade sector (restaurants, hotels) is showing promising growth potential, driven by the rising popularity of sustainable seafood in the food service industry. While the market faces challenges such as the higher production costs associated with organic aquaculture and potential supply chain limitations, the overall market outlook remains positive, driven by sustained consumer demand and increasing industry efforts towards sustainable practices.
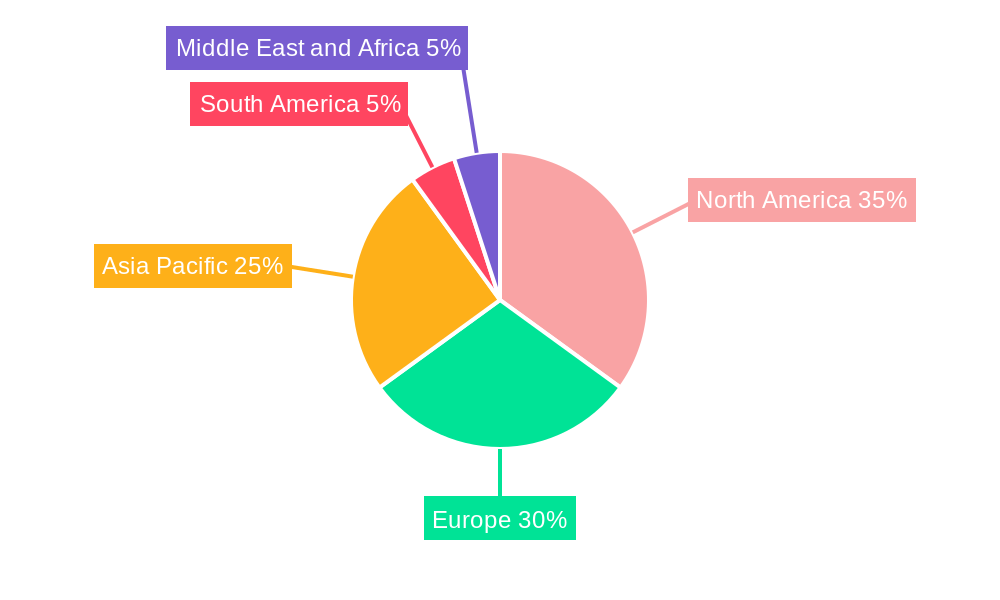
The market is segmented by form (fresh/chilled, frozen/canned, processed), distribution channel (on-trade, off-trade), and type (salmon, tuna, other types). Salmon and tuna currently dominate the type segment, reflecting strong consumer preference and established market presence. However, the "other types" segment, encompassing a variety of organic fish species, presents substantial growth opportunities as consumer palates diversify and awareness of diverse, sustainable options increases. Geographical analysis reveals a strong market presence in North America and Europe, driven by high consumer demand and established distribution networks. However, the Asia-Pacific region presents the most significant growth potential due to its rapidly expanding middle class and increasing focus on health and wellness. Major players in the market include Royal Greenland A/S, Dom International Limited, and Mowi ASA, among others. These companies are investing heavily in research and development, sustainable aquaculture practices, and expanding their product portfolios to cater to the growing demand for organic fish. The competitive landscape is dynamic, characterized by both established players and emerging smaller companies focusing on niche organic fish species and sustainable farming methods.
Organic Fish Market: A Comprehensive Market Report (2019-2033)
This in-depth report provides a comprehensive analysis of the global organic fish market, encompassing market dynamics, growth trends, regional insights, product landscape, key players, and future outlook. The report covers the period 2019-2033, with a focus on 2025 as the base and estimated year. The study period includes historical data (2019-2024) and a forecast (2025-2033). The market is segmented by form (fresh/chilled, frozen/canned, processed), distribution channel (on-trade, off-trade), and type (salmon, tuna, other types). The total market size in 2025 is estimated at XX Million and is projected to reach XX Million by 2033.
Organic Fish Market Dynamics & Structure
The organic fish market is characterized by moderate concentration, with several key players holding significant market share. However, the presence of numerous smaller, specialized producers contributes to a dynamic competitive landscape. Technological innovations, particularly in sustainable aquaculture practices and packaging, are driving growth. Stringent regulatory frameworks, focusing on sustainability and food safety, are shaping market dynamics. Consumers' increasing preference for health-conscious food choices and growing awareness of environmental concerns are primary drivers of market expansion. The rise of plant-based alternatives poses a competitive threat, but the unique nutritional benefits and taste of organic fish maintain strong demand. Mergers and acquisitions (M&A) activity is moderate, primarily focused on expanding market reach and product portfolios.
- Market Concentration: Moderately concentrated, with top 5 players holding approximately XX% of market share in 2025.
- Technological Innovation: Focus on sustainable aquaculture, improved processing techniques, and eco-friendly packaging.
- Regulatory Framework: Stringent regulations related to organic certification, traceability, and sustainability.
- Competitive Substitutes: Plant-based alternatives (e.g., tofu, tempeh) pose a growing threat.
- End-User Demographics: Growing demand among health-conscious consumers and those concerned about environmental sustainability.
- M&A Activity: Moderate M&A activity, primarily driven by expansion strategies and diversification of product portfolios (XX deals in the last 5 years).
Organic Fish Market Growth Trends & Insights
The organic fish market is experiencing robust growth, driven by increasing consumer demand for healthy and sustainably sourced seafood. The market witnessed a CAGR of XX% during the historical period (2019-2024) and is projected to maintain a CAGR of XX% during the forecast period (2025-2033). This growth is fueled by rising disposable incomes, particularly in developing economies, and a growing awareness of the health benefits of omega-3 fatty acids found in organic fish. Technological advancements in aquaculture are improving efficiency and reducing the environmental impact of fish farming. Consumer behavior shifts towards sustainable and ethical consumption patterns further contribute to market expansion. Market penetration of organic fish is still relatively low, indicating significant growth potential.
(Detailed quantitative data, including specific CAGR figures and market penetration rates, will be presented within the full report.)
Dominant Regions, Countries, or Segments in Organic Fish Market
The North American and European markets currently dominate the organic fish market, driven by high consumer demand and strong regulatory frameworks supporting organic farming practices. Within these regions, countries like the US, Canada, Norway, and the UK are leading in terms of both consumption and production. Among segments, the fresh/chilled segment holds the largest market share, followed by frozen/canned and then processed. The salmon segment remains dominant due to its popularity and higher price point. The off-trade distribution channel is currently the more significant, but the on-trade channel is showing promising growth.
- Key Drivers:
- High consumer disposable income in developed nations.
- Strong regulatory support for organic aquaculture and farming.
- Growing awareness of health benefits and environmental concerns.
- Developed infrastructure for distribution and retail.
- Dominant Regions: North America and Europe.
- Dominant Segments: Fresh/Chilled, Salmon, Off-trade.
(Detailed regional and segmental breakdowns with market share and growth potential analysis will be provided in the full report.)
Organic Fish Market Product Landscape
The organic fish market offers a diverse range of products, including fresh, frozen, canned, and processed options. Innovation focuses on enhancing product quality, extending shelf life, and promoting sustainable packaging. Companies are increasingly emphasizing traceability and transparency to build consumer trust. Key product differentiators include certifications (e.g., organic, sustainable), sourcing practices, and value-added features (e.g., pre-portioned fillets, marinated products). Technological advancements in processing and packaging are leading to improved product quality and reduced waste.
Key Drivers, Barriers & Challenges in Organic Fish Market
Key Drivers:
- Growing consumer awareness of health and environmental benefits.
- Increasing demand for sustainable and ethically sourced food.
- Technological advancements in aquaculture and processing.
- Government support and regulations promoting organic farming.
Challenges & Restraints:
- High production costs compared to conventional fish farming.
- Limited availability and higher prices impacting market accessibility.
- Potential for supply chain disruptions due to climate change and disease outbreaks.
- Strict regulations and certifications increasing operational complexities.
Emerging Opportunities in Organic Fish Market
- Expansion into developing markets with growing middle classes.
- Development of innovative value-added products.
- Growing demand for convenient and ready-to-eat organic fish products.
- Exploration of alternative aquaculture technologies to improve sustainability and efficiency.
Growth Accelerators in the Organic Fish Market Industry
Technological breakthroughs in sustainable aquaculture, strategic partnerships between producers and retailers to enhance supply chain efficiency, and expansion into new geographic markets with rising demand are key catalysts driving long-term growth in the organic fish market. Investment in research and development to improve farming practices and reduce environmental impact is also crucial for sustainable growth.
Key Players Shaping the Organic Fish Market Market
- Royal Greenland A/S
- Dom International Limited
- Indigofish Eco Farms Private Limited
- Global Union Agro & IT Ltd
- Anova Seafood B V
- Coombe Farm Organic
- Artisanfish LLC
- Glenarm Organic Salmon Ltd
- Mowi ASA
- The Irish Organic Salmon Co
Notable Milestones in Organic Fish Market Sector
- February 2022: MOWI launched new organic Scottish salmon products on Ocado, expanding its product range with Soil Association-verified fillets and smoked slices.
- January 2022: Organic Sea Harvest launched a plastic-free, compostable packaging solution for its organic salmon.
In-Depth Organic Fish Market Market Outlook
The organic fish market is poised for significant growth in the coming years, driven by increasing consumer demand for healthy and sustainably sourced seafood. Strategic partnerships, technological advancements, and expansion into new markets will further accelerate growth. Companies focused on innovation, sustainability, and transparency will be best positioned to capitalize on the expanding market opportunities. The focus on traceability and environmentally friendly practices will be key to success.
Organic Fish Market Segmentation
-
1. Type
- 1.1. Salmon
- 1.2. Tuna
- 1.3. Other Types
-
2. Form
- 2.1. Fresh/Chilled
- 2.2. Frozen/Canned
- 2.3. Processed
-
3. Distribution Channel
- 3.1. On-Trade
-
3.2. Off-Trade
- 3.2.1. Convenience/Grocery Stores
- 3.2.2. Online Retail Stores
Organic Fish Market Segmentation By Geography
-
1. North America
- 1.1. United States
- 1.2. Canada
- 1.3. Mexico
- 1.4. Rest of North America
-
2. Europe
- 2.1. Spain
- 2.2. United Kingdom
- 2.3. Germany
- 2.4. France
- 2.5. Italy
- 2.6. Russia
- 2.7. Rest of Europe
-
3. Asia Pacific
- 3.1. China
- 3.2. Japan
- 3.3. India
- 3.4. Australia
- 3.5. Rest of Asia Pacific
-
4. South America
- 4.1. Brazil
- 4.2. Argentina
- 4.3. Rest of South America
-
5. Middle East and Africa
- 5.1. South Africa
- 5.2. Saudi Arabia
- 5.3. Rest of Middle East and Africa
Organic Fish Market REPORT HIGHLIGHTS
| Aspects | Details |
|---|---|
| Study Period | 2019-2033 |
| Base Year | 2024 |
| Estimated Year | 2025 |
| Forecast Period | 2025-2033 |
| Historical Period | 2019-2024 |
| Growth Rate | CAGR of 6.80% from 2019-2033 |
| Segmentation |
|
Table of Contents
- 1. Introduction
- 1.1. Research Scope
- 1.2. Market Segmentation
- 1.3. Research Methodology
- 1.4. Definitions and Assumptions
- 2. Executive Summary
- 2.1. Introduction
- 3. Market Dynamics
- 3.1. Introduction
- 3.2. Market Drivers
- 3.2.1. Increasing Demand for Processed Food Products; Technological Advancements Supporting Market Growth
- 3.3. Market Restrains
- 3.3.1. Increasing Cost of Production Due to Rise in Energy and Labor Cost
- 3.4. Market Trends
- 3.4.1. Rising Health Awareness Promoting Demand
- 4. Market Factor Analysis
- 4.1. Porters Five Forces
- 4.2. Supply/Value Chain
- 4.3. PESTEL analysis
- 4.4. Market Entropy
- 4.5. Patent/Trademark Analysis
- 5. Global Organic Fish Market Analysis, Insights and Forecast, 2019-2031
- 5.1. Market Analysis, Insights and Forecast - by Type
- 5.1.1. Salmon
- 5.1.2. Tuna
- 5.1.3. Other Types
- 5.2. Market Analysis, Insights and Forecast - by Form
- 5.2.1. Fresh/Chilled
- 5.2.2. Frozen/Canned
- 5.2.3. Processed
- 5.3. Market Analysis, Insights and Forecast - by Distribution Channel
- 5.3.1. On-Trade
- 5.3.2. Off-Trade
- 5.3.2.1. Convenience/Grocery Stores
- 5.3.2.2. Online Retail Stores
- 5.4. Market Analysis, Insights and Forecast - by Region
- 5.4.1. North America
- 5.4.2. Europe
- 5.4.3. Asia Pacific
- 5.4.4. South America
- 5.4.5. Middle East and Africa
- 5.1. Market Analysis, Insights and Forecast - by Type
- 6. North America Organic Fish Market Analysis, Insights and Forecast, 2019-2031
- 6.1. Market Analysis, Insights and Forecast - by Type
- 6.1.1. Salmon
- 6.1.2. Tuna
- 6.1.3. Other Types
- 6.2. Market Analysis, Insights and Forecast - by Form
- 6.2.1. Fresh/Chilled
- 6.2.2. Frozen/Canned
- 6.2.3. Processed
- 6.3. Market Analysis, Insights and Forecast - by Distribution Channel
- 6.3.1. On-Trade
- 6.3.2. Off-Trade
- 6.3.2.1. Convenience/Grocery Stores
- 6.3.2.2. Online Retail Stores
- 6.1. Market Analysis, Insights and Forecast - by Type
- 7. Europe Organic Fish Market Analysis, Insights and Forecast, 2019-2031
- 7.1. Market Analysis, Insights and Forecast - by Type
- 7.1.1. Salmon
- 7.1.2. Tuna
- 7.1.3. Other Types
- 7.2. Market Analysis, Insights and Forecast - by Form
- 7.2.1. Fresh/Chilled
- 7.2.2. Frozen/Canned
- 7.2.3. Processed
- 7.3. Market Analysis, Insights and Forecast - by Distribution Channel
- 7.3.1. On-Trade
- 7.3.2. Off-Trade
- 7.3.2.1. Convenience/Grocery Stores
- 7.3.2.2. Online Retail Stores
- 7.1. Market Analysis, Insights and Forecast - by Type
- 8. Asia Pacific Organic Fish Market Analysis, Insights and Forecast, 2019-2031
- 8.1. Market Analysis, Insights and Forecast - by Type
- 8.1.1. Salmon
- 8.1.2. Tuna
- 8.1.3. Other Types
- 8.2. Market Analysis, Insights and Forecast - by Form
- 8.2.1. Fresh/Chilled
- 8.2.2. Frozen/Canned
- 8.2.3. Processed
- 8.3. Market Analysis, Insights and Forecast - by Distribution Channel
- 8.3.1. On-Trade
- 8.3.2. Off-Trade
- 8.3.2.1. Convenience/Grocery Stores
- 8.3.2.2. Online Retail Stores
- 8.1. Market Analysis, Insights and Forecast - by Type
- 9. South America Organic Fish Market Analysis, Insights and Forecast, 2019-2031
- 9.1. Market Analysis, Insights and Forecast - by Type
- 9.1.1. Salmon
- 9.1.2. Tuna
- 9.1.3. Other Types
- 9.2. Market Analysis, Insights and Forecast - by Form
- 9.2.1. Fresh/Chilled
- 9.2.2. Frozen/Canned
- 9.2.3. Processed
- 9.3. Market Analysis, Insights and Forecast - by Distribution Channel
- 9.3.1. On-Trade
- 9.3.2. Off-Trade
- 9.3.2.1. Convenience/Grocery Stores
- 9.3.2.2. Online Retail Stores
- 9.1. Market Analysis, Insights and Forecast - by Type
- 10. Middle East and Africa Organic Fish Market Analysis, Insights and Forecast, 2019-2031
- 10.1. Market Analysis, Insights and Forecast - by Type
- 10.1.1. Salmon
- 10.1.2. Tuna
- 10.1.3. Other Types
- 10.2. Market Analysis, Insights and Forecast - by Form
- 10.2.1. Fresh/Chilled
- 10.2.2. Frozen/Canned
- 10.2.3. Processed
- 10.3. Market Analysis, Insights and Forecast - by Distribution Channel
- 10.3.1. On-Trade
- 10.3.2. Off-Trade
- 10.3.2.1. Convenience/Grocery Stores
- 10.3.2.2. Online Retail Stores
- 10.1. Market Analysis, Insights and Forecast - by Type
- 11. North America Organic Fish Market Analysis, Insights and Forecast, 2019-2031
- 11.1. Market Analysis, Insights and Forecast - By Country/Sub-region
- 11.1.1 United States
- 11.1.2 Canada
- 11.1.3 Mexico
- 11.1.4 Rest of North America
- 12. Europe Organic Fish Market Analysis, Insights and Forecast, 2019-2031
- 12.1. Market Analysis, Insights and Forecast - By Country/Sub-region
- 12.1.1 Spain
- 12.1.2 United Kingdom
- 12.1.3 Germany
- 12.1.4 France
- 12.1.5 Italy
- 12.1.6 Russia
- 12.1.7 Rest of Europe
- 13. Asia Pacific Organic Fish Market Analysis, Insights and Forecast, 2019-2031
- 13.1. Market Analysis, Insights and Forecast - By Country/Sub-region
- 13.1.1 China
- 13.1.2 Japan
- 13.1.3 India
- 13.1.4 Australia
- 13.1.5 Rest of Asia Pacific
- 14. South America Organic Fish Market Analysis, Insights and Forecast, 2019-2031
- 14.1. Market Analysis, Insights and Forecast - By Country/Sub-region
- 14.1.1 Brazil
- 14.1.2 Argentina
- 14.1.3 Rest of South America
- 15. Middle East and Africa Organic Fish Market Analysis, Insights and Forecast, 2019-2031
- 15.1. Market Analysis, Insights and Forecast - By Country/Sub-region
- 15.1.1 South Africa
- 15.1.2 Saudi Arabia
- 15.1.3 Rest of Middle East and Africa
- 16. Competitive Analysis
- 16.1. Global Market Share Analysis 2024
- 16.2. Company Profiles
- 16.2.1 Royal Greenland A/S
- 16.2.1.1. Overview
- 16.2.1.2. Products
- 16.2.1.3. SWOT Analysis
- 16.2.1.4. Recent Developments
- 16.2.1.5. Financials (Based on Availability)
- 16.2.2 Dom International Limited
- 16.2.2.1. Overview
- 16.2.2.2. Products
- 16.2.2.3. SWOT Analysis
- 16.2.2.4. Recent Developments
- 16.2.2.5. Financials (Based on Availability)
- 16.2.3 Indigofish Eco Farms Private Limited
- 16.2.3.1. Overview
- 16.2.3.2. Products
- 16.2.3.3. SWOT Analysis
- 16.2.3.4. Recent Developments
- 16.2.3.5. Financials (Based on Availability)
- 16.2.4 Global Union Agro & IT Ltd *List Not Exhaustive
- 16.2.4.1. Overview
- 16.2.4.2. Products
- 16.2.4.3. SWOT Analysis
- 16.2.4.4. Recent Developments
- 16.2.4.5. Financials (Based on Availability)
- 16.2.5 Anova Seafood B V
- 16.2.5.1. Overview
- 16.2.5.2. Products
- 16.2.5.3. SWOT Analysis
- 16.2.5.4. Recent Developments
- 16.2.5.5. Financials (Based on Availability)
- 16.2.6 Coombe Farm Organic
- 16.2.6.1. Overview
- 16.2.6.2. Products
- 16.2.6.3. SWOT Analysis
- 16.2.6.4. Recent Developments
- 16.2.6.5. Financials (Based on Availability)
- 16.2.7 Artisanfish LLC
- 16.2.7.1. Overview
- 16.2.7.2. Products
- 16.2.7.3. SWOT Analysis
- 16.2.7.4. Recent Developments
- 16.2.7.5. Financials (Based on Availability)
- 16.2.8 Glenarm Organic Salmon Ltd
- 16.2.8.1. Overview
- 16.2.8.2. Products
- 16.2.8.3. SWOT Analysis
- 16.2.8.4. Recent Developments
- 16.2.8.5. Financials (Based on Availability)
- 16.2.9 Mowi ASA
- 16.2.9.1. Overview
- 16.2.9.2. Products
- 16.2.9.3. SWOT Analysis
- 16.2.9.4. Recent Developments
- 16.2.9.5. Financials (Based on Availability)
- 16.2.10 The Irish Organic Salmon Co
- 16.2.10.1. Overview
- 16.2.10.2. Products
- 16.2.10.3. SWOT Analysis
- 16.2.10.4. Recent Developments
- 16.2.10.5. Financials (Based on Availability)
- 16.2.1 Royal Greenland A/S
List of Figures
- Figure 1: Global Organic Fish Market Revenue Breakdown (Million, %) by Region 2024 & 2032
- Figure 2: Global Organic Fish Market Volume Breakdown (k Tons, %) by Region 2024 & 2032
- Figure 3: North America Organic Fish Market Revenue (Million), by Country 2024 & 2032
- Figure 4: North America Organic Fish Market Volume (k Tons), by Country 2024 & 2032
- Figure 5: North America Organic Fish Market Revenue Share (%), by Country 2024 & 2032
- Figure 6: North America Organic Fish Market Volume Share (%), by Country 2024 & 2032
- Figure 7: Europe Organic Fish Market Revenue (Million), by Country 2024 & 2032
- Figure 8: Europe Organic Fish Market Volume (k Tons), by Country 2024 & 2032
- Figure 9: Europe Organic Fish Market Revenue Share (%), by Country 2024 & 2032
- Figure 10: Europe Organic Fish Market Volume Share (%), by Country 2024 & 2032
- Figure 11: Asia Pacific Organic Fish Market Revenue (Million), by Country 2024 & 2032
- Figure 12: Asia Pacific Organic Fish Market Volume (k Tons), by Country 2024 & 2032
- Figure 13: Asia Pacific Organic Fish Market Revenue Share (%), by Country 2024 & 2032
- Figure 14: Asia Pacific Organic Fish Market Volume Share (%), by Country 2024 & 2032
- Figure 15: South America Organic Fish Market Revenue (Million), by Country 2024 & 2032
- Figure 16: South America Organic Fish Market Volume (k Tons), by Country 2024 & 2032
- Figure 17: South America Organic Fish Market Revenue Share (%), by Country 2024 & 2032
- Figure 18: South America Organic Fish Market Volume Share (%), by Country 2024 & 2032
- Figure 19: Middle East and Africa Organic Fish Market Revenue (Million), by Country 2024 & 2032
- Figure 20: Middle East and Africa Organic Fish Market Volume (k Tons), by Country 2024 & 2032
- Figure 21: Middle East and Africa Organic Fish Market Revenue Share (%), by Country 2024 & 2032
- Figure 22: Middle East and Africa Organic Fish Market Volume Share (%), by Country 2024 & 2032
- Figure 23: North America Organic Fish Market Revenue (Million), by Type 2024 & 2032
- Figure 24: North America Organic Fish Market Volume (k Tons), by Type 2024 & 2032
- Figure 25: North America Organic Fish Market Revenue Share (%), by Type 2024 & 2032
- Figure 26: North America Organic Fish Market Volume Share (%), by Type 2024 & 2032
- Figure 27: North America Organic Fish Market Revenue (Million), by Form 2024 & 2032
- Figure 28: North America Organic Fish Market Volume (k Tons), by Form 2024 & 2032
- Figure 29: North America Organic Fish Market Revenue Share (%), by Form 2024 & 2032
- Figure 30: North America Organic Fish Market Volume Share (%), by Form 2024 & 2032
- Figure 31: North America Organic Fish Market Revenue (Million), by Distribution Channel 2024 & 2032
- Figure 32: North America Organic Fish Market Volume (k Tons), by Distribution Channel 2024 & 2032
- Figure 33: North America Organic Fish Market Revenue Share (%), by Distribution Channel 2024 & 2032
- Figure 34: North America Organic Fish Market Volume Share (%), by Distribution Channel 2024 & 2032
- Figure 35: North America Organic Fish Market Revenue (Million), by Country 2024 & 2032
- Figure 36: North America Organic Fish Market Volume (k Tons), by Country 2024 & 2032
- Figure 37: North America Organic Fish Market Revenue Share (%), by Country 2024 & 2032
- Figure 38: North America Organic Fish Market Volume Share (%), by Country 2024 & 2032
- Figure 39: Europe Organic Fish Market Revenue (Million), by Type 2024 & 2032
- Figure 40: Europe Organic Fish Market Volume (k Tons), by Type 2024 & 2032
- Figure 41: Europe Organic Fish Market Revenue Share (%), by Type 2024 & 2032
- Figure 42: Europe Organic Fish Market Volume Share (%), by Type 2024 & 2032
- Figure 43: Europe Organic Fish Market Revenue (Million), by Form 2024 & 2032
- Figure 44: Europe Organic Fish Market Volume (k Tons), by Form 2024 & 2032
- Figure 45: Europe Organic Fish Market Revenue Share (%), by Form 2024 & 2032
- Figure 46: Europe Organic Fish Market Volume Share (%), by Form 2024 & 2032
- Figure 47: Europe Organic Fish Market Revenue (Million), by Distribution Channel 2024 & 2032
- Figure 48: Europe Organic Fish Market Volume (k Tons), by Distribution Channel 2024 & 2032
- Figure 49: Europe Organic Fish Market Revenue Share (%), by Distribution Channel 2024 & 2032
- Figure 50: Europe Organic Fish Market Volume Share (%), by Distribution Channel 2024 & 2032
- Figure 51: Europe Organic Fish Market Revenue (Million), by Country 2024 & 2032
- Figure 52: Europe Organic Fish Market Volume (k Tons), by Country 2024 & 2032
- Figure 53: Europe Organic Fish Market Revenue Share (%), by Country 2024 & 2032
- Figure 54: Europe Organic Fish Market Volume Share (%), by Country 2024 & 2032
- Figure 55: Asia Pacific Organic Fish Market Revenue (Million), by Type 2024 & 2032
- Figure 56: Asia Pacific Organic Fish Market Volume (k Tons), by Type 2024 & 2032
- Figure 57: Asia Pacific Organic Fish Market Revenue Share (%), by Type 2024 & 2032
- Figure 58: Asia Pacific Organic Fish Market Volume Share (%), by Type 2024 & 2032
- Figure 59: Asia Pacific Organic Fish Market Revenue (Million), by Form 2024 & 2032
- Figure 60: Asia Pacific Organic Fish Market Volume (k Tons), by Form 2024 & 2032
- Figure 61: Asia Pacific Organic Fish Market Revenue Share (%), by Form 2024 & 2032
- Figure 62: Asia Pacific Organic Fish Market Volume Share (%), by Form 2024 & 2032
- Figure 63: Asia Pacific Organic Fish Market Revenue (Million), by Distribution Channel 2024 & 2032
- Figure 64: Asia Pacific Organic Fish Market Volume (k Tons), by Distribution Channel 2024 & 2032
- Figure 65: Asia Pacific Organic Fish Market Revenue Share (%), by Distribution Channel 2024 & 2032
- Figure 66: Asia Pacific Organic Fish Market Volume Share (%), by Distribution Channel 2024 & 2032
- Figure 67: Asia Pacific Organic Fish Market Revenue (Million), by Country 2024 & 2032
- Figure 68: Asia Pacific Organic Fish Market Volume (k Tons), by Country 2024 & 2032
- Figure 69: Asia Pacific Organic Fish Market Revenue Share (%), by Country 2024 & 2032
- Figure 70: Asia Pacific Organic Fish Market Volume Share (%), by Country 2024 & 2032
- Figure 71: South America Organic Fish Market Revenue (Million), by Type 2024 & 2032
- Figure 72: South America Organic Fish Market Volume (k Tons), by Type 2024 & 2032
- Figure 73: South America Organic Fish Market Revenue Share (%), by Type 2024 & 2032
- Figure 74: South America Organic Fish Market Volume Share (%), by Type 2024 & 2032
- Figure 75: South America Organic Fish Market Revenue (Million), by Form 2024 & 2032
- Figure 76: South America Organic Fish Market Volume (k Tons), by Form 2024 & 2032
- Figure 77: South America Organic Fish Market Revenue Share (%), by Form 2024 & 2032
- Figure 78: South America Organic Fish Market Volume Share (%), by Form 2024 & 2032
- Figure 79: South America Organic Fish Market Revenue (Million), by Distribution Channel 2024 & 2032
- Figure 80: South America Organic Fish Market Volume (k Tons), by Distribution Channel 2024 & 2032
- Figure 81: South America Organic Fish Market Revenue Share (%), by Distribution Channel 2024 & 2032
- Figure 82: South America Organic Fish Market Volume Share (%), by Distribution Channel 2024 & 2032
- Figure 83: South America Organic Fish Market Revenue (Million), by Country 2024 & 2032
- Figure 84: South America Organic Fish Market Volume (k Tons), by Country 2024 & 2032
- Figure 85: South America Organic Fish Market Revenue Share (%), by Country 2024 & 2032
- Figure 86: South America Organic Fish Market Volume Share (%), by Country 2024 & 2032
- Figure 87: Middle East and Africa Organic Fish Market Revenue (Million), by Type 2024 & 2032
- Figure 88: Middle East and Africa Organic Fish Market Volume (k Tons), by Type 2024 & 2032
- Figure 89: Middle East and Africa Organic Fish Market Revenue Share (%), by Type 2024 & 2032
- Figure 90: Middle East and Africa Organic Fish Market Volume Share (%), by Type 2024 & 2032
- Figure 91: Middle East and Africa Organic Fish Market Revenue (Million), by Form 2024 & 2032
- Figure 92: Middle East and Africa Organic Fish Market Volume (k Tons), by Form 2024 & 2032
- Figure 93: Middle East and Africa Organic Fish Market Revenue Share (%), by Form 2024 & 2032
- Figure 94: Middle East and Africa Organic Fish Market Volume Share (%), by Form 2024 & 2032
- Figure 95: Middle East and Africa Organic Fish Market Revenue (Million), by Distribution Channel 2024 & 2032
- Figure 96: Middle East and Africa Organic Fish Market Volume (k Tons), by Distribution Channel 2024 & 2032
- Figure 97: Middle East and Africa Organic Fish Market Revenue Share (%), by Distribution Channel 2024 & 2032
- Figure 98: Middle East and Africa Organic Fish Market Volume Share (%), by Distribution Channel 2024 & 2032
- Figure 99: Middle East and Africa Organic Fish Market Revenue (Million), by Country 2024 & 2032
- Figure 100: Middle East and Africa Organic Fish Market Volume (k Tons), by Country 2024 & 2032
- Figure 101: Middle East and Africa Organic Fish Market Revenue Share (%), by Country 2024 & 2032
- Figure 102: Middle East and Africa Organic Fish Market Volume Share (%), by Country 2024 & 2032
List of Tables
- Table 1: Global Organic Fish Market Revenue Million Forecast, by Region 2019 & 2032
- Table 2: Global Organic Fish Market Volume k Tons Forecast, by Region 2019 & 2032
- Table 3: Global Organic Fish Market Revenue Million Forecast, by Type 2019 & 2032
- Table 4: Global Organic Fish Market Volume k Tons Forecast, by Type 2019 & 2032
- Table 5: Global Organic Fish Market Revenue Million Forecast, by Form 2019 & 2032
- Table 6: Global Organic Fish Market Volume k Tons Forecast, by Form 2019 & 2032
- Table 7: Global Organic Fish Market Revenue Million Forecast, by Distribution Channel 2019 & 2032
- Table 8: Global Organic Fish Market Volume k Tons Forecast, by Distribution Channel 2019 & 2032
- Table 9: Global Organic Fish Market Revenue Million Forecast, by Region 2019 & 2032
- Table 10: Global Organic Fish Market Volume k Tons Forecast, by Region 2019 & 2032
- Table 11: Global Organic Fish Market Revenue Million Forecast, by Country 2019 & 2032
- Table 12: Global Organic Fish Market Volume k Tons Forecast, by Country 2019 & 2032
- Table 13: United States Organic Fish Market Revenue (Million) Forecast, by Application 2019 & 2032
- Table 14: United States Organic Fish Market Volume (k Tons) Forecast, by Application 2019 & 2032
- Table 15: Canada Organic Fish Market Revenue (Million) Forecast, by Application 2019 & 2032
- Table 16: Canada Organic Fish Market Volume (k Tons) Forecast, by Application 2019 & 2032
- Table 17: Mexico Organic Fish Market Revenue (Million) Forecast, by Application 2019 & 2032
- Table 18: Mexico Organic Fish Market Volume (k Tons) Forecast, by Application 2019 & 2032
- Table 19: Rest of North America Organic Fish Market Revenue (Million) Forecast, by Application 2019 & 2032
- Table 20: Rest of North America Organic Fish Market Volume (k Tons) Forecast, by Application 2019 & 2032
- Table 21: Global Organic Fish Market Revenue Million Forecast, by Country 2019 & 2032
- Table 22: Global Organic Fish Market Volume k Tons Forecast, by Country 2019 & 2032
- Table 23: Spain Organic Fish Market Revenue (Million) Forecast, by Application 2019 & 2032
- Table 24: Spain Organic Fish Market Volume (k Tons) Forecast, by Application 2019 & 2032
- Table 25: United Kingdom Organic Fish Market Revenue (Million) Forecast, by Application 2019 & 2032
- Table 26: United Kingdom Organic Fish Market Volume (k Tons) Forecast, by Application 2019 & 2032
- Table 27: Germany Organic Fish Market Revenue (Million) Forecast, by Application 2019 & 2032
- Table 28: Germany Organic Fish Market Volume (k Tons) Forecast, by Application 2019 & 2032
- Table 29: France Organic Fish Market Revenue (Million) Forecast, by Application 2019 & 2032
- Table 30: France Organic Fish Market Volume (k Tons) Forecast, by Application 2019 & 2032
- Table 31: Italy Organic Fish Market Revenue (Million) Forecast, by Application 2019 & 2032
- Table 32: Italy Organic Fish Market Volume (k Tons) Forecast, by Application 2019 & 2032
- Table 33: Russia Organic Fish Market Revenue (Million) Forecast, by Application 2019 & 2032
- Table 34: Russia Organic Fish Market Volume (k Tons) Forecast, by Application 2019 & 2032
- Table 35: Rest of Europe Organic Fish Market Revenue (Million) Forecast, by Application 2019 & 2032
- Table 36: Rest of Europe Organic Fish Market Volume (k Tons) Forecast, by Application 2019 & 2032
- Table 37: Global Organic Fish Market Revenue Million Forecast, by Country 2019 & 2032
- Table 38: Global Organic Fish Market Volume k Tons Forecast, by Country 2019 & 2032
- Table 39: China Organic Fish Market Revenue (Million) Forecast, by Application 2019 & 2032
- Table 40: China Organic Fish Market Volume (k Tons) Forecast, by Application 2019 & 2032
- Table 41: Japan Organic Fish Market Revenue (Million) Forecast, by Application 2019 & 2032
- Table 42: Japan Organic Fish Market Volume (k Tons) Forecast, by Application 2019 & 2032
- Table 43: India Organic Fish Market Revenue (Million) Forecast, by Application 2019 & 2032
- Table 44: India Organic Fish Market Volume (k Tons) Forecast, by Application 2019 & 2032
- Table 45: Australia Organic Fish Market Revenue (Million) Forecast, by Application 2019 & 2032
- Table 46: Australia Organic Fish Market Volume (k Tons) Forecast, by Application 2019 & 2032
- Table 47: Rest of Asia Pacific Organic Fish Market Revenue (Million) Forecast, by Application 2019 & 2032
- Table 48: Rest of Asia Pacific Organic Fish Market Volume (k Tons) Forecast, by Application 2019 & 2032
- Table 49: Global Organic Fish Market Revenue Million Forecast, by Country 2019 & 2032
- Table 50: Global Organic Fish Market Volume k Tons Forecast, by Country 2019 & 2032
- Table 51: Brazil Organic Fish Market Revenue (Million) Forecast, by Application 2019 & 2032
- Table 52: Brazil Organic Fish Market Volume (k Tons) Forecast, by Application 2019 & 2032
- Table 53: Argentina Organic Fish Market Revenue (Million) Forecast, by Application 2019 & 2032
- Table 54: Argentina Organic Fish Market Volume (k Tons) Forecast, by Application 2019 & 2032
- Table 55: Rest of South America Organic Fish Market Revenue (Million) Forecast, by Application 2019 & 2032
- Table 56: Rest of South America Organic Fish Market Volume (k Tons) Forecast, by Application 2019 & 2032
- Table 57: Global Organic Fish Market Revenue Million Forecast, by Country 2019 & 2032
- Table 58: Global Organic Fish Market Volume k Tons Forecast, by Country 2019 & 2032
- Table 59: South Africa Organic Fish Market Revenue (Million) Forecast, by Application 2019 & 2032
- Table 60: South Africa Organic Fish Market Volume (k Tons) Forecast, by Application 2019 & 2032
- Table 61: Saudi Arabia Organic Fish Market Revenue (Million) Forecast, by Application 2019 & 2032
- Table 62: Saudi Arabia Organic Fish Market Volume (k Tons) Forecast, by Application 2019 & 2032
- Table 63: Rest of Middle East and Africa Organic Fish Market Revenue (Million) Forecast, by Application 2019 & 2032
- Table 64: Rest of Middle East and Africa Organic Fish Market Volume (k Tons) Forecast, by Application 2019 & 2032
- Table 65: Global Organic Fish Market Revenue Million Forecast, by Type 2019 & 2032
- Table 66: Global Organic Fish Market Volume k Tons Forecast, by Type 2019 & 2032
- Table 67: Global Organic Fish Market Revenue Million Forecast, by Form 2019 & 2032
- Table 68: Global Organic Fish Market Volume k Tons Forecast, by Form 2019 & 2032
- Table 69: Global Organic Fish Market Revenue Million Forecast, by Distribution Channel 2019 & 2032
- Table 70: Global Organic Fish Market Volume k Tons Forecast, by Distribution Channel 2019 & 2032
- Table 71: Global Organic Fish Market Revenue Million Forecast, by Country 2019 & 2032
- Table 72: Global Organic Fish Market Volume k Tons Forecast, by Country 2019 & 2032
- Table 73: United States Organic Fish Market Revenue (Million) Forecast, by Application 2019 & 2032
- Table 74: United States Organic Fish Market Volume (k Tons) Forecast, by Application 2019 & 2032
- Table 75: Canada Organic Fish Market Revenue (Million) Forecast, by Application 2019 & 2032
- Table 76: Canada Organic Fish Market Volume (k Tons) Forecast, by Application 2019 & 2032
- Table 77: Mexico Organic Fish Market Revenue (Million) Forecast, by Application 2019 & 2032
- Table 78: Mexico Organic Fish Market Volume (k Tons) Forecast, by Application 2019 & 2032
- Table 79: Rest of North America Organic Fish Market Revenue (Million) Forecast, by Application 2019 & 2032
- Table 80: Rest of North America Organic Fish Market Volume (k Tons) Forecast, by Application 2019 & 2032
- Table 81: Global Organic Fish Market Revenue Million Forecast, by Type 2019 & 2032
- Table 82: Global Organic Fish Market Volume k Tons Forecast, by Type 2019 & 2032
- Table 83: Global Organic Fish Market Revenue Million Forecast, by Form 2019 & 2032
- Table 84: Global Organic Fish Market Volume k Tons Forecast, by Form 2019 & 2032
- Table 85: Global Organic Fish Market Revenue Million Forecast, by Distribution Channel 2019 & 2032
- Table 86: Global Organic Fish Market Volume k Tons Forecast, by Distribution Channel 2019 & 2032
- Table 87: Global Organic Fish Market Revenue Million Forecast, by Country 2019 & 2032
- Table 88: Global Organic Fish Market Volume k Tons Forecast, by Country 2019 & 2032
- Table 89: Spain Organic Fish Market Revenue (Million) Forecast, by Application 2019 & 2032
- Table 90: Spain Organic Fish Market Volume (k Tons) Forecast, by Application 2019 & 2032
- Table 91: United Kingdom Organic Fish Market Revenue (Million) Forecast, by Application 2019 & 2032
- Table 92: United Kingdom Organic Fish Market Volume (k Tons) Forecast, by Application 2019 & 2032
- Table 93: Germany Organic Fish Market Revenue (Million) Forecast, by Application 2019 & 2032
- Table 94: Germany Organic Fish Market Volume (k Tons) Forecast, by Application 2019 & 2032
- Table 95: France Organic Fish Market Revenue (Million) Forecast, by Application 2019 & 2032
- Table 96: France Organic Fish Market Volume (k Tons) Forecast, by Application 2019 & 2032
- Table 97: Italy Organic Fish Market Revenue (Million) Forecast, by Application 2019 & 2032
- Table 98: Italy Organic Fish Market Volume (k Tons) Forecast, by Application 2019 & 2032
- Table 99: Russia Organic Fish Market Revenue (Million) Forecast, by Application 2019 & 2032
- Table 100: Russia Organic Fish Market Volume (k Tons) Forecast, by Application 2019 & 2032
- Table 101: Rest of Europe Organic Fish Market Revenue (Million) Forecast, by Application 2019 & 2032
- Table 102: Rest of Europe Organic Fish Market Volume (k Tons) Forecast, by Application 2019 & 2032
- Table 103: Global Organic Fish Market Revenue Million Forecast, by Type 2019 & 2032
- Table 104: Global Organic Fish Market Volume k Tons Forecast, by Type 2019 & 2032
- Table 105: Global Organic Fish Market Revenue Million Forecast, by Form 2019 & 2032
- Table 106: Global Organic Fish Market Volume k Tons Forecast, by Form 2019 & 2032
- Table 107: Global Organic Fish Market Revenue Million Forecast, by Distribution Channel 2019 & 2032
- Table 108: Global Organic Fish Market Volume k Tons Forecast, by Distribution Channel 2019 & 2032
- Table 109: Global Organic Fish Market Revenue Million Forecast, by Country 2019 & 2032
- Table 110: Global Organic Fish Market Volume k Tons Forecast, by Country 2019 & 2032
- Table 111: China Organic Fish Market Revenue (Million) Forecast, by Application 2019 & 2032
- Table 112: China Organic Fish Market Volume (k Tons) Forecast, by Application 2019 & 2032
- Table 113: Japan Organic Fish Market Revenue (Million) Forecast, by Application 2019 & 2032
- Table 114: Japan Organic Fish Market Volume (k Tons) Forecast, by Application 2019 & 2032
- Table 115: India Organic Fish Market Revenue (Million) Forecast, by Application 2019 & 2032
- Table 116: India Organic Fish Market Volume (k Tons) Forecast, by Application 2019 & 2032
- Table 117: Australia Organic Fish Market Revenue (Million) Forecast, by Application 2019 & 2032
- Table 118: Australia Organic Fish Market Volume (k Tons) Forecast, by Application 2019 & 2032
- Table 119: Rest of Asia Pacific Organic Fish Market Revenue (Million) Forecast, by Application 2019 & 2032
- Table 120: Rest of Asia Pacific Organic Fish Market Volume (k Tons) Forecast, by Application 2019 & 2032
- Table 121: Global Organic Fish Market Revenue Million Forecast, by Type 2019 & 2032
- Table 122: Global Organic Fish Market Volume k Tons Forecast, by Type 2019 & 2032
- Table 123: Global Organic Fish Market Revenue Million Forecast, by Form 2019 & 2032
- Table 124: Global Organic Fish Market Volume k Tons Forecast, by Form 2019 & 2032
- Table 125: Global Organic Fish Market Revenue Million Forecast, by Distribution Channel 2019 & 2032
- Table 126: Global Organic Fish Market Volume k Tons Forecast, by Distribution Channel 2019 & 2032
- Table 127: Global Organic Fish Market Revenue Million Forecast, by Country 2019 & 2032
- Table 128: Global Organic Fish Market Volume k Tons Forecast, by Country 2019 & 2032
- Table 129: Brazil Organic Fish Market Revenue (Million) Forecast, by Application 2019 & 2032
- Table 130: Brazil Organic Fish Market Volume (k Tons) Forecast, by Application 2019 & 2032
- Table 131: Argentina Organic Fish Market Revenue (Million) Forecast, by Application 2019 & 2032
- Table 132: Argentina Organic Fish Market Volume (k Tons) Forecast, by Application 2019 & 2032
- Table 133: Rest of South America Organic Fish Market Revenue (Million) Forecast, by Application 2019 & 2032
- Table 134: Rest of South America Organic Fish Market Volume (k Tons) Forecast, by Application 2019 & 2032
- Table 135: Global Organic Fish Market Revenue Million Forecast, by Type 2019 & 2032
- Table 136: Global Organic Fish Market Volume k Tons Forecast, by Type 2019 & 2032
- Table 137: Global Organic Fish Market Revenue Million Forecast, by Form 2019 & 2032
- Table 138: Global Organic Fish Market Volume k Tons Forecast, by Form 2019 & 2032
- Table 139: Global Organic Fish Market Revenue Million Forecast, by Distribution Channel 2019 & 2032
- Table 140: Global Organic Fish Market Volume k Tons Forecast, by Distribution Channel 2019 & 2032
- Table 141: Global Organic Fish Market Revenue Million Forecast, by Country 2019 & 2032
- Table 142: Global Organic Fish Market Volume k Tons Forecast, by Country 2019 & 2032
- Table 143: South Africa Organic Fish Market Revenue (Million) Forecast, by Application 2019 & 2032
- Table 144: South Africa Organic Fish Market Volume (k Tons) Forecast, by Application 2019 & 2032
- Table 145: Saudi Arabia Organic Fish Market Revenue (Million) Forecast, by Application 2019 & 2032
- Table 146: Saudi Arabia Organic Fish Market Volume (k Tons) Forecast, by Application 2019 & 2032
- Table 147: Rest of Middle East and Africa Organic Fish Market Revenue (Million) Forecast, by Application 2019 & 2032
- Table 148: Rest of Middle East and Africa Organic Fish Market Volume (k Tons) Forecast, by Application 2019 & 2032
Frequently Asked Questions
1. What is the projected Compound Annual Growth Rate (CAGR) of the Organic Fish Market?
The projected CAGR is approximately 6.80%.
2. Which companies are prominent players in the Organic Fish Market?
Key companies in the market include Royal Greenland A/S, Dom International Limited, Indigofish Eco Farms Private Limited, Global Union Agro & IT Ltd *List Not Exhaustive, Anova Seafood B V, Coombe Farm Organic, Artisanfish LLC, Glenarm Organic Salmon Ltd, Mowi ASA, The Irish Organic Salmon Co.
3. What are the main segments of the Organic Fish Market?
The market segments include Type, Form, Distribution Channel.
4. Can you provide details about the market size?
The market size is estimated to be USD XX Million as of 2022.
5. What are some drivers contributing to market growth?
Increasing Demand for Processed Food Products; Technological Advancements Supporting Market Growth.
6. What are the notable trends driving market growth?
Rising Health Awareness Promoting Demand.
7. Are there any restraints impacting market growth?
Increasing Cost of Production Due to Rise in Energy and Labor Cost.
8. Can you provide examples of recent developments in the market?
February 2022: MOWI launched new organic Scottish salmon on Ocado. MOWI expanded its range of products by launching two new organic salmon products independently verified by the Soil Association. The new MOWI Scottish salmon fillets (240g) and mild smoked Scottish salmon slices (100g) are available on Ocado.com.
9. What pricing options are available for accessing the report?
Pricing options include single-user, multi-user, and enterprise licenses priced at USD 4750, USD 5250, and USD 8750 respectively.
10. Is the market size provided in terms of value or volume?
The market size is provided in terms of value, measured in Million and volume, measured in k Tons.
11. Are there any specific market keywords associated with the report?
Yes, the market keyword associated with the report is "Organic Fish Market," which aids in identifying and referencing the specific market segment covered.
12. How do I determine which pricing option suits my needs best?
The pricing options vary based on user requirements and access needs. Individual users may opt for single-user licenses, while businesses requiring broader access may choose multi-user or enterprise licenses for cost-effective access to the report.
13. Are there any additional resources or data provided in the Organic Fish Market report?
While the report offers comprehensive insights, it's advisable to review the specific contents or supplementary materials provided to ascertain if additional resources or data are available.
14. How can I stay updated on further developments or reports in the Organic Fish Market?
To stay informed about further developments, trends, and reports in the Organic Fish Market, consider subscribing to industry newsletters, following relevant companies and organizations, or regularly checking reputable industry news sources and publications.
Methodology
Step 1 - Identification of Relevant Samples Size from Population Database


Step 2 - Approaches for Defining Global Market Size (Value, Volume* & Price*)

Note*: In applicable scenarios
Step 3 - Data Sources
Primary Research
- Web Analytics
- Survey Reports
- Research Institute
- Latest Research Reports
- Opinion Leaders
Secondary Research
- Annual Reports
- White Paper
- Latest Press Release
- Industry Association
- Paid Database
- Investor Presentations

Step 4 - Data Triangulation
Involves using different sources of information in order to increase the validity of a study
These sources are likely to be stakeholders in a program - participants, other researchers, program staff, other community members, and so on.
Then we put all data in single framework & apply various statistical tools to find out the dynamic on the market.
During the analysis stage, feedback from the stakeholder groups would be compared to determine areas of agreement as well as areas of divergence
