

Key Insights
The global peracetic acid market, valued at approximately $1117 million in 2025, is poised for significant expansion. Driven by escalating demand across vital sectors, the market is projected to achieve a Compound Annual Growth Rate (CAGR) of 8.49%. Key growth catalysts include the increasing necessity for effective and eco-friendly disinfection and sterilization solutions within the food and beverage, healthcare, and water treatment industries. Stringent hygiene and sanitation regulations further reinforce market expansion. The rising incidence of foodborne illnesses and the demand for advanced sanitation in healthcare facilities are substantial contributors. Moreover, the transition towards sustainable alternatives to conventional chemical disinfectants, attributed to peracetic acid's biodegradability, is accelerating market adoption. The market segmentation by application (disinfectant, oxidizer, sterilant) and end-user industry (food & beverage, water treatment, pulp & paper, healthcare, chemical) highlights the diverse utility of this versatile chemical. Despite potential challenges such as stringent regulatory compliance and cost considerations, the overall market outlook remains robust, fueled by heightened awareness of hygiene and the inherent advantages of peracetic acid over traditional methods.
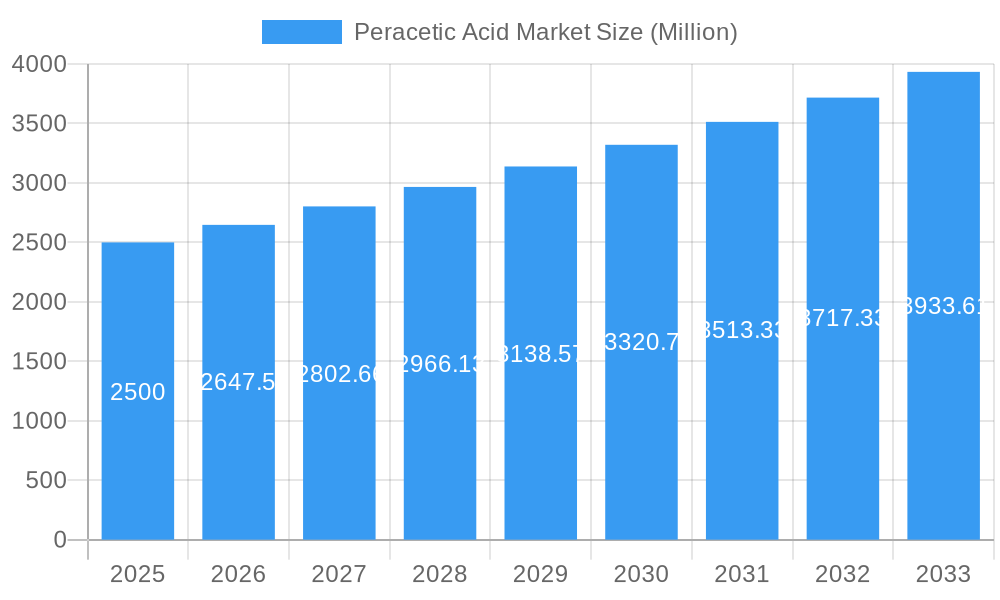
Peracetic Acid Market Market Size (In Billion)
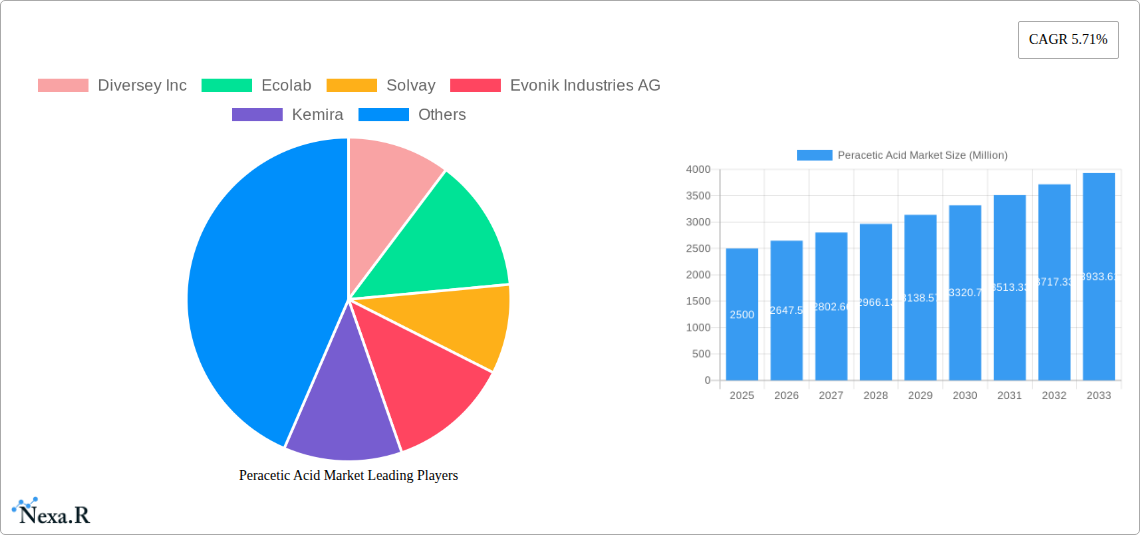
Geographically, North America and Europe currently command significant market shares due to established infrastructure and high adoption rates in key industries. However, the Asia-Pacific region, led by China and India, is expected to witness accelerated growth driven by rapid industrialization and expanding healthcare sectors. Leading market players including Diversey Inc., Ecolab, Solvay, and Evonik Industries AG are actively shaping the market through innovation, strategic collaborations, and expansion into emerging economies. Intense competition is anticipated, with companies prioritizing the development of novel formulations and broadening their geographical presence to secure market share. The forecast period offers substantial opportunities for market participants. Strategic investments in research and development, alongside a dedicated focus on sustainability and regulatory adherence, will be crucial for success in this dynamic market.
Peracetic Acid Market Company Market Share
Peracetic Acid Market: A Comprehensive Market Report (2019-2033)
This in-depth report provides a comprehensive analysis of the Peracetic Acid market, encompassing market dynamics, growth trends, regional analysis, product landscape, key players, and future outlook. The study period covers 2019-2033, with 2025 as the base and estimated year. The report offers invaluable insights for industry professionals, investors, and strategic decision-makers seeking to navigate this dynamic market. The total market size is estimated at xx Million in 2025.
Peracetic Acid Market Dynamics & Structure
This section analyzes the market's competitive landscape, technological advancements, regulatory environment, and influential market trends. The global Peracetic Acid market exhibits a moderately consolidated structure, with key players such as Diversey Inc, Ecolab, Solvay, and Evonik Industries AG holding significant market share. However, smaller, specialized companies also contribute to market dynamism.
- Market Concentration: The market shows a concentration ratio (CR4) of approximately xx%, indicating a moderately consolidated structure.
- Technological Innovation: Continuous innovation in peracetic acid production and application methods, particularly focusing on sustainability and enhanced efficacy, drives market growth.
- Regulatory Framework: Stringent regulations regarding the use of disinfectants and sterilants, particularly in the food and beverage and healthcare sectors, influence market dynamics and adoption rates.
- Competitive Substitutes: Competing disinfectants and sterilization technologies (e.g., chlorine-based solutions, hydrogen peroxide) present competitive pressure.
- End-User Demographics: Growth is significantly driven by increasing demand in the food and beverage, healthcare, and water treatment sectors due to heightened hygiene standards and stringent regulations.
- M&A Trends: The past five years have witnessed xx M&A deals in the peracetic acid sector, primarily focused on strengthening product portfolios and expanding geographical reach.
Peracetic Acid Market Growth Trends & Insights
The global Peracetic Acid market is experiencing robust growth, driven by rising demand across various end-use industries. The market size is projected to reach xx Million by 2033, exhibiting a CAGR of xx% during the forecast period (2025-2033). This growth is fueled by several factors, including increasing consumer awareness regarding hygiene and sanitation, stringent regulations promoting safe food handling and water treatment, and the expanding healthcare sector. Technological advancements, resulting in more efficient and sustainable peracetic acid production methods, further contribute to this growth. Adoption rates are particularly high in developed regions with robust regulatory frameworks. Shifting consumer preferences towards eco-friendly and effective disinfectants also propel market expansion.
Dominant Regions, Countries, or Segments in Peracetic Acid Market
North America currently holds the largest market share within the global peracetic acid market, followed by Europe and Asia-Pacific. Within application segments, the disinfectant segment dominates, driven by its extensive use across diverse industries. The healthcare and food & beverage sectors are the largest end-user industries, demanding high volumes of peracetic acid for sterilization and sanitation purposes.
- Key Drivers: Stricter hygiene regulations, increasing prevalence of foodborne illnesses, growing demand for effective water treatment solutions, and expanding pharmaceutical production are key drivers in North America and Europe. Rapid industrialization and urbanization are driving growth in Asia-Pacific.
- Dominance Factors: The dominance of North America and Europe is attributed to established infrastructure, stringent regulatory environments, and higher consumer awareness. However, Asia-Pacific is expected to witness the highest growth rate due to rapid economic expansion and rising consumer disposable income.
Peracetic Acid Market Product Landscape
The peracetic acid market offers a range of products with varying concentrations and formulations tailored to specific applications. Recent innovations focus on improving efficacy, reducing environmental impact, and enhancing safety features. Products are differentiated based on concentration, formulation (e.g., liquid, solid), and specific applications. Unique selling propositions often center on enhanced efficacy, improved stability, and environmentally friendly attributes. Technological advancements are evident in the development of more efficient production methods and controlled-release formulations.
Key Drivers, Barriers & Challenges in Peracetic Acid Market
Key Drivers:
- Increasing demand for effective disinfectants and sterilants across various sectors.
- Stringent government regulations related to hygiene and sanitation.
- Growing consumer awareness of hygiene and food safety.
- Technological advancements improving peracetic acid production and efficacy.
Challenges and Restraints:
- Volatility in raw material prices (e.g., acetic acid, hydrogen peroxide).
- Stringent safety regulations regarding handling and storage.
- Competition from alternative disinfectants and sterilization methods.
- Potential environmental concerns related to peracetic acid production and disposal. This poses a challenge estimated to impact the market by approximately xx Million by 2033.
Emerging Opportunities in Peracetic Acid Market
- Expanding applications in emerging markets.
- Growing demand for eco-friendly and sustainable disinfectants.
- Development of innovative formulations with enhanced efficacy and safety.
- Increasing use in niche applications such as aquaculture and wastewater treatment.
Growth Accelerators in the Peracetic Acid Market Industry
Strategic partnerships between peracetic acid manufacturers and end-users are driving market growth by ensuring consistent supply and tailored product development. Furthermore, technological advancements leading to more efficient and sustainable production methods are accelerating market expansion. Expansion into new geographic markets, particularly in developing economies experiencing rapid industrialization, presents significant growth opportunities.
Key Players Shaping the Peracetic Acid Market Market
- Diversey Inc
- Ecolab
- Solvay
- Evonik Industries AG
- Kemira
- Biosan
- Aditya Birla Chemicals
- Stockmeier Group
- MITSUBISHI GAS CHEMICAL COMPANY INC
- ACURO ORGANICS LIMITED
- Christeyns
- Enviro Tech Chemical Services Inc (arxada Ag)
- Airedale Chemical Company Limited
- Hydrite Chemical
Notable Milestones in Peracetic Acid Market Sector
- May 2023: Evonik Industries AG launched EPA-registered VIGOROX for aquaculture water quality control.
- December 2022: Christeyns launched Peracid Forte, a peracetic acid-based bleaching agent with enhanced hygienic properties.
- April 2022: Evonik unveiled a new sustainability approach for its hydrogen peroxide, peracetic acid, and persulfates, aiming for climate neutrality by 2040.
In-Depth Peracetic Acid Market Market Outlook
The peracetic acid market is poised for sustained growth, driven by several factors including increasing demand across key end-use sectors, stringent regulatory compliance, and continuous technological advancements. Strategic investments in R&D, partnerships, and sustainable production methods will further strengthen the market's trajectory. Untapped opportunities in emerging economies and the development of innovative applications will contribute to the market's long-term potential. The market is anticipated to witness considerable expansion in the coming years, presenting lucrative opportunities for both established players and new entrants.
Peracetic Acid Market Segmentation
-
1. Application
- 1.1. Disinfectant
- 1.2. Oxidizer
- 1.3. Sterilant
- 1.4. Other Applications
-
2. End-user Industry
- 2.1. Food and Beverage
- 2.2. Water Treatment
- 2.3. Pulp and Paper
- 2.4. Healthcare (incl. Pharmaceutical)
- 2.5. Chemical
- 2.6. Other End-user Industries
Peracetic Acid Market Segmentation By Geography
-
1. Asia Pacific
- 1.1. China
- 1.2. India
- 1.3. Japan
- 1.4. South Korea
- 1.5. Rest of Asia Pacific
-
2. North America
- 2.1. United States
- 2.2. Mexico
- 2.3. Canada
-
3. Europe
- 3.1. Germany
- 3.2. United Kingdom
- 3.3. Italy
- 3.4. France
- 3.5. Rest of Europe
-
4. South America
- 4.1. Brazil
- 4.2. Argentina
- 4.3. Rest of South America
-
5. Middle East and Africa
- 5.1. Saudi Arabia
- 5.2. South Africa
- 5.3. Rest of Middle East and Africa
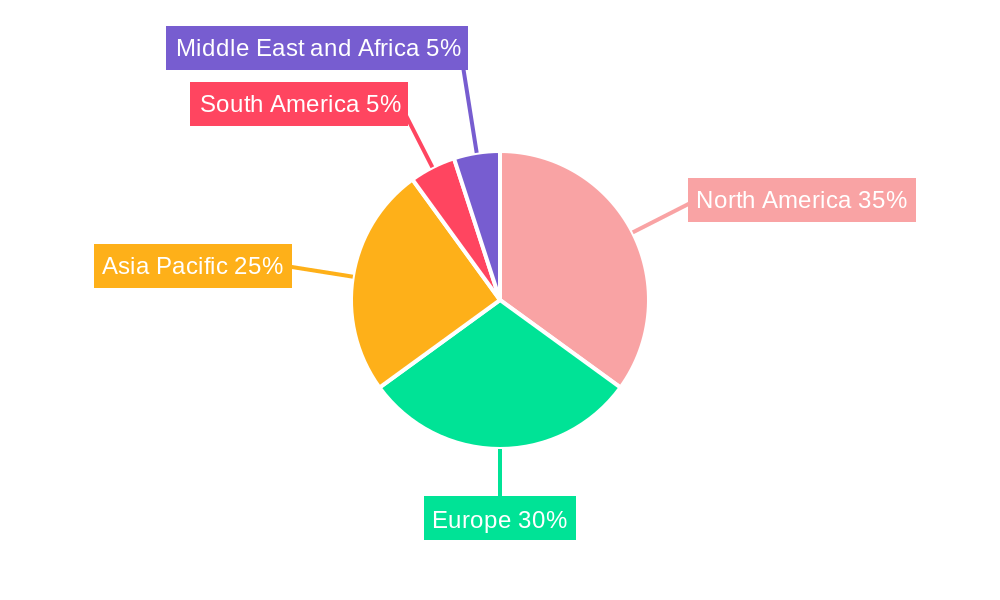
Peracetic Acid Market Regional Market Share
Geographic Coverage of Peracetic Acid Market
Peracetic Acid Market REPORT HIGHLIGHTS
| Aspects | Details |
|---|---|
| Study Period | 2020-2034 |
| Base Year | 2025 |
| Estimated Year | 2026 |
| Forecast Period | 2026-2034 |
| Historical Period | 2020-2025 |
| Growth Rate | CAGR of 8.49% from 2020-2034 |
| Segmentation |
|
Table of Contents
- 1. Introduction
- 1.1. Research Scope
- 1.2. Market Segmentation
- 1.3. Research Objective
- 1.4. Definitions and Assumptions
- 2. Executive Summary
- 2.1. Market Snapshot
- 3. Market Dynamics
- 3.1. Market Drivers
- 3.2. Market Restrains
- 3.3. Market Trends
- 3.4. Market Opportunities
- 4. Market Factor Analysis
- 4.1. Porters Five Forces
- 4.1.1. Bargaining Power of Suppliers
- 4.1.2. Bargaining Power of Buyers
- 4.1.3. Threat of New Entrants
- 4.1.4. Threat of Substitutes
- 4.1.5. Competitive Rivalry
- 4.2. PESTEL analysis
- 4.3. BCG Analysis
- 4.3.1. Stars (High Growth, High Market Share)
- 4.3.2. Cash Cows (Low Growth, High Market Share)
- 4.3.3. Question Mark (High Growth, Low Market Share)
- 4.3.4. Dogs (Low Growth, Low Market Share)
- 4.4. Ansoff Matrix Analysis
- 4.5. Supply Chain Analysis
- 4.6. Regulatory Landscape
- 4.7. Current Market Potential and Opportunity Assessment (TAM–SAM–SOM Framework)
- 4.8. NRP Analyst Note
- 4.1. Porters Five Forces
- 5. Market Analysis, Insights and Forecast 2021-2033
- 5.1. Market Analysis, Insights and Forecast - by Application
- 5.1.1. Disinfectant
- 5.1.2. Oxidizer
- 5.1.3. Sterilant
- 5.1.4. Other Applications
- 5.2. Market Analysis, Insights and Forecast - by End-user Industry
- 5.2.1. Food and Beverage
- 5.2.2. Water Treatment
- 5.2.3. Pulp and Paper
- 5.2.4. Healthcare (incl. Pharmaceutical)
- 5.2.5. Chemical
- 5.2.6. Other End-user Industries
- 5.3. Market Analysis, Insights and Forecast - by Region
- 5.3.1. Asia Pacific
- 5.3.2. North America
- 5.3.3. Europe
- 5.3.4. South America
- 5.3.5. Middle East and Africa
- 5.1. Market Analysis, Insights and Forecast - by Application
- 6. Global Peracetic Acid Market Analysis, Insights and Forecast, 2021-2033
- 6.1. Market Analysis, Insights and Forecast - by Application
- 6.1.1. Disinfectant
- 6.1.2. Oxidizer
- 6.1.3. Sterilant
- 6.1.4. Other Applications
- 6.2. Market Analysis, Insights and Forecast - by End-user Industry
- 6.2.1. Food and Beverage
- 6.2.2. Water Treatment
- 6.2.3. Pulp and Paper
- 6.2.4. Healthcare (incl. Pharmaceutical)
- 6.2.5. Chemical
- 6.2.6. Other End-user Industries
- 6.1. Market Analysis, Insights and Forecast - by Application
- 7. Asia Pacific Peracetic Acid Market Analysis, Insights and Forecast, 2020-2032
- 7.1. Market Analysis, Insights and Forecast - by Application
- 7.1.1. Disinfectant
- 7.1.2. Oxidizer
- 7.1.3. Sterilant
- 7.1.4. Other Applications
- 7.2. Market Analysis, Insights and Forecast - by End-user Industry
- 7.2.1. Food and Beverage
- 7.2.2. Water Treatment
- 7.2.3. Pulp and Paper
- 7.2.4. Healthcare (incl. Pharmaceutical)
- 7.2.5. Chemical
- 7.2.6. Other End-user Industries
- 7.1. Market Analysis, Insights and Forecast - by Application
- 8. North America Peracetic Acid Market Analysis, Insights and Forecast, 2020-2032
- 8.1. Market Analysis, Insights and Forecast - by Application
- 8.1.1. Disinfectant
- 8.1.2. Oxidizer
- 8.1.3. Sterilant
- 8.1.4. Other Applications
- 8.2. Market Analysis, Insights and Forecast - by End-user Industry
- 8.2.1. Food and Beverage
- 8.2.2. Water Treatment
- 8.2.3. Pulp and Paper
- 8.2.4. Healthcare (incl. Pharmaceutical)
- 8.2.5. Chemical
- 8.2.6. Other End-user Industries
- 8.1. Market Analysis, Insights and Forecast - by Application
- 9. Europe Peracetic Acid Market Analysis, Insights and Forecast, 2020-2032
- 9.1. Market Analysis, Insights and Forecast - by Application
- 9.1.1. Disinfectant
- 9.1.2. Oxidizer
- 9.1.3. Sterilant
- 9.1.4. Other Applications
- 9.2. Market Analysis, Insights and Forecast - by End-user Industry
- 9.2.1. Food and Beverage
- 9.2.2. Water Treatment
- 9.2.3. Pulp and Paper
- 9.2.4. Healthcare (incl. Pharmaceutical)
- 9.2.5. Chemical
- 9.2.6. Other End-user Industries
- 9.1. Market Analysis, Insights and Forecast - by Application
- 10. South America Peracetic Acid Market Analysis, Insights and Forecast, 2020-2032
- 10.1. Market Analysis, Insights and Forecast - by Application
- 10.1.1. Disinfectant
- 10.1.2. Oxidizer
- 10.1.3. Sterilant
- 10.1.4. Other Applications
- 10.2. Market Analysis, Insights and Forecast - by End-user Industry
- 10.2.1. Food and Beverage
- 10.2.2. Water Treatment
- 10.2.3. Pulp and Paper
- 10.2.4. Healthcare (incl. Pharmaceutical)
- 10.2.5. Chemical
- 10.2.6. Other End-user Industries
- 10.1. Market Analysis, Insights and Forecast - by Application
- 11. Middle East and Africa Peracetic Acid Market Analysis, Insights and Forecast, 2020-2032
- 11.1. Market Analysis, Insights and Forecast - by Application
- 11.1.1. Disinfectant
- 11.1.2. Oxidizer
- 11.1.3. Sterilant
- 11.1.4. Other Applications
- 11.2. Market Analysis, Insights and Forecast - by End-user Industry
- 11.2.1. Food and Beverage
- 11.2.2. Water Treatment
- 11.2.3. Pulp and Paper
- 11.2.4. Healthcare (incl. Pharmaceutical)
- 11.2.5. Chemical
- 11.2.6. Other End-user Industries
- 11.1. Market Analysis, Insights and Forecast - by Application
- 12. Competitive Analysis
- 12.1. Company Profiles
- 12.1.1 Diversey Inc
- 12.1.1.1. Company Overview
- 12.1.1.2. Products
- 12.1.1.3. Company Financials
- 12.1.1.4. SWOT Analysis
- 12.1.2 Ecolab
- 12.1.2.1. Company Overview
- 12.1.2.2. Products
- 12.1.2.3. Company Financials
- 12.1.2.4. SWOT Analysis
- 12.1.3 Solvay
- 12.1.3.1. Company Overview
- 12.1.3.2. Products
- 12.1.3.3. Company Financials
- 12.1.3.4. SWOT Analysis
- 12.1.4 Evonik Industries AG
- 12.1.4.1. Company Overview
- 12.1.4.2. Products
- 12.1.4.3. Company Financials
- 12.1.4.4. SWOT Analysis
- 12.1.5 Kemira
- 12.1.5.1. Company Overview
- 12.1.5.2. Products
- 12.1.5.3. Company Financials
- 12.1.5.4. SWOT Analysis
- 12.1.6 Biosan
- 12.1.6.1. Company Overview
- 12.1.6.2. Products
- 12.1.6.3. Company Financials
- 12.1.6.4. SWOT Analysis
- 12.1.7 Aditya Birla Chemicals
- 12.1.7.1. Company Overview
- 12.1.7.2. Products
- 12.1.7.3. Company Financials
- 12.1.7.4. SWOT Analysis
- 12.1.8 Stockmeier Group*List Not Exhaustive
- 12.1.8.1. Company Overview
- 12.1.8.2. Products
- 12.1.8.3. Company Financials
- 12.1.8.4. SWOT Analysis
- 12.1.9 MITSUBISHI GAS CHEMICAL COMPANY INC
- 12.1.9.1. Company Overview
- 12.1.9.2. Products
- 12.1.9.3. Company Financials
- 12.1.9.4. SWOT Analysis
- 12.1.10 ACURO ORGANICS LIMITED
- 12.1.10.1. Company Overview
- 12.1.10.2. Products
- 12.1.10.3. Company Financials
- 12.1.10.4. SWOT Analysis
- 12.1.11 Christeyns
- 12.1.11.1. Company Overview
- 12.1.11.2. Products
- 12.1.11.3. Company Financials
- 12.1.11.4. SWOT Analysis
- 12.1.12 Enviro Tech Chemical Services Inc (arxada Ag)
- 12.1.12.1. Company Overview
- 12.1.12.2. Products
- 12.1.12.3. Company Financials
- 12.1.12.4. SWOT Analysis
- 12.1.13 Airedale Chemical Company Limited
- 12.1.13.1. Company Overview
- 12.1.13.2. Products
- 12.1.13.3. Company Financials
- 12.1.13.4. SWOT Analysis
- 12.1.14 Hydrite Chemical
- 12.1.14.1. Company Overview
- 12.1.14.2. Products
- 12.1.14.3. Company Financials
- 12.1.14.4. SWOT Analysis
- 12.1.1 Diversey Inc
- 12.2. Market Entropy
- 12.2.1 Company's Key Areas Served
- 12.2.2 Recent Developments
- 12.3. Company Market Share Analysis 2025
- 12.3.1 Top 5 Companies Market Share Analysis
- 12.3.2 Top 3 Companies Market Share Analysis
- 12.4. List of Potential Customers
- 13. Research Methodology
List of Figures
- Figure 1: Global Peracetic Acid Market Revenue Breakdown (million, %) by Region 2025 & 2033
- Figure 2: Global Peracetic Acid Market Volume Breakdown (Million, %) by Region 2025 & 2033
- Figure 3: Asia Pacific Peracetic Acid Market Revenue (million), by Application 2025 & 2033
- Figure 4: Asia Pacific Peracetic Acid Market Volume (Million), by Application 2025 & 2033
- Figure 5: Asia Pacific Peracetic Acid Market Revenue Share (%), by Application 2025 & 2033
- Figure 6: Asia Pacific Peracetic Acid Market Volume Share (%), by Application 2025 & 2033
- Figure 7: Asia Pacific Peracetic Acid Market Revenue (million), by End-user Industry 2025 & 2033
- Figure 8: Asia Pacific Peracetic Acid Market Volume (Million), by End-user Industry 2025 & 2033
- Figure 9: Asia Pacific Peracetic Acid Market Revenue Share (%), by End-user Industry 2025 & 2033
- Figure 10: Asia Pacific Peracetic Acid Market Volume Share (%), by End-user Industry 2025 & 2033
- Figure 11: Asia Pacific Peracetic Acid Market Revenue (million), by Country 2025 & 2033
- Figure 12: Asia Pacific Peracetic Acid Market Volume (Million), by Country 2025 & 2033
- Figure 13: Asia Pacific Peracetic Acid Market Revenue Share (%), by Country 2025 & 2033
- Figure 14: Asia Pacific Peracetic Acid Market Volume Share (%), by Country 2025 & 2033
- Figure 15: North America Peracetic Acid Market Revenue (million), by Application 2025 & 2033
- Figure 16: North America Peracetic Acid Market Volume (Million), by Application 2025 & 2033
- Figure 17: North America Peracetic Acid Market Revenue Share (%), by Application 2025 & 2033
- Figure 18: North America Peracetic Acid Market Volume Share (%), by Application 2025 & 2033
- Figure 19: North America Peracetic Acid Market Revenue (million), by End-user Industry 2025 & 2033
- Figure 20: North America Peracetic Acid Market Volume (Million), by End-user Industry 2025 & 2033
- Figure 21: North America Peracetic Acid Market Revenue Share (%), by End-user Industry 2025 & 2033
- Figure 22: North America Peracetic Acid Market Volume Share (%), by End-user Industry 2025 & 2033
- Figure 23: North America Peracetic Acid Market Revenue (million), by Country 2025 & 2033
- Figure 24: North America Peracetic Acid Market Volume (Million), by Country 2025 & 2033
- Figure 25: North America Peracetic Acid Market Revenue Share (%), by Country 2025 & 2033
- Figure 26: North America Peracetic Acid Market Volume Share (%), by Country 2025 & 2033
- Figure 27: Europe Peracetic Acid Market Revenue (million), by Application 2025 & 2033
- Figure 28: Europe Peracetic Acid Market Volume (Million), by Application 2025 & 2033
- Figure 29: Europe Peracetic Acid Market Revenue Share (%), by Application 2025 & 2033
- Figure 30: Europe Peracetic Acid Market Volume Share (%), by Application 2025 & 2033
- Figure 31: Europe Peracetic Acid Market Revenue (million), by End-user Industry 2025 & 2033
- Figure 32: Europe Peracetic Acid Market Volume (Million), by End-user Industry 2025 & 2033
- Figure 33: Europe Peracetic Acid Market Revenue Share (%), by End-user Industry 2025 & 2033
- Figure 34: Europe Peracetic Acid Market Volume Share (%), by End-user Industry 2025 & 2033
- Figure 35: Europe Peracetic Acid Market Revenue (million), by Country 2025 & 2033
- Figure 36: Europe Peracetic Acid Market Volume (Million), by Country 2025 & 2033
- Figure 37: Europe Peracetic Acid Market Revenue Share (%), by Country 2025 & 2033
- Figure 38: Europe Peracetic Acid Market Volume Share (%), by Country 2025 & 2033
- Figure 39: South America Peracetic Acid Market Revenue (million), by Application 2025 & 2033
- Figure 40: South America Peracetic Acid Market Volume (Million), by Application 2025 & 2033
- Figure 41: South America Peracetic Acid Market Revenue Share (%), by Application 2025 & 2033
- Figure 42: South America Peracetic Acid Market Volume Share (%), by Application 2025 & 2033
- Figure 43: South America Peracetic Acid Market Revenue (million), by End-user Industry 2025 & 2033
- Figure 44: South America Peracetic Acid Market Volume (Million), by End-user Industry 2025 & 2033
- Figure 45: South America Peracetic Acid Market Revenue Share (%), by End-user Industry 2025 & 2033
- Figure 46: South America Peracetic Acid Market Volume Share (%), by End-user Industry 2025 & 2033
- Figure 47: South America Peracetic Acid Market Revenue (million), by Country 2025 & 2033
- Figure 48: South America Peracetic Acid Market Volume (Million), by Country 2025 & 2033
- Figure 49: South America Peracetic Acid Market Revenue Share (%), by Country 2025 & 2033
- Figure 50: South America Peracetic Acid Market Volume Share (%), by Country 2025 & 2033
- Figure 51: Middle East and Africa Peracetic Acid Market Revenue (million), by Application 2025 & 2033
- Figure 52: Middle East and Africa Peracetic Acid Market Volume (Million), by Application 2025 & 2033
- Figure 53: Middle East and Africa Peracetic Acid Market Revenue Share (%), by Application 2025 & 2033
- Figure 54: Middle East and Africa Peracetic Acid Market Volume Share (%), by Application 2025 & 2033
- Figure 55: Middle East and Africa Peracetic Acid Market Revenue (million), by End-user Industry 2025 & 2033
- Figure 56: Middle East and Africa Peracetic Acid Market Volume (Million), by End-user Industry 2025 & 2033
- Figure 57: Middle East and Africa Peracetic Acid Market Revenue Share (%), by End-user Industry 2025 & 2033
- Figure 58: Middle East and Africa Peracetic Acid Market Volume Share (%), by End-user Industry 2025 & 2033
- Figure 59: Middle East and Africa Peracetic Acid Market Revenue (million), by Country 2025 & 2033
- Figure 60: Middle East and Africa Peracetic Acid Market Volume (Million), by Country 2025 & 2033
- Figure 61: Middle East and Africa Peracetic Acid Market Revenue Share (%), by Country 2025 & 2033
- Figure 62: Middle East and Africa Peracetic Acid Market Volume Share (%), by Country 2025 & 2033
List of Tables
- Table 1: Global Peracetic Acid Market Revenue million Forecast, by Application 2020 & 2033
- Table 2: Global Peracetic Acid Market Volume Million Forecast, by Application 2020 & 2033
- Table 3: Global Peracetic Acid Market Revenue million Forecast, by End-user Industry 2020 & 2033
- Table 4: Global Peracetic Acid Market Volume Million Forecast, by End-user Industry 2020 & 2033
- Table 5: Global Peracetic Acid Market Revenue million Forecast, by Region 2020 & 2033
- Table 6: Global Peracetic Acid Market Volume Million Forecast, by Region 2020 & 2033
- Table 7: Global Peracetic Acid Market Revenue million Forecast, by Application 2020 & 2033
- Table 8: Global Peracetic Acid Market Volume Million Forecast, by Application 2020 & 2033
- Table 9: Global Peracetic Acid Market Revenue million Forecast, by End-user Industry 2020 & 2033
- Table 10: Global Peracetic Acid Market Volume Million Forecast, by End-user Industry 2020 & 2033
- Table 11: Global Peracetic Acid Market Revenue million Forecast, by Country 2020 & 2033
- Table 12: Global Peracetic Acid Market Volume Million Forecast, by Country 2020 & 2033
- Table 13: China Peracetic Acid Market Revenue (million) Forecast, by Application 2020 & 2033
- Table 14: China Peracetic Acid Market Volume (Million) Forecast, by Application 2020 & 2033
- Table 15: India Peracetic Acid Market Revenue (million) Forecast, by Application 2020 & 2033
- Table 16: India Peracetic Acid Market Volume (Million) Forecast, by Application 2020 & 2033
- Table 17: Japan Peracetic Acid Market Revenue (million) Forecast, by Application 2020 & 2033
- Table 18: Japan Peracetic Acid Market Volume (Million) Forecast, by Application 2020 & 2033
- Table 19: South Korea Peracetic Acid Market Revenue (million) Forecast, by Application 2020 & 2033
- Table 20: South Korea Peracetic Acid Market Volume (Million) Forecast, by Application 2020 & 2033
- Table 21: Rest of Asia Pacific Peracetic Acid Market Revenue (million) Forecast, by Application 2020 & 2033
- Table 22: Rest of Asia Pacific Peracetic Acid Market Volume (Million) Forecast, by Application 2020 & 2033
- Table 23: Global Peracetic Acid Market Revenue million Forecast, by Application 2020 & 2033
- Table 24: Global Peracetic Acid Market Volume Million Forecast, by Application 2020 & 2033
- Table 25: Global Peracetic Acid Market Revenue million Forecast, by End-user Industry 2020 & 2033
- Table 26: Global Peracetic Acid Market Volume Million Forecast, by End-user Industry 2020 & 2033
- Table 27: Global Peracetic Acid Market Revenue million Forecast, by Country 2020 & 2033
- Table 28: Global Peracetic Acid Market Volume Million Forecast, by Country 2020 & 2033
- Table 29: United States Peracetic Acid Market Revenue (million) Forecast, by Application 2020 & 2033
- Table 30: United States Peracetic Acid Market Volume (Million) Forecast, by Application 2020 & 2033
- Table 31: Mexico Peracetic Acid Market Revenue (million) Forecast, by Application 2020 & 2033
- Table 32: Mexico Peracetic Acid Market Volume (Million) Forecast, by Application 2020 & 2033
- Table 33: Canada Peracetic Acid Market Revenue (million) Forecast, by Application 2020 & 2033
- Table 34: Canada Peracetic Acid Market Volume (Million) Forecast, by Application 2020 & 2033
- Table 35: Global Peracetic Acid Market Revenue million Forecast, by Application 2020 & 2033
- Table 36: Global Peracetic Acid Market Volume Million Forecast, by Application 2020 & 2033
- Table 37: Global Peracetic Acid Market Revenue million Forecast, by End-user Industry 2020 & 2033
- Table 38: Global Peracetic Acid Market Volume Million Forecast, by End-user Industry 2020 & 2033
- Table 39: Global Peracetic Acid Market Revenue million Forecast, by Country 2020 & 2033
- Table 40: Global Peracetic Acid Market Volume Million Forecast, by Country 2020 & 2033
- Table 41: Germany Peracetic Acid Market Revenue (million) Forecast, by Application 2020 & 2033
- Table 42: Germany Peracetic Acid Market Volume (Million) Forecast, by Application 2020 & 2033
- Table 43: United Kingdom Peracetic Acid Market Revenue (million) Forecast, by Application 2020 & 2033
- Table 44: United Kingdom Peracetic Acid Market Volume (Million) Forecast, by Application 2020 & 2033
- Table 45: Italy Peracetic Acid Market Revenue (million) Forecast, by Application 2020 & 2033
- Table 46: Italy Peracetic Acid Market Volume (Million) Forecast, by Application 2020 & 2033
- Table 47: France Peracetic Acid Market Revenue (million) Forecast, by Application 2020 & 2033
- Table 48: France Peracetic Acid Market Volume (Million) Forecast, by Application 2020 & 2033
- Table 49: Rest of Europe Peracetic Acid Market Revenue (million) Forecast, by Application 2020 & 2033
- Table 50: Rest of Europe Peracetic Acid Market Volume (Million) Forecast, by Application 2020 & 2033
- Table 51: Global Peracetic Acid Market Revenue million Forecast, by Application 2020 & 2033
- Table 52: Global Peracetic Acid Market Volume Million Forecast, by Application 2020 & 2033
- Table 53: Global Peracetic Acid Market Revenue million Forecast, by End-user Industry 2020 & 2033
- Table 54: Global Peracetic Acid Market Volume Million Forecast, by End-user Industry 2020 & 2033
- Table 55: Global Peracetic Acid Market Revenue million Forecast, by Country 2020 & 2033
- Table 56: Global Peracetic Acid Market Volume Million Forecast, by Country 2020 & 2033
- Table 57: Brazil Peracetic Acid Market Revenue (million) Forecast, by Application 2020 & 2033
- Table 58: Brazil Peracetic Acid Market Volume (Million) Forecast, by Application 2020 & 2033
- Table 59: Argentina Peracetic Acid Market Revenue (million) Forecast, by Application 2020 & 2033
- Table 60: Argentina Peracetic Acid Market Volume (Million) Forecast, by Application 2020 & 2033
- Table 61: Rest of South America Peracetic Acid Market Revenue (million) Forecast, by Application 2020 & 2033
- Table 62: Rest of South America Peracetic Acid Market Volume (Million) Forecast, by Application 2020 & 2033
- Table 63: Global Peracetic Acid Market Revenue million Forecast, by Application 2020 & 2033
- Table 64: Global Peracetic Acid Market Volume Million Forecast, by Application 2020 & 2033
- Table 65: Global Peracetic Acid Market Revenue million Forecast, by End-user Industry 2020 & 2033
- Table 66: Global Peracetic Acid Market Volume Million Forecast, by End-user Industry 2020 & 2033
- Table 67: Global Peracetic Acid Market Revenue million Forecast, by Country 2020 & 2033
- Table 68: Global Peracetic Acid Market Volume Million Forecast, by Country 2020 & 2033
- Table 69: Saudi Arabia Peracetic Acid Market Revenue (million) Forecast, by Application 2020 & 2033
- Table 70: Saudi Arabia Peracetic Acid Market Volume (Million) Forecast, by Application 2020 & 2033
- Table 71: South Africa Peracetic Acid Market Revenue (million) Forecast, by Application 2020 & 2033
- Table 72: South Africa Peracetic Acid Market Volume (Million) Forecast, by Application 2020 & 2033
- Table 73: Rest of Middle East and Africa Peracetic Acid Market Revenue (million) Forecast, by Application 2020 & 2033
- Table 74: Rest of Middle East and Africa Peracetic Acid Market Volume (Million) Forecast, by Application 2020 & 2033
Frequently Asked Questions
1. What is the projected Compound Annual Growth Rate (CAGR) of the Peracetic Acid Market?
The projected CAGR is approximately 8.49%.
2. Which companies are prominent players in the Peracetic Acid Market?
Key companies in the market include Diversey Inc, Ecolab, Solvay, Evonik Industries AG, Kemira, Biosan, Aditya Birla Chemicals, Stockmeier Group*List Not Exhaustive, MITSUBISHI GAS CHEMICAL COMPANY INC, ACURO ORGANICS LIMITED, Christeyns, Enviro Tech Chemical Services Inc (arxada Ag), Airedale Chemical Company Limited, Hydrite Chemical.
3. What are the main segments of the Peracetic Acid Market?
The market segments include Application, End-user Industry.
4. Can you provide details about the market size?
The market size is estimated to be USD 1117 million as of 2022.
5. What are some drivers contributing to market growth?
Growing Demand From Water Treatment Industry; Increasing Usage as A Disinfectant Across Various Industries.
6. What are the notable trends driving market growth?
Disinfectant Application to Dominate the Market.
7. Are there any restraints impacting market growth?
High Cost and Adverse Effect on Health.
8. Can you provide examples of recent developments in the market?
May 2023: Evonik Industries AG received registration from the U.S. Environmental Protection Agency (EPA) and launched EPA-registered VIGOROX, a peracetic product, as a trident for water quality control in aquaculture. This innovative product has enabled the company to strengthen its product portfolio.
9. What pricing options are available for accessing the report?
Pricing options include single-user, multi-user, and enterprise licenses priced at USD 4750, USD 5250, and USD 8750 respectively.
10. Is the market size provided in terms of value or volume?
The market size is provided in terms of value, measured in million and volume, measured in Million.
11. Are there any specific market keywords associated with the report?
Yes, the market keyword associated with the report is "Peracetic Acid Market," which aids in identifying and referencing the specific market segment covered.
12. How do I determine which pricing option suits my needs best?
The pricing options vary based on user requirements and access needs. Individual users may opt for single-user licenses, while businesses requiring broader access may choose multi-user or enterprise licenses for cost-effective access to the report.
13. Are there any additional resources or data provided in the Peracetic Acid Market report?
While the report offers comprehensive insights, it's advisable to review the specific contents or supplementary materials provided to ascertain if additional resources or data are available.
14. How can I stay updated on further developments or reports in the Peracetic Acid Market?
To stay informed about further developments, trends, and reports in the Peracetic Acid Market, consider subscribing to industry newsletters, following relevant companies and organizations, or regularly checking reputable industry news sources and publications.
Methodology
Step 1 - Identification of Relevant Samples Size from Population Database


Step 2 - Approaches for Defining Global Market Size (Value, Volume* & Price*)

Note*: In applicable scenarios
Step 3 - Data Sources
Primary Research
- Web Analytics
- Survey Reports
- Research Institute
- Latest Research Reports
- Opinion Leaders
Secondary Research
- Annual Reports
- White Paper
- Latest Press Release
- Industry Association
- Paid Database
- Investor Presentations

Step 4 - Data Triangulation
Involves using different sources of information in order to increase the validity of a study
These sources are likely to be stakeholders in a program - participants, other researchers, program staff, other community members, and so on.
Then we put all data in single framework & apply various statistical tools to find out the dynamic on the market.
During the analysis stage, feedback from the stakeholder groups would be compared to determine areas of agreement as well as areas of divergence