

Key Insights
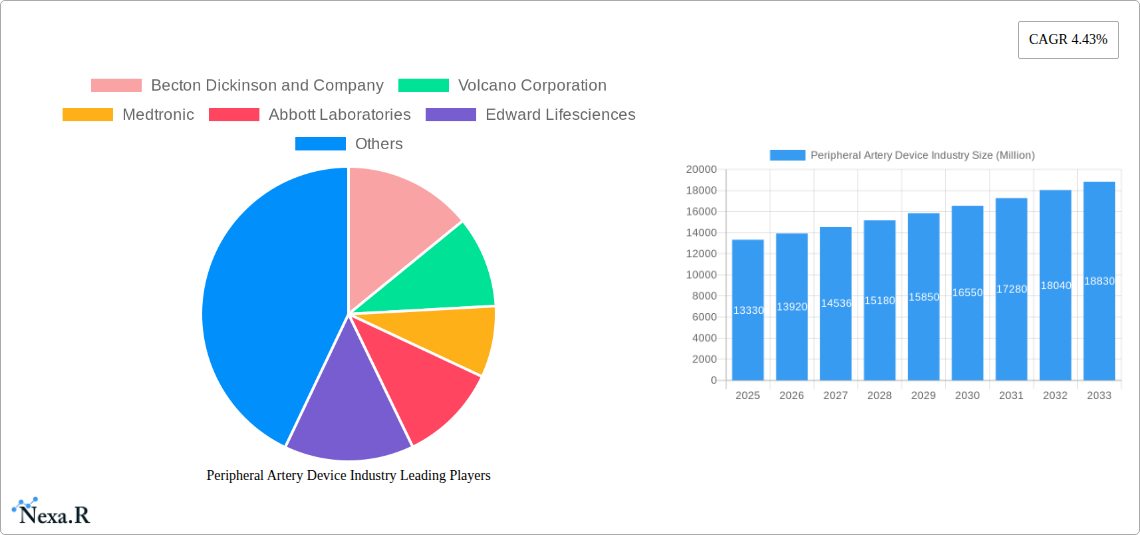
The peripheral artery disease (PAD) device market, valued at $13.33 billion in 2025, is projected to experience robust growth, driven by a rising prevalence of PAD, an aging global population, and advancements in minimally invasive treatment procedures. The market's Compound Annual Growth Rate (CAGR) of 4.43% from 2025 to 2033 reflects a steady increase in demand for effective PAD interventions. Key device segments include peripheral vascular stents, PTA balloon catheters, and guidewires, each contributing significantly to the overall market value. Technological innovations, such as drug-eluting stents and improved catheter designs, are fueling market expansion by enhancing treatment efficacy and reducing complications. Furthermore, increasing awareness about PAD symptoms and improved diagnostic capabilities contribute to early disease detection and prompt treatment, thereby driving market growth. Geographic segmentation reveals strong market presence in North America and Europe, attributed to well-established healthcare infrastructure and higher adoption rates of advanced medical technologies. However, emerging economies in Asia-Pacific are expected to witness significant growth in the coming years due to rising healthcare expenditure and increasing prevalence of risk factors associated with PAD. Competitive landscape analysis indicates that key players like Medtronic, Boston Scientific, and Abbott Laboratories are strategically investing in R&D and expanding their product portfolios to maintain their market position and cater to the evolving needs of the PAD treatment landscape. The market's growth trajectory is also shaped by regulatory approvals, reimbursement policies, and the adoption of new treatment guidelines which directly affect the accessibility and affordability of PAD devices globally.
The continued growth of the PAD device market is heavily influenced by several factors. Government initiatives to improve healthcare infrastructure, particularly in developing nations, are poised to boost accessibility to advanced medical technologies. Furthermore, the increasing collaboration between medical device manufacturers and healthcare providers enhances the market's overall effectiveness and accelerates the adoption of cutting-edge therapies. Challenges, however, remain, including the high cost of PAD treatment, potential adverse events associated with certain devices, and the need for enhanced patient education to raise awareness of PAD and encourage timely medical intervention. Market players are addressing these challenges through the development of cost-effective devices and enhanced patient support programs. Overall, the peripheral artery device market displays substantial growth potential, driven by technological advancements, increased disease prevalence, and positive regulatory developments. This positive outlook positions this sector as a promising investment opportunity for the foreseeable future.
Peripheral Artery Device Industry Market Report: 2019-2033
This comprehensive report provides a detailed analysis of the Peripheral Artery Device (PAD) industry, encompassing market dynamics, growth trends, regional insights, product landscapes, and key player strategies. The report covers the period 2019-2033, with a focus on the forecast period 2025-2033, and utilizes 2025 as the base year. The parent market is the broader medical device industry, while the child market specifically targets PAD treatment solutions. This report offers invaluable insights for industry professionals, investors, and stakeholders seeking to understand and navigate this evolving market. The market size is predicted to reach xx Million units by 2033.
Peripheral Artery Device Industry Market Dynamics & Structure
The peripheral artery device market is characterized by moderate concentration, with key players like Becton Dickinson and Company, Volcano Corporation, Medtronic, Abbott Laboratories, Edward Lifesciences, Cook, Boston Scientific Corporation, and Cordis Corporation holding significant market share. Technological innovation, particularly in drug-eluting stents and minimally invasive procedures, is a major growth driver. Stringent regulatory frameworks, such as FDA approvals, influence market access and product development. Competitive substitutes, such as surgical interventions, exist, but the minimally invasive nature of PAD devices is driving adoption. The aging global population and increasing prevalence of cardiovascular diseases are key demographic drivers. The market has witnessed several mergers and acquisitions (M&A) in recent years, reflecting consolidation and strategic expansion.
- Market Concentration: Moderately concentrated, with top 8 players holding approximately xx% of market share in 2025.
- Technological Innovation: Focus on drug-eluting stents, improved biocompatibility, and minimally invasive techniques.
- Regulatory Landscape: Stringent FDA approvals and CE markings drive product development and market access.
- Competitive Substitutes: Surgical interventions remain a competitive alternative, but minimally invasive procedures are gaining traction.
- End-User Demographics: Aging population and rising prevalence of cardiovascular diseases are key drivers.
- M&A Activity: xx major M&A deals observed between 2019 and 2024, reflecting industry consolidation.
Peripheral Artery Device Industry Growth Trends & Insights
The peripheral artery device market is experiencing steady growth, driven by factors such as increasing prevalence of peripheral artery disease (PAD), technological advancements leading to improved treatment outcomes, and rising healthcare expenditure. The market size expanded from xx Million units in 2019 to xx Million units in 2024, exhibiting a CAGR of xx%. Adoption rates are increasing, especially for minimally invasive procedures. Technological disruptions, such as the introduction of drug-eluting stents and advanced imaging techniques, are further accelerating growth. Changing consumer preferences towards less invasive treatments are contributing to market expansion. The forecast period (2025-2033) anticipates a CAGR of xx%, driven by continued innovation and increasing awareness of PAD. Market penetration is expected to reach xx% by 2033.

Dominant Regions, Countries, or Segments in Peripheral Artery Device Industry
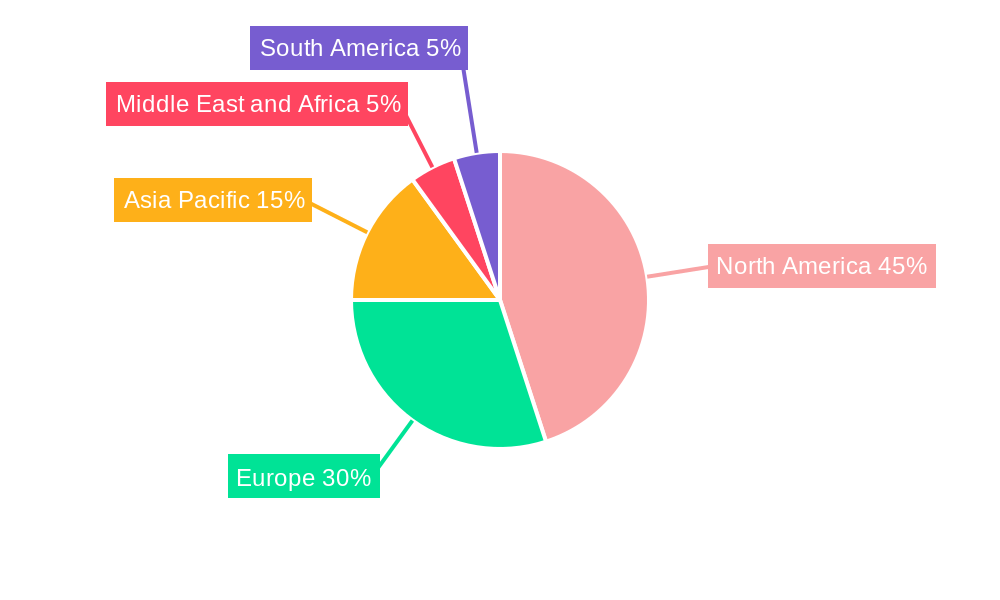
North America currently dominates the peripheral artery device market, driven by high healthcare expenditure, advanced medical infrastructure, and a large patient population. Europe follows as a significant market, with strong regulatory frameworks and technological advancements. Asia Pacific is experiencing rapid growth, propelled by increasing healthcare investment and rising prevalence of PAD. Within device types, Peripheral Vascular Stents and Peripheral Transluminal Angioplasty (PTA) Balloon Catheters hold the largest market share due to widespread adoption and established clinical efficacy.
- North America: High healthcare expenditure, advanced infrastructure, and large patient base drive market dominance.
- Europe: Strong regulatory frameworks and technological advancements contribute to significant market share.
- Asia Pacific: Rapid growth driven by increasing healthcare investments and rising PAD prevalence.
- Dominant Device Types: Peripheral Vascular Stents and PTA Balloon Catheters hold the largest market share due to high adoption and established efficacy.
Peripheral Artery Device Industry Product Landscape
The peripheral artery device market encompasses a wide range of products, including stents, balloon catheters, guidewires, atherectomy devices, embolic protection devices, and inferior vena cava filters. Recent innovations focus on drug-eluting stents with improved biocompatibility and reduced restenosis rates. Minimally invasive devices are gaining popularity due to reduced patient trauma and shorter recovery times. Key performance metrics include stent patency rates, procedural success rates, and long-term clinical outcomes. Unique selling propositions center around improved device design, enhanced drug delivery mechanisms, and reduced complications.
Key Drivers, Barriers & Challenges in Peripheral Artery Device Industry
Key Drivers:
- Increasing prevalence of PAD globally.
- Technological advancements leading to improved treatment outcomes.
- Rising healthcare expenditure and insurance coverage.
Challenges & Restraints:
- High cost of devices limiting access in certain regions.
- Stringent regulatory approvals prolonging product launch timelines.
- Intense competition among established players and emerging companies. This competition impacts pricing and market share. Estimated impact is a reduction in average profit margins by xx% by 2033.
Emerging Opportunities in Peripheral Artery Device Industry
- Untapped markets in emerging economies with high PAD prevalence.
- Development of bioabsorbable stents and other novel materials.
- Focus on personalized medicine approaches to optimize treatment strategies.
- Expansion into new applications, such as chronic limb-threatening ischemia (CLTI).
Growth Accelerators in the Peripheral Artery Device Industry
Technological advancements, particularly in minimally invasive procedures and drug-eluting stents, are driving long-term growth. Strategic partnerships between device manufacturers and healthcare providers are improving market access and clinical outcomes. Market expansion strategies focusing on emerging economies and untapped patient populations are creating new revenue streams.
Key Players Shaping the Peripheral Artery Device Industry Market
- Becton Dickinson and Company
- Volcano Corporation
- Medtronic
- Abbott Laboratories
- Edward Lifesciences
- Cook
- Boston Scientific Corporation
- Cordis Corporation
Notable Milestones in Peripheral Artery Device Industry Sector
- June 2022: Cardio Flow, Inc. receives FDA approval for FreedomFlow Peripheral Guidewire.
- January 2022: Cook Medical receives FDA breakthrough device designation for a new drug-eluting stent for BTK.
In-Depth Peripheral Artery Device Industry Market Outlook
The peripheral artery device market is poised for continued growth, driven by technological innovation, increasing prevalence of PAD, and expanding healthcare access. Strategic partnerships, product diversification, and market expansion into emerging economies will shape future market dynamics. The focus on minimally invasive procedures and personalized medicine will further enhance market potential, creating lucrative opportunities for key players.
Peripheral Artery Device Industry Segmentation
-
1. Device Type
- 1.1. Peripheral Vascular Stents
- 1.2. Peripher
- 1.3. Peripher
- 1.4. Atherectomy Devices
- 1.5. Embolic Protection Devices
- 1.6. Inferior Vena Cava Filters
- 1.7. Other Device Types
Peripheral Artery Device Industry Segmentation By Geography
-
1. North America
- 1.1. United States
- 1.2. Canada
- 1.3. Mexico
-
2. Europe
- 2.1. Germany
- 2.2. United Kingdom
- 2.3. France
- 2.4. Italy
- 2.5. Spain
- 2.6. Rest of Europe
-
3. Asia Pacific
- 3.1. China
- 3.2. Japan
- 3.3. India
- 3.4. Australia
- 3.5. South Korea
- 3.6. Rest of Asia Pacific
-
4. Middle East and Africa
- 4.1. GCC
- 4.2. South Africa
- 4.3. Rest of Middle East and Africa
-
5. South America
- 5.1. Brazil
- 5.2. Argentina
- 5.3. Rest of South America
Peripheral Artery Device Industry REPORT HIGHLIGHTS
| Aspects | Details |
|---|---|
| Study Period | 2019-2033 |
| Base Year | 2024 |
| Estimated Year | 2025 |
| Forecast Period | 2025-2033 |
| Historical Period | 2019-2024 |
| Growth Rate | CAGR of 4.43% from 2019-2033 |
| Segmentation |
|
Table of Contents
- 1. Introduction
- 1.1. Research Scope
- 1.2. Market Segmentation
- 1.3. Research Methodology
- 1.4. Definitions and Assumptions
- 2. Executive Summary
- 2.1. Introduction
- 3. Market Dynamics
- 3.1. Introduction
- 3.2. Market Drivers
- 3.2.1. Rising Demand for Minimally-invasive Procedures; Increase in Incidence of Peripheral Arterial Disease (PAD)
- 3.3. Market Restrains
- 3.3.1. Stringent Regulation Related to Peripheral Vascular Devices
- 3.4. Market Trends
- 3.4.1. Peripheral Vascular Stents are expected to witness growth over the forecast period
- 4. Market Factor Analysis
- 4.1. Porters Five Forces
- 4.2. Supply/Value Chain
- 4.3. PESTEL analysis
- 4.4. Market Entropy
- 4.5. Patent/Trademark Analysis
- 5. Global Peripheral Artery Device Industry Analysis, Insights and Forecast, 2019-2031
- 5.1. Market Analysis, Insights and Forecast - by Device Type
- 5.1.1. Peripheral Vascular Stents
- 5.1.2. Peripher
- 5.1.3. Peripher
- 5.1.4. Atherectomy Devices
- 5.1.5. Embolic Protection Devices
- 5.1.6. Inferior Vena Cava Filters
- 5.1.7. Other Device Types
- 5.2. Market Analysis, Insights and Forecast - by Region
- 5.2.1. North America
- 5.2.2. Europe
- 5.2.3. Asia Pacific
- 5.2.4. Middle East and Africa
- 5.2.5. South America
- 5.1. Market Analysis, Insights and Forecast - by Device Type
- 6. North America Peripheral Artery Device Industry Analysis, Insights and Forecast, 2019-2031
- 6.1. Market Analysis, Insights and Forecast - by Device Type
- 6.1.1. Peripheral Vascular Stents
- 6.1.2. Peripher
- 6.1.3. Peripher
- 6.1.4. Atherectomy Devices
- 6.1.5. Embolic Protection Devices
- 6.1.6. Inferior Vena Cava Filters
- 6.1.7. Other Device Types
- 6.1. Market Analysis, Insights and Forecast - by Device Type
- 7. Europe Peripheral Artery Device Industry Analysis, Insights and Forecast, 2019-2031
- 7.1. Market Analysis, Insights and Forecast - by Device Type
- 7.1.1. Peripheral Vascular Stents
- 7.1.2. Peripher
- 7.1.3. Peripher
- 7.1.4. Atherectomy Devices
- 7.1.5. Embolic Protection Devices
- 7.1.6. Inferior Vena Cava Filters
- 7.1.7. Other Device Types
- 7.1. Market Analysis, Insights and Forecast - by Device Type
- 8. Asia Pacific Peripheral Artery Device Industry Analysis, Insights and Forecast, 2019-2031
- 8.1. Market Analysis, Insights and Forecast - by Device Type
- 8.1.1. Peripheral Vascular Stents
- 8.1.2. Peripher
- 8.1.3. Peripher
- 8.1.4. Atherectomy Devices
- 8.1.5. Embolic Protection Devices
- 8.1.6. Inferior Vena Cava Filters
- 8.1.7. Other Device Types
- 8.1. Market Analysis, Insights and Forecast - by Device Type
- 9. Middle East and Africa Peripheral Artery Device Industry Analysis, Insights and Forecast, 2019-2031
- 9.1. Market Analysis, Insights and Forecast - by Device Type
- 9.1.1. Peripheral Vascular Stents
- 9.1.2. Peripher
- 9.1.3. Peripher
- 9.1.4. Atherectomy Devices
- 9.1.5. Embolic Protection Devices
- 9.1.6. Inferior Vena Cava Filters
- 9.1.7. Other Device Types
- 9.1. Market Analysis, Insights and Forecast - by Device Type
- 10. South America Peripheral Artery Device Industry Analysis, Insights and Forecast, 2019-2031
- 10.1. Market Analysis, Insights and Forecast - by Device Type
- 10.1.1. Peripheral Vascular Stents
- 10.1.2. Peripher
- 10.1.3. Peripher
- 10.1.4. Atherectomy Devices
- 10.1.5. Embolic Protection Devices
- 10.1.6. Inferior Vena Cava Filters
- 10.1.7. Other Device Types
- 10.1. Market Analysis, Insights and Forecast - by Device Type
- 11. North America Peripheral Artery Device Industry Analysis, Insights and Forecast, 2019-2031
- 11.1. Market Analysis, Insights and Forecast - By Country/Sub-region
- 11.1.1 United States
- 11.1.2 Canada
- 11.1.3 Mexico
- 12. Europe Peripheral Artery Device Industry Analysis, Insights and Forecast, 2019-2031
- 12.1. Market Analysis, Insights and Forecast - By Country/Sub-region
- 12.1.1 Germany
- 12.1.2 United Kingdom
- 12.1.3 France
- 12.1.4 Italy
- 12.1.5 Spain
- 12.1.6 Rest of Europe
- 13. Asia Pacific Peripheral Artery Device Industry Analysis, Insights and Forecast, 2019-2031
- 13.1. Market Analysis, Insights and Forecast - By Country/Sub-region
- 13.1.1 China
- 13.1.2 Japan
- 13.1.3 India
- 13.1.4 Australia
- 13.1.5 South Korea
- 13.1.6 Rest of Asia Pacific
- 14. Middle East and Africa Peripheral Artery Device Industry Analysis, Insights and Forecast, 2019-2031
- 14.1. Market Analysis, Insights and Forecast - By Country/Sub-region
- 14.1.1 GCC
- 14.1.2 South Africa
- 14.1.3 Rest of Middle East and Africa
- 15. South America Peripheral Artery Device Industry Analysis, Insights and Forecast, 2019-2031
- 15.1. Market Analysis, Insights and Forecast - By Country/Sub-region
- 15.1.1 Brazil
- 15.1.2 Argentina
- 15.1.3 Rest of South America
- 16. Competitive Analysis
- 16.1. Global Market Share Analysis 2024
- 16.2. Company Profiles
- 16.2.1 Becton Dickinson and Company
- 16.2.1.1. Overview
- 16.2.1.2. Products
- 16.2.1.3. SWOT Analysis
- 16.2.1.4. Recent Developments
- 16.2.1.5. Financials (Based on Availability)
- 16.2.2 Volcano Corporation
- 16.2.2.1. Overview
- 16.2.2.2. Products
- 16.2.2.3. SWOT Analysis
- 16.2.2.4. Recent Developments
- 16.2.2.5. Financials (Based on Availability)
- 16.2.3 Medtronic
- 16.2.3.1. Overview
- 16.2.3.2. Products
- 16.2.3.3. SWOT Analysis
- 16.2.3.4. Recent Developments
- 16.2.3.5. Financials (Based on Availability)
- 16.2.4 Abbott Laboratories
- 16.2.4.1. Overview
- 16.2.4.2. Products
- 16.2.4.3. SWOT Analysis
- 16.2.4.4. Recent Developments
- 16.2.4.5. Financials (Based on Availability)
- 16.2.5 Edward Lifesciences
- 16.2.5.1. Overview
- 16.2.5.2. Products
- 16.2.5.3. SWOT Analysis
- 16.2.5.4. Recent Developments
- 16.2.5.5. Financials (Based on Availability)
- 16.2.6 Cook
- 16.2.6.1. Overview
- 16.2.6.2. Products
- 16.2.6.3. SWOT Analysis
- 16.2.6.4. Recent Developments
- 16.2.6.5. Financials (Based on Availability)
- 16.2.7 Boston Scientific Corporation
- 16.2.7.1. Overview
- 16.2.7.2. Products
- 16.2.7.3. SWOT Analysis
- 16.2.7.4. Recent Developments
- 16.2.7.5. Financials (Based on Availability)
- 16.2.8 Cordis Corporation
- 16.2.8.1. Overview
- 16.2.8.2. Products
- 16.2.8.3. SWOT Analysis
- 16.2.8.4. Recent Developments
- 16.2.8.5. Financials (Based on Availability)
- 16.2.1 Becton Dickinson and Company
List of Figures
- Figure 1: Global Peripheral Artery Device Industry Revenue Breakdown (Million, %) by Region 2024 & 2032
- Figure 2: Global Peripheral Artery Device Industry Volume Breakdown (K Units, %) by Region 2024 & 2032
- Figure 3: North America Peripheral Artery Device Industry Revenue (Million), by Country 2024 & 2032
- Figure 4: North America Peripheral Artery Device Industry Volume (K Units), by Country 2024 & 2032
- Figure 5: North America Peripheral Artery Device Industry Revenue Share (%), by Country 2024 & 2032
- Figure 6: North America Peripheral Artery Device Industry Volume Share (%), by Country 2024 & 2032
- Figure 7: Europe Peripheral Artery Device Industry Revenue (Million), by Country 2024 & 2032
- Figure 8: Europe Peripheral Artery Device Industry Volume (K Units), by Country 2024 & 2032
- Figure 9: Europe Peripheral Artery Device Industry Revenue Share (%), by Country 2024 & 2032
- Figure 10: Europe Peripheral Artery Device Industry Volume Share (%), by Country 2024 & 2032
- Figure 11: Asia Pacific Peripheral Artery Device Industry Revenue (Million), by Country 2024 & 2032
- Figure 12: Asia Pacific Peripheral Artery Device Industry Volume (K Units), by Country 2024 & 2032
- Figure 13: Asia Pacific Peripheral Artery Device Industry Revenue Share (%), by Country 2024 & 2032
- Figure 14: Asia Pacific Peripheral Artery Device Industry Volume Share (%), by Country 2024 & 2032
- Figure 15: Middle East and Africa Peripheral Artery Device Industry Revenue (Million), by Country 2024 & 2032
- Figure 16: Middle East and Africa Peripheral Artery Device Industry Volume (K Units), by Country 2024 & 2032
- Figure 17: Middle East and Africa Peripheral Artery Device Industry Revenue Share (%), by Country 2024 & 2032
- Figure 18: Middle East and Africa Peripheral Artery Device Industry Volume Share (%), by Country 2024 & 2032
- Figure 19: South America Peripheral Artery Device Industry Revenue (Million), by Country 2024 & 2032
- Figure 20: South America Peripheral Artery Device Industry Volume (K Units), by Country 2024 & 2032
- Figure 21: South America Peripheral Artery Device Industry Revenue Share (%), by Country 2024 & 2032
- Figure 22: South America Peripheral Artery Device Industry Volume Share (%), by Country 2024 & 2032
- Figure 23: North America Peripheral Artery Device Industry Revenue (Million), by Device Type 2024 & 2032
- Figure 24: North America Peripheral Artery Device Industry Volume (K Units), by Device Type 2024 & 2032
- Figure 25: North America Peripheral Artery Device Industry Revenue Share (%), by Device Type 2024 & 2032
- Figure 26: North America Peripheral Artery Device Industry Volume Share (%), by Device Type 2024 & 2032
- Figure 27: North America Peripheral Artery Device Industry Revenue (Million), by Country 2024 & 2032
- Figure 28: North America Peripheral Artery Device Industry Volume (K Units), by Country 2024 & 2032
- Figure 29: North America Peripheral Artery Device Industry Revenue Share (%), by Country 2024 & 2032
- Figure 30: North America Peripheral Artery Device Industry Volume Share (%), by Country 2024 & 2032
- Figure 31: Europe Peripheral Artery Device Industry Revenue (Million), by Device Type 2024 & 2032
- Figure 32: Europe Peripheral Artery Device Industry Volume (K Units), by Device Type 2024 & 2032
- Figure 33: Europe Peripheral Artery Device Industry Revenue Share (%), by Device Type 2024 & 2032
- Figure 34: Europe Peripheral Artery Device Industry Volume Share (%), by Device Type 2024 & 2032
- Figure 35: Europe Peripheral Artery Device Industry Revenue (Million), by Country 2024 & 2032
- Figure 36: Europe Peripheral Artery Device Industry Volume (K Units), by Country 2024 & 2032
- Figure 37: Europe Peripheral Artery Device Industry Revenue Share (%), by Country 2024 & 2032
- Figure 38: Europe Peripheral Artery Device Industry Volume Share (%), by Country 2024 & 2032
- Figure 39: Asia Pacific Peripheral Artery Device Industry Revenue (Million), by Device Type 2024 & 2032
- Figure 40: Asia Pacific Peripheral Artery Device Industry Volume (K Units), by Device Type 2024 & 2032
- Figure 41: Asia Pacific Peripheral Artery Device Industry Revenue Share (%), by Device Type 2024 & 2032
- Figure 42: Asia Pacific Peripheral Artery Device Industry Volume Share (%), by Device Type 2024 & 2032
- Figure 43: Asia Pacific Peripheral Artery Device Industry Revenue (Million), by Country 2024 & 2032
- Figure 44: Asia Pacific Peripheral Artery Device Industry Volume (K Units), by Country 2024 & 2032
- Figure 45: Asia Pacific Peripheral Artery Device Industry Revenue Share (%), by Country 2024 & 2032
- Figure 46: Asia Pacific Peripheral Artery Device Industry Volume Share (%), by Country 2024 & 2032
- Figure 47: Middle East and Africa Peripheral Artery Device Industry Revenue (Million), by Device Type 2024 & 2032
- Figure 48: Middle East and Africa Peripheral Artery Device Industry Volume (K Units), by Device Type 2024 & 2032
- Figure 49: Middle East and Africa Peripheral Artery Device Industry Revenue Share (%), by Device Type 2024 & 2032
- Figure 50: Middle East and Africa Peripheral Artery Device Industry Volume Share (%), by Device Type 2024 & 2032
- Figure 51: Middle East and Africa Peripheral Artery Device Industry Revenue (Million), by Country 2024 & 2032
- Figure 52: Middle East and Africa Peripheral Artery Device Industry Volume (K Units), by Country 2024 & 2032
- Figure 53: Middle East and Africa Peripheral Artery Device Industry Revenue Share (%), by Country 2024 & 2032
- Figure 54: Middle East and Africa Peripheral Artery Device Industry Volume Share (%), by Country 2024 & 2032
- Figure 55: South America Peripheral Artery Device Industry Revenue (Million), by Device Type 2024 & 2032
- Figure 56: South America Peripheral Artery Device Industry Volume (K Units), by Device Type 2024 & 2032
- Figure 57: South America Peripheral Artery Device Industry Revenue Share (%), by Device Type 2024 & 2032
- Figure 58: South America Peripheral Artery Device Industry Volume Share (%), by Device Type 2024 & 2032
- Figure 59: South America Peripheral Artery Device Industry Revenue (Million), by Country 2024 & 2032
- Figure 60: South America Peripheral Artery Device Industry Volume (K Units), by Country 2024 & 2032
- Figure 61: South America Peripheral Artery Device Industry Revenue Share (%), by Country 2024 & 2032
- Figure 62: South America Peripheral Artery Device Industry Volume Share (%), by Country 2024 & 2032
List of Tables
- Table 1: Global Peripheral Artery Device Industry Revenue Million Forecast, by Region 2019 & 2032
- Table 2: Global Peripheral Artery Device Industry Volume K Units Forecast, by Region 2019 & 2032
- Table 3: Global Peripheral Artery Device Industry Revenue Million Forecast, by Device Type 2019 & 2032
- Table 4: Global Peripheral Artery Device Industry Volume K Units Forecast, by Device Type 2019 & 2032
- Table 5: Global Peripheral Artery Device Industry Revenue Million Forecast, by Region 2019 & 2032
- Table 6: Global Peripheral Artery Device Industry Volume K Units Forecast, by Region 2019 & 2032
- Table 7: Global Peripheral Artery Device Industry Revenue Million Forecast, by Country 2019 & 2032
- Table 8: Global Peripheral Artery Device Industry Volume K Units Forecast, by Country 2019 & 2032
- Table 9: United States Peripheral Artery Device Industry Revenue (Million) Forecast, by Application 2019 & 2032
- Table 10: United States Peripheral Artery Device Industry Volume (K Units) Forecast, by Application 2019 & 2032
- Table 11: Canada Peripheral Artery Device Industry Revenue (Million) Forecast, by Application 2019 & 2032
- Table 12: Canada Peripheral Artery Device Industry Volume (K Units) Forecast, by Application 2019 & 2032
- Table 13: Mexico Peripheral Artery Device Industry Revenue (Million) Forecast, by Application 2019 & 2032
- Table 14: Mexico Peripheral Artery Device Industry Volume (K Units) Forecast, by Application 2019 & 2032
- Table 15: Global Peripheral Artery Device Industry Revenue Million Forecast, by Country 2019 & 2032
- Table 16: Global Peripheral Artery Device Industry Volume K Units Forecast, by Country 2019 & 2032
- Table 17: Germany Peripheral Artery Device Industry Revenue (Million) Forecast, by Application 2019 & 2032
- Table 18: Germany Peripheral Artery Device Industry Volume (K Units) Forecast, by Application 2019 & 2032
- Table 19: United Kingdom Peripheral Artery Device Industry Revenue (Million) Forecast, by Application 2019 & 2032
- Table 20: United Kingdom Peripheral Artery Device Industry Volume (K Units) Forecast, by Application 2019 & 2032
- Table 21: France Peripheral Artery Device Industry Revenue (Million) Forecast, by Application 2019 & 2032
- Table 22: France Peripheral Artery Device Industry Volume (K Units) Forecast, by Application 2019 & 2032
- Table 23: Italy Peripheral Artery Device Industry Revenue (Million) Forecast, by Application 2019 & 2032
- Table 24: Italy Peripheral Artery Device Industry Volume (K Units) Forecast, by Application 2019 & 2032
- Table 25: Spain Peripheral Artery Device Industry Revenue (Million) Forecast, by Application 2019 & 2032
- Table 26: Spain Peripheral Artery Device Industry Volume (K Units) Forecast, by Application 2019 & 2032
- Table 27: Rest of Europe Peripheral Artery Device Industry Revenue (Million) Forecast, by Application 2019 & 2032
- Table 28: Rest of Europe Peripheral Artery Device Industry Volume (K Units) Forecast, by Application 2019 & 2032
- Table 29: Global Peripheral Artery Device Industry Revenue Million Forecast, by Country 2019 & 2032
- Table 30: Global Peripheral Artery Device Industry Volume K Units Forecast, by Country 2019 & 2032
- Table 31: China Peripheral Artery Device Industry Revenue (Million) Forecast, by Application 2019 & 2032
- Table 32: China Peripheral Artery Device Industry Volume (K Units) Forecast, by Application 2019 & 2032
- Table 33: Japan Peripheral Artery Device Industry Revenue (Million) Forecast, by Application 2019 & 2032
- Table 34: Japan Peripheral Artery Device Industry Volume (K Units) Forecast, by Application 2019 & 2032
- Table 35: India Peripheral Artery Device Industry Revenue (Million) Forecast, by Application 2019 & 2032
- Table 36: India Peripheral Artery Device Industry Volume (K Units) Forecast, by Application 2019 & 2032
- Table 37: Australia Peripheral Artery Device Industry Revenue (Million) Forecast, by Application 2019 & 2032
- Table 38: Australia Peripheral Artery Device Industry Volume (K Units) Forecast, by Application 2019 & 2032
- Table 39: South Korea Peripheral Artery Device Industry Revenue (Million) Forecast, by Application 2019 & 2032
- Table 40: South Korea Peripheral Artery Device Industry Volume (K Units) Forecast, by Application 2019 & 2032
- Table 41: Rest of Asia Pacific Peripheral Artery Device Industry Revenue (Million) Forecast, by Application 2019 & 2032
- Table 42: Rest of Asia Pacific Peripheral Artery Device Industry Volume (K Units) Forecast, by Application 2019 & 2032
- Table 43: Global Peripheral Artery Device Industry Revenue Million Forecast, by Country 2019 & 2032
- Table 44: Global Peripheral Artery Device Industry Volume K Units Forecast, by Country 2019 & 2032
- Table 45: GCC Peripheral Artery Device Industry Revenue (Million) Forecast, by Application 2019 & 2032
- Table 46: GCC Peripheral Artery Device Industry Volume (K Units) Forecast, by Application 2019 & 2032
- Table 47: South Africa Peripheral Artery Device Industry Revenue (Million) Forecast, by Application 2019 & 2032
- Table 48: South Africa Peripheral Artery Device Industry Volume (K Units) Forecast, by Application 2019 & 2032
- Table 49: Rest of Middle East and Africa Peripheral Artery Device Industry Revenue (Million) Forecast, by Application 2019 & 2032
- Table 50: Rest of Middle East and Africa Peripheral Artery Device Industry Volume (K Units) Forecast, by Application 2019 & 2032
- Table 51: Global Peripheral Artery Device Industry Revenue Million Forecast, by Country 2019 & 2032
- Table 52: Global Peripheral Artery Device Industry Volume K Units Forecast, by Country 2019 & 2032
- Table 53: Brazil Peripheral Artery Device Industry Revenue (Million) Forecast, by Application 2019 & 2032
- Table 54: Brazil Peripheral Artery Device Industry Volume (K Units) Forecast, by Application 2019 & 2032
- Table 55: Argentina Peripheral Artery Device Industry Revenue (Million) Forecast, by Application 2019 & 2032
- Table 56: Argentina Peripheral Artery Device Industry Volume (K Units) Forecast, by Application 2019 & 2032
- Table 57: Rest of South America Peripheral Artery Device Industry Revenue (Million) Forecast, by Application 2019 & 2032
- Table 58: Rest of South America Peripheral Artery Device Industry Volume (K Units) Forecast, by Application 2019 & 2032
- Table 59: Global Peripheral Artery Device Industry Revenue Million Forecast, by Device Type 2019 & 2032
- Table 60: Global Peripheral Artery Device Industry Volume K Units Forecast, by Device Type 2019 & 2032
- Table 61: Global Peripheral Artery Device Industry Revenue Million Forecast, by Country 2019 & 2032
- Table 62: Global Peripheral Artery Device Industry Volume K Units Forecast, by Country 2019 & 2032
- Table 63: United States Peripheral Artery Device Industry Revenue (Million) Forecast, by Application 2019 & 2032
- Table 64: United States Peripheral Artery Device Industry Volume (K Units) Forecast, by Application 2019 & 2032
- Table 65: Canada Peripheral Artery Device Industry Revenue (Million) Forecast, by Application 2019 & 2032
- Table 66: Canada Peripheral Artery Device Industry Volume (K Units) Forecast, by Application 2019 & 2032
- Table 67: Mexico Peripheral Artery Device Industry Revenue (Million) Forecast, by Application 2019 & 2032
- Table 68: Mexico Peripheral Artery Device Industry Volume (K Units) Forecast, by Application 2019 & 2032
- Table 69: Global Peripheral Artery Device Industry Revenue Million Forecast, by Device Type 2019 & 2032
- Table 70: Global Peripheral Artery Device Industry Volume K Units Forecast, by Device Type 2019 & 2032
- Table 71: Global Peripheral Artery Device Industry Revenue Million Forecast, by Country 2019 & 2032
- Table 72: Global Peripheral Artery Device Industry Volume K Units Forecast, by Country 2019 & 2032
- Table 73: Germany Peripheral Artery Device Industry Revenue (Million) Forecast, by Application 2019 & 2032
- Table 74: Germany Peripheral Artery Device Industry Volume (K Units) Forecast, by Application 2019 & 2032
- Table 75: United Kingdom Peripheral Artery Device Industry Revenue (Million) Forecast, by Application 2019 & 2032
- Table 76: United Kingdom Peripheral Artery Device Industry Volume (K Units) Forecast, by Application 2019 & 2032
- Table 77: France Peripheral Artery Device Industry Revenue (Million) Forecast, by Application 2019 & 2032
- Table 78: France Peripheral Artery Device Industry Volume (K Units) Forecast, by Application 2019 & 2032
- Table 79: Italy Peripheral Artery Device Industry Revenue (Million) Forecast, by Application 2019 & 2032
- Table 80: Italy Peripheral Artery Device Industry Volume (K Units) Forecast, by Application 2019 & 2032
- Table 81: Spain Peripheral Artery Device Industry Revenue (Million) Forecast, by Application 2019 & 2032
- Table 82: Spain Peripheral Artery Device Industry Volume (K Units) Forecast, by Application 2019 & 2032
- Table 83: Rest of Europe Peripheral Artery Device Industry Revenue (Million) Forecast, by Application 2019 & 2032
- Table 84: Rest of Europe Peripheral Artery Device Industry Volume (K Units) Forecast, by Application 2019 & 2032
- Table 85: Global Peripheral Artery Device Industry Revenue Million Forecast, by Device Type 2019 & 2032
- Table 86: Global Peripheral Artery Device Industry Volume K Units Forecast, by Device Type 2019 & 2032
- Table 87: Global Peripheral Artery Device Industry Revenue Million Forecast, by Country 2019 & 2032
- Table 88: Global Peripheral Artery Device Industry Volume K Units Forecast, by Country 2019 & 2032
- Table 89: China Peripheral Artery Device Industry Revenue (Million) Forecast, by Application 2019 & 2032
- Table 90: China Peripheral Artery Device Industry Volume (K Units) Forecast, by Application 2019 & 2032
- Table 91: Japan Peripheral Artery Device Industry Revenue (Million) Forecast, by Application 2019 & 2032
- Table 92: Japan Peripheral Artery Device Industry Volume (K Units) Forecast, by Application 2019 & 2032
- Table 93: India Peripheral Artery Device Industry Revenue (Million) Forecast, by Application 2019 & 2032
- Table 94: India Peripheral Artery Device Industry Volume (K Units) Forecast, by Application 2019 & 2032
- Table 95: Australia Peripheral Artery Device Industry Revenue (Million) Forecast, by Application 2019 & 2032
- Table 96: Australia Peripheral Artery Device Industry Volume (K Units) Forecast, by Application 2019 & 2032
- Table 97: South Korea Peripheral Artery Device Industry Revenue (Million) Forecast, by Application 2019 & 2032
- Table 98: South Korea Peripheral Artery Device Industry Volume (K Units) Forecast, by Application 2019 & 2032
- Table 99: Rest of Asia Pacific Peripheral Artery Device Industry Revenue (Million) Forecast, by Application 2019 & 2032
- Table 100: Rest of Asia Pacific Peripheral Artery Device Industry Volume (K Units) Forecast, by Application 2019 & 2032
- Table 101: Global Peripheral Artery Device Industry Revenue Million Forecast, by Device Type 2019 & 2032
- Table 102: Global Peripheral Artery Device Industry Volume K Units Forecast, by Device Type 2019 & 2032
- Table 103: Global Peripheral Artery Device Industry Revenue Million Forecast, by Country 2019 & 2032
- Table 104: Global Peripheral Artery Device Industry Volume K Units Forecast, by Country 2019 & 2032
- Table 105: GCC Peripheral Artery Device Industry Revenue (Million) Forecast, by Application 2019 & 2032
- Table 106: GCC Peripheral Artery Device Industry Volume (K Units) Forecast, by Application 2019 & 2032
- Table 107: South Africa Peripheral Artery Device Industry Revenue (Million) Forecast, by Application 2019 & 2032
- Table 108: South Africa Peripheral Artery Device Industry Volume (K Units) Forecast, by Application 2019 & 2032
- Table 109: Rest of Middle East and Africa Peripheral Artery Device Industry Revenue (Million) Forecast, by Application 2019 & 2032
- Table 110: Rest of Middle East and Africa Peripheral Artery Device Industry Volume (K Units) Forecast, by Application 2019 & 2032
- Table 111: Global Peripheral Artery Device Industry Revenue Million Forecast, by Device Type 2019 & 2032
- Table 112: Global Peripheral Artery Device Industry Volume K Units Forecast, by Device Type 2019 & 2032
- Table 113: Global Peripheral Artery Device Industry Revenue Million Forecast, by Country 2019 & 2032
- Table 114: Global Peripheral Artery Device Industry Volume K Units Forecast, by Country 2019 & 2032
- Table 115: Brazil Peripheral Artery Device Industry Revenue (Million) Forecast, by Application 2019 & 2032
- Table 116: Brazil Peripheral Artery Device Industry Volume (K Units) Forecast, by Application 2019 & 2032
- Table 117: Argentina Peripheral Artery Device Industry Revenue (Million) Forecast, by Application 2019 & 2032
- Table 118: Argentina Peripheral Artery Device Industry Volume (K Units) Forecast, by Application 2019 & 2032
- Table 119: Rest of South America Peripheral Artery Device Industry Revenue (Million) Forecast, by Application 2019 & 2032
- Table 120: Rest of South America Peripheral Artery Device Industry Volume (K Units) Forecast, by Application 2019 & 2032
Frequently Asked Questions
1. What is the projected Compound Annual Growth Rate (CAGR) of the Peripheral Artery Device Industry?
The projected CAGR is approximately 4.43%.
2. Which companies are prominent players in the Peripheral Artery Device Industry?
Key companies in the market include Becton Dickinson and Company, Volcano Corporation, Medtronic, Abbott Laboratories, Edward Lifesciences, Cook, Boston Scientific Corporation, Cordis Corporation.
3. What are the main segments of the Peripheral Artery Device Industry?
The market segments include Device Type.
4. Can you provide details about the market size?
The market size is estimated to be USD 13.33 Million as of 2022.
5. What are some drivers contributing to market growth?
Rising Demand for Minimally-invasive Procedures; Increase in Incidence of Peripheral Arterial Disease (PAD).
6. What are the notable trends driving market growth?
Peripheral Vascular Stents are expected to witness growth over the forecast period.
7. Are there any restraints impacting market growth?
Stringent Regulation Related to Peripheral Vascular Devices.
8. Can you provide examples of recent developments in the market?
In June 2022, Cardio Flow, Inc., a medical device company and manufacturer of minimally invasive peripheral vascular devices to treat peripheral artery disease (PAD), announced United States Food and Drug Administration (FDA) approval for the company's FreedomFlow Peripheral Guidewire.
9. What pricing options are available for accessing the report?
Pricing options include single-user, multi-user, and enterprise licenses priced at USD 4750, USD 5250, and USD 8750 respectively.
10. Is the market size provided in terms of value or volume?
The market size is provided in terms of value, measured in Million and volume, measured in K Units.
11. Are there any specific market keywords associated with the report?
Yes, the market keyword associated with the report is "Peripheral Artery Device Industry," which aids in identifying and referencing the specific market segment covered.
12. How do I determine which pricing option suits my needs best?
The pricing options vary based on user requirements and access needs. Individual users may opt for single-user licenses, while businesses requiring broader access may choose multi-user or enterprise licenses for cost-effective access to the report.
13. Are there any additional resources or data provided in the Peripheral Artery Device Industry report?
While the report offers comprehensive insights, it's advisable to review the specific contents or supplementary materials provided to ascertain if additional resources or data are available.
14. How can I stay updated on further developments or reports in the Peripheral Artery Device Industry?
To stay informed about further developments, trends, and reports in the Peripheral Artery Device Industry, consider subscribing to industry newsletters, following relevant companies and organizations, or regularly checking reputable industry news sources and publications.
Methodology
Step 1 - Identification of Relevant Samples Size from Population Database


Step 2 - Approaches for Defining Global Market Size (Value, Volume* & Price*)

Note*: In applicable scenarios
Step 3 - Data Sources
Primary Research
- Web Analytics
- Survey Reports
- Research Institute
- Latest Research Reports
- Opinion Leaders
Secondary Research
- Annual Reports
- White Paper
- Latest Press Release
- Industry Association
- Paid Database
- Investor Presentations

Step 4 - Data Triangulation
Involves using different sources of information in order to increase the validity of a study
These sources are likely to be stakeholders in a program - participants, other researchers, program staff, other community members, and so on.
Then we put all data in single framework & apply various statistical tools to find out the dynamic on the market.
During the analysis stage, feedback from the stakeholder groups would be compared to determine areas of agreement as well as areas of divergence
