

Key Insights
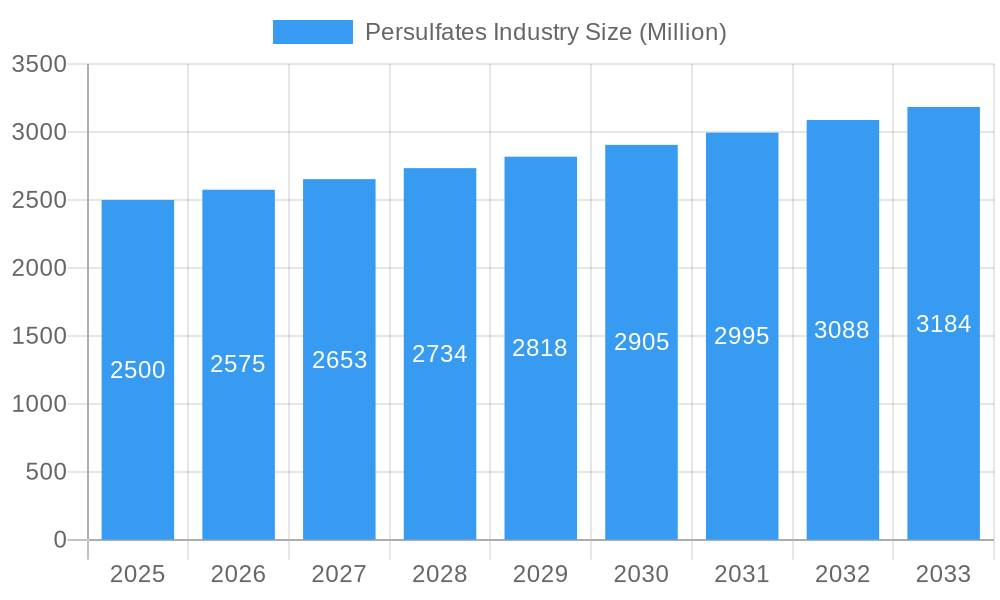
The persulfates market, valued at approximately $XX million in 2025, is projected to experience robust growth with a Compound Annual Growth Rate (CAGR) exceeding 3.00% from 2025 to 2033. This expansion is driven by several key factors. The increasing demand for persulfates in the polymer industry as initiators for polymerization reactions is a significant contributor. Furthermore, their application in enhanced oil recovery (EOR) techniques within the oil and gas sector fuels market growth, as does the rising need for effective bleaching and sizing agents in the pulp, paper, and textile industries. The expanding cosmetics and personal care sectors, utilizing persulfates for their oxidation properties, also contribute to market expansion. Technological advancements leading to more efficient and environmentally friendly persulfate production processes are further boosting market prospects. Growth is expected to be particularly strong in the Asia-Pacific region, driven by rapid industrialization and increasing demand from developing economies such as China and India.
Persulfates Industry Market Size (In Billion)
However, the market also faces certain restraints. Fluctuations in raw material prices, particularly for the primary components used in persulfate production, can impact profitability and potentially hinder market growth. Stringent environmental regulations regarding the disposal of persulfates and their byproducts also pose a challenge. Competitive pressures from alternative bleaching and oxidation agents and regional variations in regulatory compliance further add to market complexities. Nevertheless, the overall positive outlook for the persulfates market remains strong, driven by the diverse applications and the continuous innovation in this sector. The market segmentation by type (sodium, potassium, ammonium persulfate) and application (polymer initiator, EOR, bleaching) provides opportunities for specialized players targeting niche segments. The global presence of major players, as well as regional variations in demand and economic factors, will continue to shape the landscape of this expanding market.
Persulfates Industry Company Market Share
Persulfates Industry Market Report: 2019-2033
This comprehensive report provides an in-depth analysis of the global persulfates market, encompassing market dynamics, growth trends, regional analysis, competitive landscape, and future outlook. The study period covers 2019-2033, with 2025 as the base and estimated year. The forecast period spans 2025-2033, while the historical period encompasses 2019-2024. This report is essential for industry professionals, investors, and stakeholders seeking a detailed understanding of this dynamic market. The market size is projected to reach xx Million by 2033.
Persulfates Industry Market Dynamics & Structure
The global persulfates market is characterized by moderate concentration, with several key players holding significant market share. Technological innovation, particularly in enhancing product efficiency and sustainability, is a key driver. Stringent environmental regulations, particularly concerning wastewater treatment, influence market dynamics. Competitive substitutes, such as other oxidizing agents, exist, posing challenges to market growth. End-user demographics, especially in rapidly industrializing economies, significantly impact demand. Mergers and acquisitions (M&A) activity has been relatively moderate, but consolidation is expected to increase.
- Market Concentration: Moderately concentrated, with top 5 players holding approximately xx% market share in 2025.
- Technological Innovation: Focus on improving energy efficiency and reducing environmental impact.
- Regulatory Framework: Stringent environmental regulations driving demand for sustainable solutions.
- Competitive Substitutes: Other oxidizing agents like hydrogen peroxide and chlorine dioxide.
- M&A Trends: Moderate activity, with potential for increased consolidation in the forecast period.
- End-user Demographics: Growing demand from emerging economies with expanding industrial sectors.
Persulfates Industry Growth Trends & Insights
The persulfates market exhibits a steady growth trajectory, driven by increasing demand across diverse end-user industries. The market witnessed a CAGR of xx% during the historical period (2019-2024) and is projected to maintain a CAGR of xx% during the forecast period (2025-2033). Technological advancements, such as the development of high-performance persulfates with improved efficiency and reduced environmental impact, fuel market expansion. Shifting consumer preferences towards eco-friendly products also contribute to market growth. Adoption rates are highest in established industrial sectors, but increasing penetration in emerging applications is anticipated. Market penetration in specific regions, like Asia-Pacific, shows considerable potential.
(Note: This section requires specific data to populate the XXX placeholder with quantifiable metrics like precise CAGR and market penetration figures.)
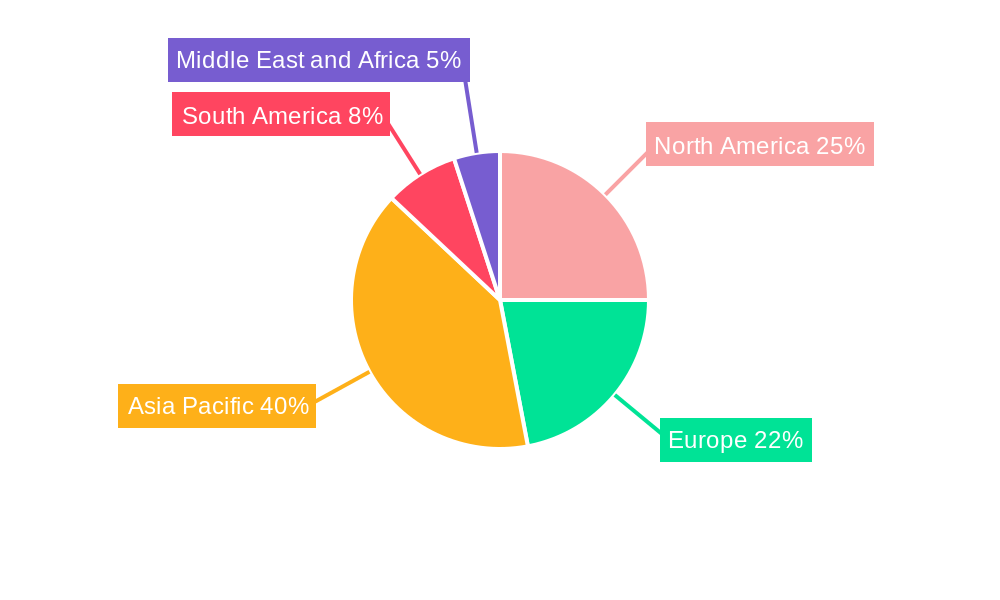
Dominant Regions, Countries, or Segments in Persulfates Industry
The Asia-Pacific region dominates the global persulfates market, driven by robust industrial growth, particularly in China and India. Within end-user industries, the Polymer segment holds the largest market share, followed by Pulp & Paper and Water Treatment. Among persulfate types, Sodium Persulfate accounts for the highest market share due to its cost-effectiveness and versatility. The Polymer initiator application is the leading segment, followed by enhanced oil recovery and bleaching.
- Asia-Pacific: Leading region due to strong industrial growth and expanding manufacturing sectors.
- China & India: Key drivers of regional growth due to their significant industrial capacity.
- Polymer Segment: Largest end-user industry due to widespread applications in polymer production.
- Sodium Persulfate: Predominant type due to its cost-effectiveness and widespread usability.
- Polymer Initiator Application: Largest application segment, owing to its importance in various polymer production processes.
Persulfates Industry Product Landscape
The persulfates market features a range of products tailored to specific applications. Innovations focus on enhanced purity, improved solubility, and tailored particle sizes to optimize performance. Unique selling propositions often revolve around superior oxidation efficiency, reduced environmental impact, and improved handling characteristics. Technological advancements include the development of specialized formulations for niche applications and processes. This continuous improvement fuels market competitiveness and drives product diversification.
Key Drivers, Barriers & Challenges in Persulfates Industry
Key Drivers: The persulfates market is propelled by factors such as increasing demand from the growing polymer, textile, and water treatment industries; technological advancements leading to improved efficiency and sustainability; and favorable government policies promoting industrial development and environmental protection.
Challenges & Restraints: Supply chain disruptions caused by geopolitical events and raw material price fluctuations can affect market stability. Stringent environmental regulations and safety concerns related to persulfate handling pose challenges. Intense competition from substitute oxidizing agents puts pressure on prices and market shares.
Emerging Opportunities in Persulfates Industry
Emerging opportunities lie in the exploration of novel applications of persulfates, particularly in the field of advanced oxidation processes (AOPs) for environmental remediation. Untapped markets in developing economies and increased demand for specialized persulfate formulations for niche applications represent further growth potentials. The development of sustainable and eco-friendly persulfate production methods also presents opportunities.
Growth Accelerators in the Persulfates Industry Industry
Long-term growth in the persulfates industry will be significantly influenced by technological advancements in improving product efficiency and environmental compatibility. Strategic partnerships aimed at expanding market reach and developing innovative applications will play a crucial role. Expansion into emerging markets and diversification into new end-user industries will further drive growth.
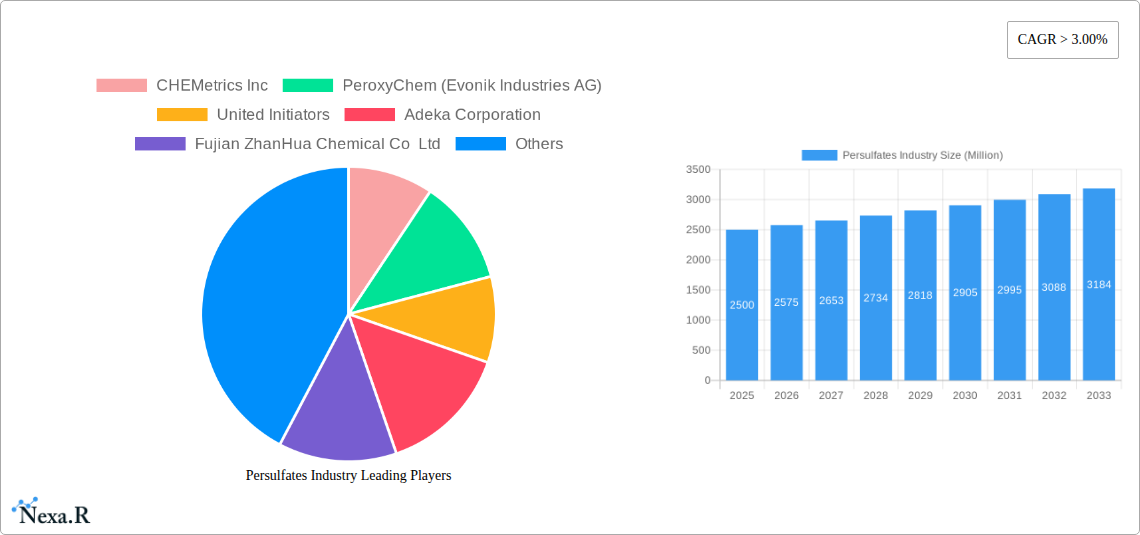
Key Players Shaping the Persulfates Industry Market
- CHEMetrics Inc
- PeroxyChem (Evonik Industries AG)
- United Initiators
- Adeka Corporation
- Fujian ZhanHua Chemical Co Ltd
- Akkim Kimya
- Shaanxi Baohua Technologies Co Ltd
- Shanghai Ansin Chemical Co Ltd
- LANXESS
- Stars Chemical (YongAn) Co Ltd
- Mitsubishi Gas Chemical Company Inc
- Yatai Electrochemistry Co Ltd
- Powder Pack Chem
- VR Persulfates Pvt Ltd
- ABC Chemicals (Shanghai) Co Ltd (List Not Exhaustive)
Notable Milestones in Persulfates Industry Sector
(This section requires specific data to populate with notable milestones and their dates.)
In-Depth Persulfates Industry Market Outlook
The future of the persulfates market is promising, driven by continued growth across diverse end-user sectors and technological innovations leading to enhanced product performance and sustainability. Strategic partnerships, market expansions, and the exploration of novel applications will contribute to long-term market expansion. The market is poised for sustained growth, presenting substantial opportunities for existing and new players.
Persulfates Industry Segmentation
-
1. Type
- 1.1. Sodium Persulfate
- 1.2. Potassium Persulfate
- 1.3. Ammonium Persulfate
-
2. Application
- 2.1. Polymer Initiator
- 2.2. Enhanced Oil Recovery
- 2.3. Oxidation, Bleaching, and Sizing Agent
- 2.4. Other Applications
-
3. End-user Industry
- 3.1. Polymer
- 3.2. Pulp, Paper, and Textile
- 3.3. Electronics
- 3.4. Cosmetics and Personal Care
- 3.5. Oil and Gas
- 3.6. Water Treatment
- 3.7. Soil Remediation
- 3.8. Other End-user Industries
Persulfates Industry Segmentation By Geography
-
1. Asia Pacific
- 1.1. China
- 1.2. India
- 1.3. Japan
- 1.4. South Korea
- 1.5. Rest of Asia Pacific
-
2. North America
- 2.1. United States
- 2.2. Canada
- 2.3. Mexico
-
3. Europe
- 3.1. Germany
- 3.2. United Kingdom
- 3.3. Italy
- 3.4. France
- 3.5. Rest of Europe
-
4. South America
- 4.1. Brazil
- 4.2. Argentina
- 4.3. Rest of South America
-
5. Middle East and Africa
- 5.1. Saudi Arabia
- 5.2. South Africa
- 5.3. Rest of Middle East and Africa
Persulfates Industry Regional Market Share
Geographic Coverage of Persulfates Industry
Persulfates Industry REPORT HIGHLIGHTS
| Aspects | Details |
|---|---|
| Study Period | 2020-2034 |
| Base Year | 2025 |
| Estimated Year | 2026 |
| Forecast Period | 2026-2034 |
| Historical Period | 2020-2025 |
| Growth Rate | CAGR of > 3.00% from 2020-2034 |
| Segmentation |
|
Table of Contents
- 1. Introduction
- 1.1. Research Scope
- 1.2. Market Segmentation
- 1.3. Research Objective
- 1.4. Definitions and Assumptions
- 2. Executive Summary
- 2.1. Market Snapshot
- 3. Market Dynamics
- 3.1. Market Drivers
- 3.2. Market Restrains
- 3.3. Market Trends
- 3.4. Market Opportunities
- 4. Market Factor Analysis
- 4.1. Porters Five Forces
- 4.1.1. Bargaining Power of Suppliers
- 4.1.2. Bargaining Power of Buyers
- 4.1.3. Threat of New Entrants
- 4.1.4. Threat of Substitutes
- 4.1.5. Competitive Rivalry
- 4.2. PESTEL analysis
- 4.3. BCG Analysis
- 4.3.1. Stars (High Growth, High Market Share)
- 4.3.2. Cash Cows (Low Growth, High Market Share)
- 4.3.3. Question Mark (High Growth, Low Market Share)
- 4.3.4. Dogs (Low Growth, Low Market Share)
- 4.4. Ansoff Matrix Analysis
- 4.5. Supply Chain Analysis
- 4.6. Regulatory Landscape
- 4.7. Current Market Potential and Opportunity Assessment (TAM–SAM–SOM Framework)
- 4.8. NRP Analyst Note
- 4.1. Porters Five Forces
- 5. Market Analysis, Insights and Forecast 2021-2033
- 5.1. Market Analysis, Insights and Forecast - by Type
- 5.1.1. Sodium Persulfate
- 5.1.2. Potassium Persulfate
- 5.1.3. Ammonium Persulfate
- 5.2. Market Analysis, Insights and Forecast - by Application
- 5.2.1. Polymer Initiator
- 5.2.2. Enhanced Oil Recovery
- 5.2.3. Oxidation, Bleaching, and Sizing Agent
- 5.2.4. Other Applications
- 5.3. Market Analysis, Insights and Forecast - by End-user Industry
- 5.3.1. Polymer
- 5.3.2. Pulp, Paper, and Textile
- 5.3.3. Electronics
- 5.3.4. Cosmetics and Personal Care
- 5.3.5. Oil and Gas
- 5.3.6. Water Treatment
- 5.3.7. Soil Remediation
- 5.3.8. Other End-user Industries
- 5.4. Market Analysis, Insights and Forecast - by Region
- 5.4.1. Asia Pacific
- 5.4.2. North America
- 5.4.3. Europe
- 5.4.4. South America
- 5.4.5. Middle East and Africa
- 5.1. Market Analysis, Insights and Forecast - by Type
- 6. Global Persulfates Industry Analysis, Insights and Forecast, 2021-2033
- 6.1. Market Analysis, Insights and Forecast - by Type
- 6.1.1. Sodium Persulfate
- 6.1.2. Potassium Persulfate
- 6.1.3. Ammonium Persulfate
- 6.2. Market Analysis, Insights and Forecast - by Application
- 6.2.1. Polymer Initiator
- 6.2.2. Enhanced Oil Recovery
- 6.2.3. Oxidation, Bleaching, and Sizing Agent
- 6.2.4. Other Applications
- 6.3. Market Analysis, Insights and Forecast - by End-user Industry
- 6.3.1. Polymer
- 6.3.2. Pulp, Paper, and Textile
- 6.3.3. Electronics
- 6.3.4. Cosmetics and Personal Care
- 6.3.5. Oil and Gas
- 6.3.6. Water Treatment
- 6.3.7. Soil Remediation
- 6.3.8. Other End-user Industries
- 6.1. Market Analysis, Insights and Forecast - by Type
- 7. Asia Pacific Persulfates Industry Analysis, Insights and Forecast, 2020-2032
- 7.1. Market Analysis, Insights and Forecast - by Type
- 7.1.1. Sodium Persulfate
- 7.1.2. Potassium Persulfate
- 7.1.3. Ammonium Persulfate
- 7.2. Market Analysis, Insights and Forecast - by Application
- 7.2.1. Polymer Initiator
- 7.2.2. Enhanced Oil Recovery
- 7.2.3. Oxidation, Bleaching, and Sizing Agent
- 7.2.4. Other Applications
- 7.3. Market Analysis, Insights and Forecast - by End-user Industry
- 7.3.1. Polymer
- 7.3.2. Pulp, Paper, and Textile
- 7.3.3. Electronics
- 7.3.4. Cosmetics and Personal Care
- 7.3.5. Oil and Gas
- 7.3.6. Water Treatment
- 7.3.7. Soil Remediation
- 7.3.8. Other End-user Industries
- 7.1. Market Analysis, Insights and Forecast - by Type
- 8. North America Persulfates Industry Analysis, Insights and Forecast, 2020-2032
- 8.1. Market Analysis, Insights and Forecast - by Type
- 8.1.1. Sodium Persulfate
- 8.1.2. Potassium Persulfate
- 8.1.3. Ammonium Persulfate
- 8.2. Market Analysis, Insights and Forecast - by Application
- 8.2.1. Polymer Initiator
- 8.2.2. Enhanced Oil Recovery
- 8.2.3. Oxidation, Bleaching, and Sizing Agent
- 8.2.4. Other Applications
- 8.3. Market Analysis, Insights and Forecast - by End-user Industry
- 8.3.1. Polymer
- 8.3.2. Pulp, Paper, and Textile
- 8.3.3. Electronics
- 8.3.4. Cosmetics and Personal Care
- 8.3.5. Oil and Gas
- 8.3.6. Water Treatment
- 8.3.7. Soil Remediation
- 8.3.8. Other End-user Industries
- 8.1. Market Analysis, Insights and Forecast - by Type
- 9. Europe Persulfates Industry Analysis, Insights and Forecast, 2020-2032
- 9.1. Market Analysis, Insights and Forecast - by Type
- 9.1.1. Sodium Persulfate
- 9.1.2. Potassium Persulfate
- 9.1.3. Ammonium Persulfate
- 9.2. Market Analysis, Insights and Forecast - by Application
- 9.2.1. Polymer Initiator
- 9.2.2. Enhanced Oil Recovery
- 9.2.3. Oxidation, Bleaching, and Sizing Agent
- 9.2.4. Other Applications
- 9.3. Market Analysis, Insights and Forecast - by End-user Industry
- 9.3.1. Polymer
- 9.3.2. Pulp, Paper, and Textile
- 9.3.3. Electronics
- 9.3.4. Cosmetics and Personal Care
- 9.3.5. Oil and Gas
- 9.3.6. Water Treatment
- 9.3.7. Soil Remediation
- 9.3.8. Other End-user Industries
- 9.1. Market Analysis, Insights and Forecast - by Type
- 10. South America Persulfates Industry Analysis, Insights and Forecast, 2020-2032
- 10.1. Market Analysis, Insights and Forecast - by Type
- 10.1.1. Sodium Persulfate
- 10.1.2. Potassium Persulfate
- 10.1.3. Ammonium Persulfate
- 10.2. Market Analysis, Insights and Forecast - by Application
- 10.2.1. Polymer Initiator
- 10.2.2. Enhanced Oil Recovery
- 10.2.3. Oxidation, Bleaching, and Sizing Agent
- 10.2.4. Other Applications
- 10.3. Market Analysis, Insights and Forecast - by End-user Industry
- 10.3.1. Polymer
- 10.3.2. Pulp, Paper, and Textile
- 10.3.3. Electronics
- 10.3.4. Cosmetics and Personal Care
- 10.3.5. Oil and Gas
- 10.3.6. Water Treatment
- 10.3.7. Soil Remediation
- 10.3.8. Other End-user Industries
- 10.1. Market Analysis, Insights and Forecast - by Type
- 11. Middle East and Africa Persulfates Industry Analysis, Insights and Forecast, 2020-2032
- 11.1. Market Analysis, Insights and Forecast - by Type
- 11.1.1. Sodium Persulfate
- 11.1.2. Potassium Persulfate
- 11.1.3. Ammonium Persulfate
- 11.2. Market Analysis, Insights and Forecast - by Application
- 11.2.1. Polymer Initiator
- 11.2.2. Enhanced Oil Recovery
- 11.2.3. Oxidation, Bleaching, and Sizing Agent
- 11.2.4. Other Applications
- 11.3. Market Analysis, Insights and Forecast - by End-user Industry
- 11.3.1. Polymer
- 11.3.2. Pulp, Paper, and Textile
- 11.3.3. Electronics
- 11.3.4. Cosmetics and Personal Care
- 11.3.5. Oil and Gas
- 11.3.6. Water Treatment
- 11.3.7. Soil Remediation
- 11.3.8. Other End-user Industries
- 11.1. Market Analysis, Insights and Forecast - by Type
- 12. Competitive Analysis
- 12.1. Company Profiles
- 12.1.1 CHEMetrics Inc
- 12.1.1.1. Company Overview
- 12.1.1.2. Products
- 12.1.1.3. Company Financials
- 12.1.1.4. SWOT Analysis
- 12.1.2 PeroxyChem (Evonik Industries AG)
- 12.1.2.1. Company Overview
- 12.1.2.2. Products
- 12.1.2.3. Company Financials
- 12.1.2.4. SWOT Analysis
- 12.1.3 United Initiators
- 12.1.3.1. Company Overview
- 12.1.3.2. Products
- 12.1.3.3. Company Financials
- 12.1.3.4. SWOT Analysis
- 12.1.4 Adeka Corporation
- 12.1.4.1. Company Overview
- 12.1.4.2. Products
- 12.1.4.3. Company Financials
- 12.1.4.4. SWOT Analysis
- 12.1.5 Fujian ZhanHua Chemical Co Ltd
- 12.1.5.1. Company Overview
- 12.1.5.2. Products
- 12.1.5.3. Company Financials
- 12.1.5.4. SWOT Analysis
- 12.1.6 Akkim Kimya
- 12.1.6.1. Company Overview
- 12.1.6.2. Products
- 12.1.6.3. Company Financials
- 12.1.6.4. SWOT Analysis
- 12.1.7 Shaanxi Baohua Technologies Co Ltd
- 12.1.7.1. Company Overview
- 12.1.7.2. Products
- 12.1.7.3. Company Financials
- 12.1.7.4. SWOT Analysis
- 12.1.8 Shanghai Ansin Chemical Co Ltd
- 12.1.8.1. Company Overview
- 12.1.8.2. Products
- 12.1.8.3. Company Financials
- 12.1.8.4. SWOT Analysis
- 12.1.9 LANXESS
- 12.1.9.1. Company Overview
- 12.1.9.2. Products
- 12.1.9.3. Company Financials
- 12.1.9.4. SWOT Analysis
- 12.1.10 Stars Chemical (YongAn) Co Ltd
- 12.1.10.1. Company Overview
- 12.1.10.2. Products
- 12.1.10.3. Company Financials
- 12.1.10.4. SWOT Analysis
- 12.1.11 Mitsubishi Gas Chemical Company Inc
- 12.1.11.1. Company Overview
- 12.1.11.2. Products
- 12.1.11.3. Company Financials
- 12.1.11.4. SWOT Analysis
- 12.1.12 Yatai Electrochemistry Co Ltd*List Not Exhaustive
- 12.1.12.1. Company Overview
- 12.1.12.2. Products
- 12.1.12.3. Company Financials
- 12.1.12.4. SWOT Analysis
- 12.1.13 Powder Pack Chem
- 12.1.13.1. Company Overview
- 12.1.13.2. Products
- 12.1.13.3. Company Financials
- 12.1.13.4. SWOT Analysis
- 12.1.14 VR Persulfates Pvt Ltd
- 12.1.14.1. Company Overview
- 12.1.14.2. Products
- 12.1.14.3. Company Financials
- 12.1.14.4. SWOT Analysis
- 12.1.15 ABC Chemicals (Shanghai) Co Ltd
- 12.1.15.1. Company Overview
- 12.1.15.2. Products
- 12.1.15.3. Company Financials
- 12.1.15.4. SWOT Analysis
- 12.1.1 CHEMetrics Inc
- 12.2. Market Entropy
- 12.2.1 Company's Key Areas Served
- 12.2.2 Recent Developments
- 12.3. Company Market Share Analysis 2025
- 12.3.1 Top 5 Companies Market Share Analysis
- 12.3.2 Top 3 Companies Market Share Analysis
- 12.4. List of Potential Customers
- 13. Research Methodology
List of Figures
- Figure 1: Global Persulfates Industry Revenue Breakdown (Million, %) by Region 2025 & 2033
- Figure 2: Asia Pacific Persulfates Industry Revenue (Million), by Type 2025 & 2033
- Figure 3: Asia Pacific Persulfates Industry Revenue Share (%), by Type 2025 & 2033
- Figure 4: Asia Pacific Persulfates Industry Revenue (Million), by Application 2025 & 2033
- Figure 5: Asia Pacific Persulfates Industry Revenue Share (%), by Application 2025 & 2033
- Figure 6: Asia Pacific Persulfates Industry Revenue (Million), by End-user Industry 2025 & 2033
- Figure 7: Asia Pacific Persulfates Industry Revenue Share (%), by End-user Industry 2025 & 2033
- Figure 8: Asia Pacific Persulfates Industry Revenue (Million), by Country 2025 & 2033
- Figure 9: Asia Pacific Persulfates Industry Revenue Share (%), by Country 2025 & 2033
- Figure 10: North America Persulfates Industry Revenue (Million), by Type 2025 & 2033
- Figure 11: North America Persulfates Industry Revenue Share (%), by Type 2025 & 2033
- Figure 12: North America Persulfates Industry Revenue (Million), by Application 2025 & 2033
- Figure 13: North America Persulfates Industry Revenue Share (%), by Application 2025 & 2033
- Figure 14: North America Persulfates Industry Revenue (Million), by End-user Industry 2025 & 2033
- Figure 15: North America Persulfates Industry Revenue Share (%), by End-user Industry 2025 & 2033
- Figure 16: North America Persulfates Industry Revenue (Million), by Country 2025 & 2033
- Figure 17: North America Persulfates Industry Revenue Share (%), by Country 2025 & 2033
- Figure 18: Europe Persulfates Industry Revenue (Million), by Type 2025 & 2033
- Figure 19: Europe Persulfates Industry Revenue Share (%), by Type 2025 & 2033
- Figure 20: Europe Persulfates Industry Revenue (Million), by Application 2025 & 2033
- Figure 21: Europe Persulfates Industry Revenue Share (%), by Application 2025 & 2033
- Figure 22: Europe Persulfates Industry Revenue (Million), by End-user Industry 2025 & 2033
- Figure 23: Europe Persulfates Industry Revenue Share (%), by End-user Industry 2025 & 2033
- Figure 24: Europe Persulfates Industry Revenue (Million), by Country 2025 & 2033
- Figure 25: Europe Persulfates Industry Revenue Share (%), by Country 2025 & 2033
- Figure 26: South America Persulfates Industry Revenue (Million), by Type 2025 & 2033
- Figure 27: South America Persulfates Industry Revenue Share (%), by Type 2025 & 2033
- Figure 28: South America Persulfates Industry Revenue (Million), by Application 2025 & 2033
- Figure 29: South America Persulfates Industry Revenue Share (%), by Application 2025 & 2033
- Figure 30: South America Persulfates Industry Revenue (Million), by End-user Industry 2025 & 2033
- Figure 31: South America Persulfates Industry Revenue Share (%), by End-user Industry 2025 & 2033
- Figure 32: South America Persulfates Industry Revenue (Million), by Country 2025 & 2033
- Figure 33: South America Persulfates Industry Revenue Share (%), by Country 2025 & 2033
- Figure 34: Middle East and Africa Persulfates Industry Revenue (Million), by Type 2025 & 2033
- Figure 35: Middle East and Africa Persulfates Industry Revenue Share (%), by Type 2025 & 2033
- Figure 36: Middle East and Africa Persulfates Industry Revenue (Million), by Application 2025 & 2033
- Figure 37: Middle East and Africa Persulfates Industry Revenue Share (%), by Application 2025 & 2033
- Figure 38: Middle East and Africa Persulfates Industry Revenue (Million), by End-user Industry 2025 & 2033
- Figure 39: Middle East and Africa Persulfates Industry Revenue Share (%), by End-user Industry 2025 & 2033
- Figure 40: Middle East and Africa Persulfates Industry Revenue (Million), by Country 2025 & 2033
- Figure 41: Middle East and Africa Persulfates Industry Revenue Share (%), by Country 2025 & 2033
List of Tables
- Table 1: Global Persulfates Industry Revenue Million Forecast, by Type 2020 & 2033
- Table 2: Global Persulfates Industry Revenue Million Forecast, by Application 2020 & 2033
- Table 3: Global Persulfates Industry Revenue Million Forecast, by End-user Industry 2020 & 2033
- Table 4: Global Persulfates Industry Revenue Million Forecast, by Region 2020 & 2033
- Table 5: Global Persulfates Industry Revenue Million Forecast, by Type 2020 & 2033
- Table 6: Global Persulfates Industry Revenue Million Forecast, by Application 2020 & 2033
- Table 7: Global Persulfates Industry Revenue Million Forecast, by End-user Industry 2020 & 2033
- Table 8: Global Persulfates Industry Revenue Million Forecast, by Country 2020 & 2033
- Table 9: China Persulfates Industry Revenue (Million) Forecast, by Application 2020 & 2033
- Table 10: India Persulfates Industry Revenue (Million) Forecast, by Application 2020 & 2033
- Table 11: Japan Persulfates Industry Revenue (Million) Forecast, by Application 2020 & 2033
- Table 12: South Korea Persulfates Industry Revenue (Million) Forecast, by Application 2020 & 2033
- Table 13: Rest of Asia Pacific Persulfates Industry Revenue (Million) Forecast, by Application 2020 & 2033
- Table 14: Global Persulfates Industry Revenue Million Forecast, by Type 2020 & 2033
- Table 15: Global Persulfates Industry Revenue Million Forecast, by Application 2020 & 2033
- Table 16: Global Persulfates Industry Revenue Million Forecast, by End-user Industry 2020 & 2033
- Table 17: Global Persulfates Industry Revenue Million Forecast, by Country 2020 & 2033
- Table 18: United States Persulfates Industry Revenue (Million) Forecast, by Application 2020 & 2033
- Table 19: Canada Persulfates Industry Revenue (Million) Forecast, by Application 2020 & 2033
- Table 20: Mexico Persulfates Industry Revenue (Million) Forecast, by Application 2020 & 2033
- Table 21: Global Persulfates Industry Revenue Million Forecast, by Type 2020 & 2033
- Table 22: Global Persulfates Industry Revenue Million Forecast, by Application 2020 & 2033
- Table 23: Global Persulfates Industry Revenue Million Forecast, by End-user Industry 2020 & 2033
- Table 24: Global Persulfates Industry Revenue Million Forecast, by Country 2020 & 2033
- Table 25: Germany Persulfates Industry Revenue (Million) Forecast, by Application 2020 & 2033
- Table 26: United Kingdom Persulfates Industry Revenue (Million) Forecast, by Application 2020 & 2033
- Table 27: Italy Persulfates Industry Revenue (Million) Forecast, by Application 2020 & 2033
- Table 28: France Persulfates Industry Revenue (Million) Forecast, by Application 2020 & 2033
- Table 29: Rest of Europe Persulfates Industry Revenue (Million) Forecast, by Application 2020 & 2033
- Table 30: Global Persulfates Industry Revenue Million Forecast, by Type 2020 & 2033
- Table 31: Global Persulfates Industry Revenue Million Forecast, by Application 2020 & 2033
- Table 32: Global Persulfates Industry Revenue Million Forecast, by End-user Industry 2020 & 2033
- Table 33: Global Persulfates Industry Revenue Million Forecast, by Country 2020 & 2033
- Table 34: Brazil Persulfates Industry Revenue (Million) Forecast, by Application 2020 & 2033
- Table 35: Argentina Persulfates Industry Revenue (Million) Forecast, by Application 2020 & 2033
- Table 36: Rest of South America Persulfates Industry Revenue (Million) Forecast, by Application 2020 & 2033
- Table 37: Global Persulfates Industry Revenue Million Forecast, by Type 2020 & 2033
- Table 38: Global Persulfates Industry Revenue Million Forecast, by Application 2020 & 2033
- Table 39: Global Persulfates Industry Revenue Million Forecast, by End-user Industry 2020 & 2033
- Table 40: Global Persulfates Industry Revenue Million Forecast, by Country 2020 & 2033
- Table 41: Saudi Arabia Persulfates Industry Revenue (Million) Forecast, by Application 2020 & 2033
- Table 42: South Africa Persulfates Industry Revenue (Million) Forecast, by Application 2020 & 2033
- Table 43: Rest of Middle East and Africa Persulfates Industry Revenue (Million) Forecast, by Application 2020 & 2033
Frequently Asked Questions
1. What is the projected Compound Annual Growth Rate (CAGR) of the Persulfates Industry?
The projected CAGR is approximately > 3.00%.
2. Which companies are prominent players in the Persulfates Industry?
Key companies in the market include CHEMetrics Inc, PeroxyChem (Evonik Industries AG), United Initiators, Adeka Corporation, Fujian ZhanHua Chemical Co Ltd, Akkim Kimya, Shaanxi Baohua Technologies Co Ltd, Shanghai Ansin Chemical Co Ltd, LANXESS, Stars Chemical (YongAn) Co Ltd, Mitsubishi Gas Chemical Company Inc, Yatai Electrochemistry Co Ltd*List Not Exhaustive, Powder Pack Chem, VR Persulfates Pvt Ltd, ABC Chemicals (Shanghai) Co Ltd.
3. What are the main segments of the Persulfates Industry?
The market segments include Type, Application, End-user Industry.
4. Can you provide details about the market size?
The market size is estimated to be USD XX Million as of 2022.
5. What are some drivers contributing to market growth?
Increasing Demand for Persulfates in the Electronics Industry; Growing Demand in the Paper. Pulp. and Textile Industry.
6. What are the notable trends driving market growth?
Increasing Demand from the Electronics Segment.
7. Are there any restraints impacting market growth?
Issues Related to Storage and Transportation of Persulfates; Negative Impact of the COVID-19 Pandemic.
8. Can you provide examples of recent developments in the market?
N/A
9. What pricing options are available for accessing the report?
Pricing options include single-user, multi-user, and enterprise licenses priced at USD 4750, USD 5250, and USD 8750 respectively.
10. Is the market size provided in terms of value or volume?
The market size is provided in terms of value, measured in Million.
11. Are there any specific market keywords associated with the report?
Yes, the market keyword associated with the report is "Persulfates Industry," which aids in identifying and referencing the specific market segment covered.
12. How do I determine which pricing option suits my needs best?
The pricing options vary based on user requirements and access needs. Individual users may opt for single-user licenses, while businesses requiring broader access may choose multi-user or enterprise licenses for cost-effective access to the report.
13. Are there any additional resources or data provided in the Persulfates Industry report?
While the report offers comprehensive insights, it's advisable to review the specific contents or supplementary materials provided to ascertain if additional resources or data are available.
14. How can I stay updated on further developments or reports in the Persulfates Industry?
To stay informed about further developments, trends, and reports in the Persulfates Industry, consider subscribing to industry newsletters, following relevant companies and organizations, or regularly checking reputable industry news sources and publications.
Methodology
Step 1 - Identification of Relevant Samples Size from Population Database


Step 2 - Approaches for Defining Global Market Size (Value, Volume* & Price*)

Note*: In applicable scenarios
Step 3 - Data Sources
Primary Research
- Web Analytics
- Survey Reports
- Research Institute
- Latest Research Reports
- Opinion Leaders
Secondary Research
- Annual Reports
- White Paper
- Latest Press Release
- Industry Association
- Paid Database
- Investor Presentations

Step 4 - Data Triangulation
Involves using different sources of information in order to increase the validity of a study
These sources are likely to be stakeholders in a program - participants, other researchers, program staff, other community members, and so on.
Then we put all data in single framework & apply various statistical tools to find out the dynamic on the market.
During the analysis stage, feedback from the stakeholder groups would be compared to determine areas of agreement as well as areas of divergence