

Key Insights
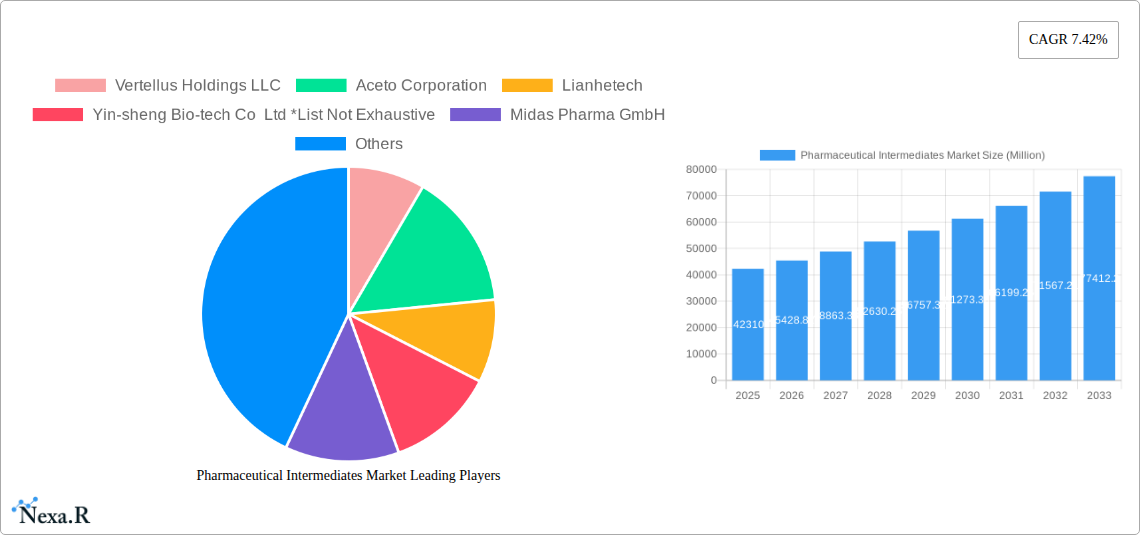
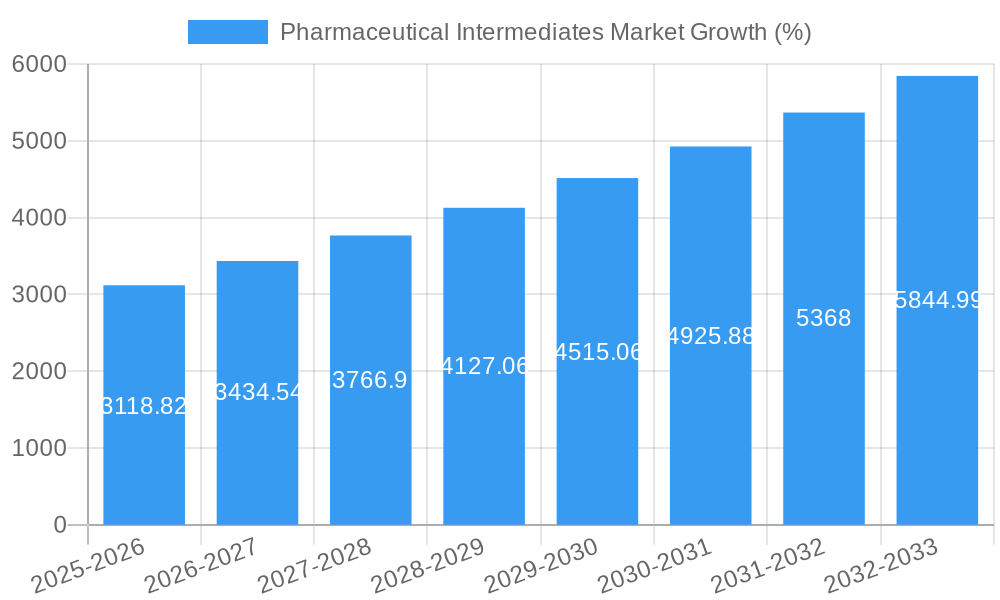
The Pharmaceutical Intermediates market is experiencing robust growth, projected to reach a market size of $42.31 billion in 2025, expanding at a Compound Annual Growth Rate (CAGR) of 7.42% from 2025 to 2033. This growth is fueled by several key drivers. The increasing prevalence of chronic diseases globally necessitates a higher demand for pharmaceuticals, directly impacting the need for high-quality intermediates. Furthermore, advancements in drug discovery and development, coupled with the rise of biosimilars and generic drugs, are stimulating market expansion. The market is segmented by type (Chemical Intermediate, Bulk Drug Intermediate, Others), application (Analgesics, Anti-infective Drugs, Cardiovascular Drugs, Oral Antidiabetic Drugs, Antimicrobial Drugs, Others), and end-user (Biotech and Pharma Companies, Research Institutions, Others). The strong presence of established players like Vertellus Holdings LLC, Aceto Corporation, and BASF SE, alongside emerging companies, indicates a competitive yet dynamic landscape. Regional variations exist, with North America and Europe holding significant market shares due to robust pharmaceutical industries and advanced research infrastructure. However, the Asia-Pacific region is predicted to showcase substantial growth, driven by expanding manufacturing capabilities and increasing healthcare expenditure in countries like China and India. The market also faces certain restraints, including stringent regulatory approvals and potential supply chain disruptions. Nevertheless, the overall outlook remains positive, indicating sustained growth and promising investment opportunities in the coming years.
The diverse applications of pharmaceutical intermediates across various drug classes ensure continued demand. The chemical intermediate segment likely holds the largest market share due to its widespread use in diverse drug manufacturing processes. Within applications, the anti-infective and cardiovascular drug segments are expected to demonstrate strong growth fueled by the rising prevalence of infectious diseases and cardiovascular conditions. The continuous innovation in drug development and the emergence of novel therapies further contribute to the market’s potential. Strategic partnerships and collaborations between pharmaceutical companies and intermediate suppliers are expected to become more prevalent, leading to optimized supply chains and improved efficiency. The ongoing focus on improving drug efficacy, safety, and affordability will continue to shape market trends.
Pharmaceutical Intermediates Market Report: 2019-2033
This comprehensive report provides a detailed analysis of the Pharmaceutical Intermediates Market, encompassing market dynamics, growth trends, regional analysis, competitive landscape, and future outlook. The study period covers 2019-2033, with 2025 as the base and estimated year. This report is crucial for pharmaceutical companies, investors, researchers, and industry professionals seeking to understand and capitalize on the opportunities within this dynamic market. The market is segmented by type (Chemical Intermediate, Bulk Drug Intermediate, Others), application (Analgesics, Anti-Infective Drugs, Cardiovascular Drugs, Oral Antidiabetic Drugs, Antimicrobial Drugs, Others), and end-user (Biotech and Pharma Companies, Research Institutions, Others).
Pharmaceutical Intermediates Market Dynamics & Structure
The Pharmaceutical Intermediates market is characterized by a moderately concentrated structure, with a few large players holding significant market share, alongside numerous smaller, specialized companies. The market size in 2025 is estimated at xx Million. Technological innovation, particularly in process chemistry and green chemistry, is a key driver, while stringent regulatory frameworks and evolving safety standards present ongoing challenges. The market witnesses continuous M&A activity, reflecting the consolidation trend within the industry.
- Market Concentration: The top 5 players account for approximately xx% of the global market share in 2025.
- Technological Innovation: Advancements in continuous manufacturing, flow chemistry, and AI-driven process optimization are boosting efficiency and reducing costs.
- Regulatory Landscape: Stringent regulations related to GMP (Good Manufacturing Practices) and environmental compliance impact operational costs and necessitate ongoing compliance efforts.
- Competitive Substitutes: The emergence of biosimilars and alternative therapies poses a potential challenge to the demand for certain pharmaceutical intermediates.
- M&A Activity: An estimated xx M&A deals were observed in the period 2019-2024, indicating a trend of consolidation and expansion within the sector.
- Innovation Barriers: High R&D costs, complex regulatory pathways, and the need for specialized expertise hinder innovation to some extent.
Pharmaceutical Intermediates Market Growth Trends & Insights
The Pharmaceutical Intermediates market has witnessed robust growth over the historical period (2019-2024), driven by factors such as the increasing prevalence of chronic diseases, rising R&D expenditure in the pharmaceutical industry, and the growing demand for generic drugs. The market is projected to maintain a healthy CAGR of xx% during the forecast period (2025-2033), reaching an estimated value of xx Million by 2033. Technological disruptions, such as the adoption of advanced analytical techniques and automation, are further accelerating growth. Shifting consumer preferences towards personalized medicine and targeted therapies are also shaping market dynamics. Market penetration for novel intermediates is increasing at a rate of xx% annually.
Dominant Regions, Countries, or Segments in Pharmaceutical Intermediates Market
The Asia-Pacific region, particularly China and India, dominates the Pharmaceutical Intermediates market, driven by a large and expanding pharmaceutical manufacturing base, favorable government policies, and a growing population. North America and Europe also hold significant market shares, albeit with slower growth rates compared to the Asia-Pacific region. Within the segments, the Chemical Intermediate segment holds the largest market share due to its widespread use across various drug classes. The Analgesics and Anti-Infective drugs application segments are the largest end-use markets.
- Asia-Pacific: Strong growth driven by increasing domestic pharmaceutical production, cost advantages, and government support for the industry.
- North America: Large market size driven by high R&D spending and established pharmaceutical companies.
- Europe: Mature market with focus on innovation and stringent regulatory compliance.
- Chemical Intermediates Segment: Largest market share due to wide application across various drugs.
- Analgesics & Anti-Infective Drugs: High demand due to the prevalence of related ailments.
Pharmaceutical Intermediates Market Product Landscape
The pharmaceutical intermediates market showcases a diverse range of products, tailored to the specific requirements of various drug molecules. Innovation focuses on improving yield, purity, and reducing environmental impact through green chemistry approaches. Continuous flow synthesis and other advanced manufacturing techniques enhance efficiency and scalability. Unique selling propositions often involve superior purity, reduced manufacturing time, and customized solutions for clients.
Key Drivers, Barriers & Challenges in Pharmaceutical Intermediates Market
Key Drivers: The rising prevalence of chronic diseases globally fuels demand for pharmaceutical products and consequently, the intermediates required for their production. Government initiatives supporting pharmaceutical manufacturing and R&D investments further accelerate market growth. Technological advancements, such as automation and AI-driven process optimization, improve efficiency and reduce production costs.
Key Challenges: Stringent regulatory approvals, increasing raw material costs, and potential supply chain disruptions present challenges to consistent market growth. Intense competition from generic drug manufacturers and the emergence of biosimilars also place pressure on market margins. The environmental impact of chemical processes is also a growing concern.
Emerging Opportunities in Pharmaceutical Intermediates Market
Emerging opportunities include the increasing adoption of biopharmaceuticals, the development of novel drug delivery systems, and the rising demand for personalized medicine. Untapped markets in developing economies and the expansion into new therapeutic areas present significant growth potential. The use of sustainable and green chemistry approaches is gaining traction, offering a compelling value proposition for environmentally conscious manufacturers.
Growth Accelerators in the Pharmaceutical Intermediates Market Industry
Strategic partnerships between pharmaceutical companies and contract manufacturers are fostering growth. Investments in advanced manufacturing technologies and automation are enhancing operational efficiency. Expansion into emerging markets and the development of innovative intermediates for next-generation drugs are key drivers of future growth. The growing adoption of continuous manufacturing methods promises significant cost savings and production efficiency increases.
Key Players Shaping the Pharmaceutical Intermediates Market Market
- Vertellus Holdings LLC
- Aceto Corporation
- Lianhetech
- Yin-sheng Bio-tech Co Ltd
- Midas Pharma GmbH
- Sanofi SAIS
- BASF SE
- Dishman Group
- A R Life Science
- Chiracon GmbH
- Green Vision Life Sciences
- Codexis Inc
Notable Milestones in Pharmaceutical Intermediates Market Sector
- March 2022: Sumitomo Chemical Co., Ltd. announces a new manufacturing plant for APIs and intermediates in Japan, boosting capacity in response to increasing demand.
- October 2022: AstraZeneca's Imjudo (tremelimumab) + Imfinzi (durvalumab) approved in the US for unresectable hepatocellular carcinoma, driving demand for associated intermediates.
- February 2022: CordenPharma acquires three manufacturing facilities from Vifor Pharma, expanding its production capacity.
In-Depth Pharmaceutical Intermediates Market Market Outlook
The future of the Pharmaceutical Intermediates market is bright, driven by sustained demand for pharmaceutical products, technological advancements, and strategic investments. The market is poised for significant growth, with numerous opportunities for companies that can adapt to evolving market dynamics and invest in innovation. Strategic partnerships, focused R&D, and the adoption of sustainable practices will be crucial for success in this competitive landscape.
Pharmaceutical Intermediates Market Segmentation
-
1. Type
- 1.1. Chemical Intermediate
- 1.2. Bulk Drug Intermediate
- 1.3. Others
-
2. Application
- 2.1. Analgesics
- 2.2. Anti-Infective Drugs
- 2.3. Cardiovascular Drugs
- 2.4. Oral Antidiabetic Drugs
- 2.5. Antimicrobial Drugs
- 2.6. Others
-
3. End-User
- 3.1. Biotech and Pharma Companies
- 3.2. Research Institutions
- 3.3. Others
Pharmaceutical Intermediates Market Segmentation By Geography
-
1. North America
- 1.1. United States
- 1.2. Canada
- 1.3. Mexico
-
2. Europe
- 2.1. Germany
- 2.2. United Kingdom
- 2.3. France
- 2.4. Italy
- 2.5. Spain
- 2.6. Rest of Europe
-
3. Asia Pacific
- 3.1. China
- 3.2. Japan
- 3.3. India
- 3.4. Australia
- 3.5. South Korea
- 3.6. Rest of Asia Pacific
-
4. Middle East and Africa
- 4.1. GCC
- 4.2. South Africa
- 4.3. Rest of Middle East and Africa
-
5. South America
- 5.1. Brazil
- 5.2. Argentina
- 5.3. Rest of South America

Pharmaceutical Intermediates Market REPORT HIGHLIGHTS
| Aspects | Details |
|---|---|
| Study Period | 2019-2033 |
| Base Year | 2024 |
| Estimated Year | 2025 |
| Forecast Period | 2025-2033 |
| Historical Period | 2019-2024 |
| Growth Rate | CAGR of 7.42% from 2019-2033 |
| Segmentation |
|
Table of Contents
- 1. Introduction
- 1.1. Research Scope
- 1.2. Market Segmentation
- 1.3. Research Methodology
- 1.4. Definitions and Assumptions
- 2. Executive Summary
- 2.1. Introduction
- 3. Market Dynamics
- 3.1. Introduction
- 3.2. Market Drivers
- 3.2.1. Increasing Prevalence of Chronic Diseases; Growing R&D Initiatives and Activities in the Pharmaceutical Industry
- 3.3. Market Restrains
- 3.3.1. Stringent Regulatory Issues Regarding Certain Pharmaceutical Intermediate Substances
- 3.4. Market Trends
- 3.4.1. Cardiovascular Drugs Hold Significant Share in the Global Pharmaceutical Intermediates Market
- 4. Market Factor Analysis
- 4.1. Porters Five Forces
- 4.2. Supply/Value Chain
- 4.3. PESTEL analysis
- 4.4. Market Entropy
- 4.5. Patent/Trademark Analysis
- 5. Global Pharmaceutical Intermediates Market Analysis, Insights and Forecast, 2019-2031
- 5.1. Market Analysis, Insights and Forecast - by Type
- 5.1.1. Chemical Intermediate
- 5.1.2. Bulk Drug Intermediate
- 5.1.3. Others
- 5.2. Market Analysis, Insights and Forecast - by Application
- 5.2.1. Analgesics
- 5.2.2. Anti-Infective Drugs
- 5.2.3. Cardiovascular Drugs
- 5.2.4. Oral Antidiabetic Drugs
- 5.2.5. Antimicrobial Drugs
- 5.2.6. Others
- 5.3. Market Analysis, Insights and Forecast - by End-User
- 5.3.1. Biotech and Pharma Companies
- 5.3.2. Research Institutions
- 5.3.3. Others
- 5.4. Market Analysis, Insights and Forecast - by Region
- 5.4.1. North America
- 5.4.2. Europe
- 5.4.3. Asia Pacific
- 5.4.4. Middle East and Africa
- 5.4.5. South America
- 5.1. Market Analysis, Insights and Forecast - by Type
- 6. North America Pharmaceutical Intermediates Market Analysis, Insights and Forecast, 2019-2031
- 6.1. Market Analysis, Insights and Forecast - by Type
- 6.1.1. Chemical Intermediate
- 6.1.2. Bulk Drug Intermediate
- 6.1.3. Others
- 6.2. Market Analysis, Insights and Forecast - by Application
- 6.2.1. Analgesics
- 6.2.2. Anti-Infective Drugs
- 6.2.3. Cardiovascular Drugs
- 6.2.4. Oral Antidiabetic Drugs
- 6.2.5. Antimicrobial Drugs
- 6.2.6. Others
- 6.3. Market Analysis, Insights and Forecast - by End-User
- 6.3.1. Biotech and Pharma Companies
- 6.3.2. Research Institutions
- 6.3.3. Others
- 6.1. Market Analysis, Insights and Forecast - by Type
- 7. Europe Pharmaceutical Intermediates Market Analysis, Insights and Forecast, 2019-2031
- 7.1. Market Analysis, Insights and Forecast - by Type
- 7.1.1. Chemical Intermediate
- 7.1.2. Bulk Drug Intermediate
- 7.1.3. Others
- 7.2. Market Analysis, Insights and Forecast - by Application
- 7.2.1. Analgesics
- 7.2.2. Anti-Infective Drugs
- 7.2.3. Cardiovascular Drugs
- 7.2.4. Oral Antidiabetic Drugs
- 7.2.5. Antimicrobial Drugs
- 7.2.6. Others
- 7.3. Market Analysis, Insights and Forecast - by End-User
- 7.3.1. Biotech and Pharma Companies
- 7.3.2. Research Institutions
- 7.3.3. Others
- 7.1. Market Analysis, Insights and Forecast - by Type
- 8. Asia Pacific Pharmaceutical Intermediates Market Analysis, Insights and Forecast, 2019-2031
- 8.1. Market Analysis, Insights and Forecast - by Type
- 8.1.1. Chemical Intermediate
- 8.1.2. Bulk Drug Intermediate
- 8.1.3. Others
- 8.2. Market Analysis, Insights and Forecast - by Application
- 8.2.1. Analgesics
- 8.2.2. Anti-Infective Drugs
- 8.2.3. Cardiovascular Drugs
- 8.2.4. Oral Antidiabetic Drugs
- 8.2.5. Antimicrobial Drugs
- 8.2.6. Others
- 8.3. Market Analysis, Insights and Forecast - by End-User
- 8.3.1. Biotech and Pharma Companies
- 8.3.2. Research Institutions
- 8.3.3. Others
- 8.1. Market Analysis, Insights and Forecast - by Type
- 9. Middle East and Africa Pharmaceutical Intermediates Market Analysis, Insights and Forecast, 2019-2031
- 9.1. Market Analysis, Insights and Forecast - by Type
- 9.1.1. Chemical Intermediate
- 9.1.2. Bulk Drug Intermediate
- 9.1.3. Others
- 9.2. Market Analysis, Insights and Forecast - by Application
- 9.2.1. Analgesics
- 9.2.2. Anti-Infective Drugs
- 9.2.3. Cardiovascular Drugs
- 9.2.4. Oral Antidiabetic Drugs
- 9.2.5. Antimicrobial Drugs
- 9.2.6. Others
- 9.3. Market Analysis, Insights and Forecast - by End-User
- 9.3.1. Biotech and Pharma Companies
- 9.3.2. Research Institutions
- 9.3.3. Others
- 9.1. Market Analysis, Insights and Forecast - by Type
- 10. South America Pharmaceutical Intermediates Market Analysis, Insights and Forecast, 2019-2031
- 10.1. Market Analysis, Insights and Forecast - by Type
- 10.1.1. Chemical Intermediate
- 10.1.2. Bulk Drug Intermediate
- 10.1.3. Others
- 10.2. Market Analysis, Insights and Forecast - by Application
- 10.2.1. Analgesics
- 10.2.2. Anti-Infective Drugs
- 10.2.3. Cardiovascular Drugs
- 10.2.4. Oral Antidiabetic Drugs
- 10.2.5. Antimicrobial Drugs
- 10.2.6. Others
- 10.3. Market Analysis, Insights and Forecast - by End-User
- 10.3.1. Biotech and Pharma Companies
- 10.3.2. Research Institutions
- 10.3.3. Others
- 10.1. Market Analysis, Insights and Forecast - by Type
- 11. North Americ Pharmaceutical Intermediates Market Analysis, Insights and Forecast, 2019-2031
- 11.1. Market Analysis, Insights and Forecast - By Country/Sub-region
- 11.1.1 United States
- 11.1.2 Canada
- 11.1.3 Mexico
- 12. South America Pharmaceutical Intermediates Market Analysis, Insights and Forecast, 2019-2031
- 12.1. Market Analysis, Insights and Forecast - By Country/Sub-region
- 12.1.1 Brazil
- 12.1.2 Mexico
- 12.1.3 Rest of South America
- 13. Europe Pharmaceutical Intermediates Market Analysis, Insights and Forecast, 2019-2031
- 13.1. Market Analysis, Insights and Forecast - By Country/Sub-region
- 13.1.1 Germany
- 13.1.2 United Kingdom
- 13.1.3 France
- 13.1.4 Italy
- 13.1.5 Spain
- 13.1.6 Rest of Europe
- 14. Asia Pacific Pharmaceutical Intermediates Market Analysis, Insights and Forecast, 2019-2031
- 14.1. Market Analysis, Insights and Forecast - By Country/Sub-region
- 14.1.1 China
- 14.1.2 Japan
- 14.1.3 India
- 14.1.4 South Korea
- 14.1.5 Taiwan
- 14.1.6 Australia
- 14.1.7 Rest of Asia-Pacific
- 15. MEA Pharmaceutical Intermediates Market Analysis, Insights and Forecast, 2019-2031
- 15.1. Market Analysis, Insights and Forecast - By Country/Sub-region
- 15.1.1 Middle East
- 15.1.2 Africa
- 16. Competitive Analysis
- 16.1. Global Market Share Analysis 2024
- 16.2. Company Profiles
- 16.2.1 Vertellus Holdings LLC
- 16.2.1.1. Overview
- 16.2.1.2. Products
- 16.2.1.3. SWOT Analysis
- 16.2.1.4. Recent Developments
- 16.2.1.5. Financials (Based on Availability)
- 16.2.2 Aceto Corporation
- 16.2.2.1. Overview
- 16.2.2.2. Products
- 16.2.2.3. SWOT Analysis
- 16.2.2.4. Recent Developments
- 16.2.2.5. Financials (Based on Availability)
- 16.2.3 Lianhetech
- 16.2.3.1. Overview
- 16.2.3.2. Products
- 16.2.3.3. SWOT Analysis
- 16.2.3.4. Recent Developments
- 16.2.3.5. Financials (Based on Availability)
- 16.2.4 Yin-sheng Bio-tech Co Ltd *List Not Exhaustive
- 16.2.4.1. Overview
- 16.2.4.2. Products
- 16.2.4.3. SWOT Analysis
- 16.2.4.4. Recent Developments
- 16.2.4.5. Financials (Based on Availability)
- 16.2.5 Midas Pharma GmbH
- 16.2.5.1. Overview
- 16.2.5.2. Products
- 16.2.5.3. SWOT Analysis
- 16.2.5.4. Recent Developments
- 16.2.5.5. Financials (Based on Availability)
- 16.2.6 Sanofi SAIS
- 16.2.6.1. Overview
- 16.2.6.2. Products
- 16.2.6.3. SWOT Analysis
- 16.2.6.4. Recent Developments
- 16.2.6.5. Financials (Based on Availability)
- 16.2.7 BASF SE
- 16.2.7.1. Overview
- 16.2.7.2. Products
- 16.2.7.3. SWOT Analysis
- 16.2.7.4. Recent Developments
- 16.2.7.5. Financials (Based on Availability)
- 16.2.8 Dishman Group
- 16.2.8.1. Overview
- 16.2.8.2. Products
- 16.2.8.3. SWOT Analysis
- 16.2.8.4. Recent Developments
- 16.2.8.5. Financials (Based on Availability)
- 16.2.9 A R Life Science
- 16.2.9.1. Overview
- 16.2.9.2. Products
- 16.2.9.3. SWOT Analysis
- 16.2.9.4. Recent Developments
- 16.2.9.5. Financials (Based on Availability)
- 16.2.10 Chiracon GmbH
- 16.2.10.1. Overview
- 16.2.10.2. Products
- 16.2.10.3. SWOT Analysis
- 16.2.10.4. Recent Developments
- 16.2.10.5. Financials (Based on Availability)
- 16.2.11 Green Vision Life Sciences
- 16.2.11.1. Overview
- 16.2.11.2. Products
- 16.2.11.3. SWOT Analysis
- 16.2.11.4. Recent Developments
- 16.2.11.5. Financials (Based on Availability)
- 16.2.12 Codexis Inc
- 16.2.12.1. Overview
- 16.2.12.2. Products
- 16.2.12.3. SWOT Analysis
- 16.2.12.4. Recent Developments
- 16.2.12.5. Financials (Based on Availability)
- 16.2.1 Vertellus Holdings LLC
List of Figures
- Figure 1: Global Pharmaceutical Intermediates Market Revenue Breakdown (Million, %) by Region 2024 & 2032
- Figure 2: North Americ Pharmaceutical Intermediates Market Revenue (Million), by Country 2024 & 2032
- Figure 3: North Americ Pharmaceutical Intermediates Market Revenue Share (%), by Country 2024 & 2032
- Figure 4: South America Pharmaceutical Intermediates Market Revenue (Million), by Country 2024 & 2032
- Figure 5: South America Pharmaceutical Intermediates Market Revenue Share (%), by Country 2024 & 2032
- Figure 6: Europe Pharmaceutical Intermediates Market Revenue (Million), by Country 2024 & 2032
- Figure 7: Europe Pharmaceutical Intermediates Market Revenue Share (%), by Country 2024 & 2032
- Figure 8: Asia Pacific Pharmaceutical Intermediates Market Revenue (Million), by Country 2024 & 2032
- Figure 9: Asia Pacific Pharmaceutical Intermediates Market Revenue Share (%), by Country 2024 & 2032
- Figure 10: MEA Pharmaceutical Intermediates Market Revenue (Million), by Country 2024 & 2032
- Figure 11: MEA Pharmaceutical Intermediates Market Revenue Share (%), by Country 2024 & 2032
- Figure 12: North America Pharmaceutical Intermediates Market Revenue (Million), by Type 2024 & 2032
- Figure 13: North America Pharmaceutical Intermediates Market Revenue Share (%), by Type 2024 & 2032
- Figure 14: North America Pharmaceutical Intermediates Market Revenue (Million), by Application 2024 & 2032
- Figure 15: North America Pharmaceutical Intermediates Market Revenue Share (%), by Application 2024 & 2032
- Figure 16: North America Pharmaceutical Intermediates Market Revenue (Million), by End-User 2024 & 2032
- Figure 17: North America Pharmaceutical Intermediates Market Revenue Share (%), by End-User 2024 & 2032
- Figure 18: North America Pharmaceutical Intermediates Market Revenue (Million), by Country 2024 & 2032
- Figure 19: North America Pharmaceutical Intermediates Market Revenue Share (%), by Country 2024 & 2032
- Figure 20: Europe Pharmaceutical Intermediates Market Revenue (Million), by Type 2024 & 2032
- Figure 21: Europe Pharmaceutical Intermediates Market Revenue Share (%), by Type 2024 & 2032
- Figure 22: Europe Pharmaceutical Intermediates Market Revenue (Million), by Application 2024 & 2032
- Figure 23: Europe Pharmaceutical Intermediates Market Revenue Share (%), by Application 2024 & 2032
- Figure 24: Europe Pharmaceutical Intermediates Market Revenue (Million), by End-User 2024 & 2032
- Figure 25: Europe Pharmaceutical Intermediates Market Revenue Share (%), by End-User 2024 & 2032
- Figure 26: Europe Pharmaceutical Intermediates Market Revenue (Million), by Country 2024 & 2032
- Figure 27: Europe Pharmaceutical Intermediates Market Revenue Share (%), by Country 2024 & 2032
- Figure 28: Asia Pacific Pharmaceutical Intermediates Market Revenue (Million), by Type 2024 & 2032
- Figure 29: Asia Pacific Pharmaceutical Intermediates Market Revenue Share (%), by Type 2024 & 2032
- Figure 30: Asia Pacific Pharmaceutical Intermediates Market Revenue (Million), by Application 2024 & 2032
- Figure 31: Asia Pacific Pharmaceutical Intermediates Market Revenue Share (%), by Application 2024 & 2032
- Figure 32: Asia Pacific Pharmaceutical Intermediates Market Revenue (Million), by End-User 2024 & 2032
- Figure 33: Asia Pacific Pharmaceutical Intermediates Market Revenue Share (%), by End-User 2024 & 2032
- Figure 34: Asia Pacific Pharmaceutical Intermediates Market Revenue (Million), by Country 2024 & 2032
- Figure 35: Asia Pacific Pharmaceutical Intermediates Market Revenue Share (%), by Country 2024 & 2032
- Figure 36: Middle East and Africa Pharmaceutical Intermediates Market Revenue (Million), by Type 2024 & 2032
- Figure 37: Middle East and Africa Pharmaceutical Intermediates Market Revenue Share (%), by Type 2024 & 2032
- Figure 38: Middle East and Africa Pharmaceutical Intermediates Market Revenue (Million), by Application 2024 & 2032
- Figure 39: Middle East and Africa Pharmaceutical Intermediates Market Revenue Share (%), by Application 2024 & 2032
- Figure 40: Middle East and Africa Pharmaceutical Intermediates Market Revenue (Million), by End-User 2024 & 2032
- Figure 41: Middle East and Africa Pharmaceutical Intermediates Market Revenue Share (%), by End-User 2024 & 2032
- Figure 42: Middle East and Africa Pharmaceutical Intermediates Market Revenue (Million), by Country 2024 & 2032
- Figure 43: Middle East and Africa Pharmaceutical Intermediates Market Revenue Share (%), by Country 2024 & 2032
- Figure 44: South America Pharmaceutical Intermediates Market Revenue (Million), by Type 2024 & 2032
- Figure 45: South America Pharmaceutical Intermediates Market Revenue Share (%), by Type 2024 & 2032
- Figure 46: South America Pharmaceutical Intermediates Market Revenue (Million), by Application 2024 & 2032
- Figure 47: South America Pharmaceutical Intermediates Market Revenue Share (%), by Application 2024 & 2032
- Figure 48: South America Pharmaceutical Intermediates Market Revenue (Million), by End-User 2024 & 2032
- Figure 49: South America Pharmaceutical Intermediates Market Revenue Share (%), by End-User 2024 & 2032
- Figure 50: South America Pharmaceutical Intermediates Market Revenue (Million), by Country 2024 & 2032
- Figure 51: South America Pharmaceutical Intermediates Market Revenue Share (%), by Country 2024 & 2032
List of Tables
- Table 1: Global Pharmaceutical Intermediates Market Revenue Million Forecast, by Region 2019 & 2032
- Table 2: Global Pharmaceutical Intermediates Market Revenue Million Forecast, by Type 2019 & 2032
- Table 3: Global Pharmaceutical Intermediates Market Revenue Million Forecast, by Application 2019 & 2032
- Table 4: Global Pharmaceutical Intermediates Market Revenue Million Forecast, by End-User 2019 & 2032
- Table 5: Global Pharmaceutical Intermediates Market Revenue Million Forecast, by Region 2019 & 2032
- Table 6: Global Pharmaceutical Intermediates Market Revenue Million Forecast, by Country 2019 & 2032
- Table 7: United States Pharmaceutical Intermediates Market Revenue (Million) Forecast, by Application 2019 & 2032
- Table 8: Canada Pharmaceutical Intermediates Market Revenue (Million) Forecast, by Application 2019 & 2032
- Table 9: Mexico Pharmaceutical Intermediates Market Revenue (Million) Forecast, by Application 2019 & 2032
- Table 10: Global Pharmaceutical Intermediates Market Revenue Million Forecast, by Country 2019 & 2032
- Table 11: Brazil Pharmaceutical Intermediates Market Revenue (Million) Forecast, by Application 2019 & 2032
- Table 12: Mexico Pharmaceutical Intermediates Market Revenue (Million) Forecast, by Application 2019 & 2032
- Table 13: Rest of South America Pharmaceutical Intermediates Market Revenue (Million) Forecast, by Application 2019 & 2032
- Table 14: Global Pharmaceutical Intermediates Market Revenue Million Forecast, by Country 2019 & 2032
- Table 15: Germany Pharmaceutical Intermediates Market Revenue (Million) Forecast, by Application 2019 & 2032
- Table 16: United Kingdom Pharmaceutical Intermediates Market Revenue (Million) Forecast, by Application 2019 & 2032
- Table 17: France Pharmaceutical Intermediates Market Revenue (Million) Forecast, by Application 2019 & 2032
- Table 18: Italy Pharmaceutical Intermediates Market Revenue (Million) Forecast, by Application 2019 & 2032
- Table 19: Spain Pharmaceutical Intermediates Market Revenue (Million) Forecast, by Application 2019 & 2032
- Table 20: Rest of Europe Pharmaceutical Intermediates Market Revenue (Million) Forecast, by Application 2019 & 2032
- Table 21: Global Pharmaceutical Intermediates Market Revenue Million Forecast, by Country 2019 & 2032
- Table 22: China Pharmaceutical Intermediates Market Revenue (Million) Forecast, by Application 2019 & 2032
- Table 23: Japan Pharmaceutical Intermediates Market Revenue (Million) Forecast, by Application 2019 & 2032
- Table 24: India Pharmaceutical Intermediates Market Revenue (Million) Forecast, by Application 2019 & 2032
- Table 25: South Korea Pharmaceutical Intermediates Market Revenue (Million) Forecast, by Application 2019 & 2032
- Table 26: Taiwan Pharmaceutical Intermediates Market Revenue (Million) Forecast, by Application 2019 & 2032
- Table 27: Australia Pharmaceutical Intermediates Market Revenue (Million) Forecast, by Application 2019 & 2032
- Table 28: Rest of Asia-Pacific Pharmaceutical Intermediates Market Revenue (Million) Forecast, by Application 2019 & 2032
- Table 29: Global Pharmaceutical Intermediates Market Revenue Million Forecast, by Country 2019 & 2032
- Table 30: Middle East Pharmaceutical Intermediates Market Revenue (Million) Forecast, by Application 2019 & 2032
- Table 31: Africa Pharmaceutical Intermediates Market Revenue (Million) Forecast, by Application 2019 & 2032
- Table 32: Global Pharmaceutical Intermediates Market Revenue Million Forecast, by Type 2019 & 2032
- Table 33: Global Pharmaceutical Intermediates Market Revenue Million Forecast, by Application 2019 & 2032
- Table 34: Global Pharmaceutical Intermediates Market Revenue Million Forecast, by End-User 2019 & 2032
- Table 35: Global Pharmaceutical Intermediates Market Revenue Million Forecast, by Country 2019 & 2032
- Table 36: United States Pharmaceutical Intermediates Market Revenue (Million) Forecast, by Application 2019 & 2032
- Table 37: Canada Pharmaceutical Intermediates Market Revenue (Million) Forecast, by Application 2019 & 2032
- Table 38: Mexico Pharmaceutical Intermediates Market Revenue (Million) Forecast, by Application 2019 & 2032
- Table 39: Global Pharmaceutical Intermediates Market Revenue Million Forecast, by Type 2019 & 2032
- Table 40: Global Pharmaceutical Intermediates Market Revenue Million Forecast, by Application 2019 & 2032
- Table 41: Global Pharmaceutical Intermediates Market Revenue Million Forecast, by End-User 2019 & 2032
- Table 42: Global Pharmaceutical Intermediates Market Revenue Million Forecast, by Country 2019 & 2032
- Table 43: Germany Pharmaceutical Intermediates Market Revenue (Million) Forecast, by Application 2019 & 2032
- Table 44: United Kingdom Pharmaceutical Intermediates Market Revenue (Million) Forecast, by Application 2019 & 2032
- Table 45: France Pharmaceutical Intermediates Market Revenue (Million) Forecast, by Application 2019 & 2032
- Table 46: Italy Pharmaceutical Intermediates Market Revenue (Million) Forecast, by Application 2019 & 2032
- Table 47: Spain Pharmaceutical Intermediates Market Revenue (Million) Forecast, by Application 2019 & 2032
- Table 48: Rest of Europe Pharmaceutical Intermediates Market Revenue (Million) Forecast, by Application 2019 & 2032
- Table 49: Global Pharmaceutical Intermediates Market Revenue Million Forecast, by Type 2019 & 2032
- Table 50: Global Pharmaceutical Intermediates Market Revenue Million Forecast, by Application 2019 & 2032
- Table 51: Global Pharmaceutical Intermediates Market Revenue Million Forecast, by End-User 2019 & 2032
- Table 52: Global Pharmaceutical Intermediates Market Revenue Million Forecast, by Country 2019 & 2032
- Table 53: China Pharmaceutical Intermediates Market Revenue (Million) Forecast, by Application 2019 & 2032
- Table 54: Japan Pharmaceutical Intermediates Market Revenue (Million) Forecast, by Application 2019 & 2032
- Table 55: India Pharmaceutical Intermediates Market Revenue (Million) Forecast, by Application 2019 & 2032
- Table 56: Australia Pharmaceutical Intermediates Market Revenue (Million) Forecast, by Application 2019 & 2032
- Table 57: South Korea Pharmaceutical Intermediates Market Revenue (Million) Forecast, by Application 2019 & 2032
- Table 58: Rest of Asia Pacific Pharmaceutical Intermediates Market Revenue (Million) Forecast, by Application 2019 & 2032
- Table 59: Global Pharmaceutical Intermediates Market Revenue Million Forecast, by Type 2019 & 2032
- Table 60: Global Pharmaceutical Intermediates Market Revenue Million Forecast, by Application 2019 & 2032
- Table 61: Global Pharmaceutical Intermediates Market Revenue Million Forecast, by End-User 2019 & 2032
- Table 62: Global Pharmaceutical Intermediates Market Revenue Million Forecast, by Country 2019 & 2032
- Table 63: GCC Pharmaceutical Intermediates Market Revenue (Million) Forecast, by Application 2019 & 2032
- Table 64: South Africa Pharmaceutical Intermediates Market Revenue (Million) Forecast, by Application 2019 & 2032
- Table 65: Rest of Middle East and Africa Pharmaceutical Intermediates Market Revenue (Million) Forecast, by Application 2019 & 2032
- Table 66: Global Pharmaceutical Intermediates Market Revenue Million Forecast, by Type 2019 & 2032
- Table 67: Global Pharmaceutical Intermediates Market Revenue Million Forecast, by Application 2019 & 2032
- Table 68: Global Pharmaceutical Intermediates Market Revenue Million Forecast, by End-User 2019 & 2032
- Table 69: Global Pharmaceutical Intermediates Market Revenue Million Forecast, by Country 2019 & 2032
- Table 70: Brazil Pharmaceutical Intermediates Market Revenue (Million) Forecast, by Application 2019 & 2032
- Table 71: Argentina Pharmaceutical Intermediates Market Revenue (Million) Forecast, by Application 2019 & 2032
- Table 72: Rest of South America Pharmaceutical Intermediates Market Revenue (Million) Forecast, by Application 2019 & 2032
Frequently Asked Questions
1. What is the projected Compound Annual Growth Rate (CAGR) of the Pharmaceutical Intermediates Market?
The projected CAGR is approximately 7.42%.
2. Which companies are prominent players in the Pharmaceutical Intermediates Market?
Key companies in the market include Vertellus Holdings LLC, Aceto Corporation, Lianhetech, Yin-sheng Bio-tech Co Ltd *List Not Exhaustive, Midas Pharma GmbH, Sanofi SAIS, BASF SE, Dishman Group, A R Life Science, Chiracon GmbH, Green Vision Life Sciences, Codexis Inc.
3. What are the main segments of the Pharmaceutical Intermediates Market?
The market segments include Type, Application, End-User.
4. Can you provide details about the market size?
The market size is estimated to be USD 42.31 Million as of 2022.
5. What are some drivers contributing to market growth?
Increasing Prevalence of Chronic Diseases; Growing R&D Initiatives and Activities in the Pharmaceutical Industry.
6. What are the notable trends driving market growth?
Cardiovascular Drugs Hold Significant Share in the Global Pharmaceutical Intermediates Market.
7. Are there any restraints impacting market growth?
Stringent Regulatory Issues Regarding Certain Pharmaceutical Intermediate Substances.
8. Can you provide examples of recent developments in the market?
In March 2022, Sumitomo Chemical Co., Ltd. announced that it will construct a new manufacturing plant for active pharmaceutical ingredients (APIs) and intermediates for small molecule drugs at its Oita Works (Oita City, Oita Prefecture, Japan). This project is to enhance the Company's capacity to supply a variety of high-quality APIs and intermediates in response to the increasing demand for small-molecule drugs.
9. What pricing options are available for accessing the report?
Pricing options include single-user, multi-user, and enterprise licenses priced at USD 4750, USD 5250, and USD 8750 respectively.
10. Is the market size provided in terms of value or volume?
The market size is provided in terms of value, measured in Million.
11. Are there any specific market keywords associated with the report?
Yes, the market keyword associated with the report is "Pharmaceutical Intermediates Market," which aids in identifying and referencing the specific market segment covered.
12. How do I determine which pricing option suits my needs best?
The pricing options vary based on user requirements and access needs. Individual users may opt for single-user licenses, while businesses requiring broader access may choose multi-user or enterprise licenses for cost-effective access to the report.
13. Are there any additional resources or data provided in the Pharmaceutical Intermediates Market report?
While the report offers comprehensive insights, it's advisable to review the specific contents or supplementary materials provided to ascertain if additional resources or data are available.
14. How can I stay updated on further developments or reports in the Pharmaceutical Intermediates Market?
To stay informed about further developments, trends, and reports in the Pharmaceutical Intermediates Market, consider subscribing to industry newsletters, following relevant companies and organizations, or regularly checking reputable industry news sources and publications.
Methodology
Step 1 - Identification of Relevant Samples Size from Population Database


Step 2 - Approaches for Defining Global Market Size (Value, Volume* & Price*)

Note*: In applicable scenarios
Step 3 - Data Sources
Primary Research
- Web Analytics
- Survey Reports
- Research Institute
- Latest Research Reports
- Opinion Leaders
Secondary Research
- Annual Reports
- White Paper
- Latest Press Release
- Industry Association
- Paid Database
- Investor Presentations

Step 4 - Data Triangulation
Involves using different sources of information in order to increase the validity of a study
These sources are likely to be stakeholders in a program - participants, other researchers, program staff, other community members, and so on.
Then we put all data in single framework & apply various statistical tools to find out the dynamic on the market.
During the analysis stage, feedback from the stakeholder groups would be compared to determine areas of agreement as well as areas of divergence
