

Key Insights
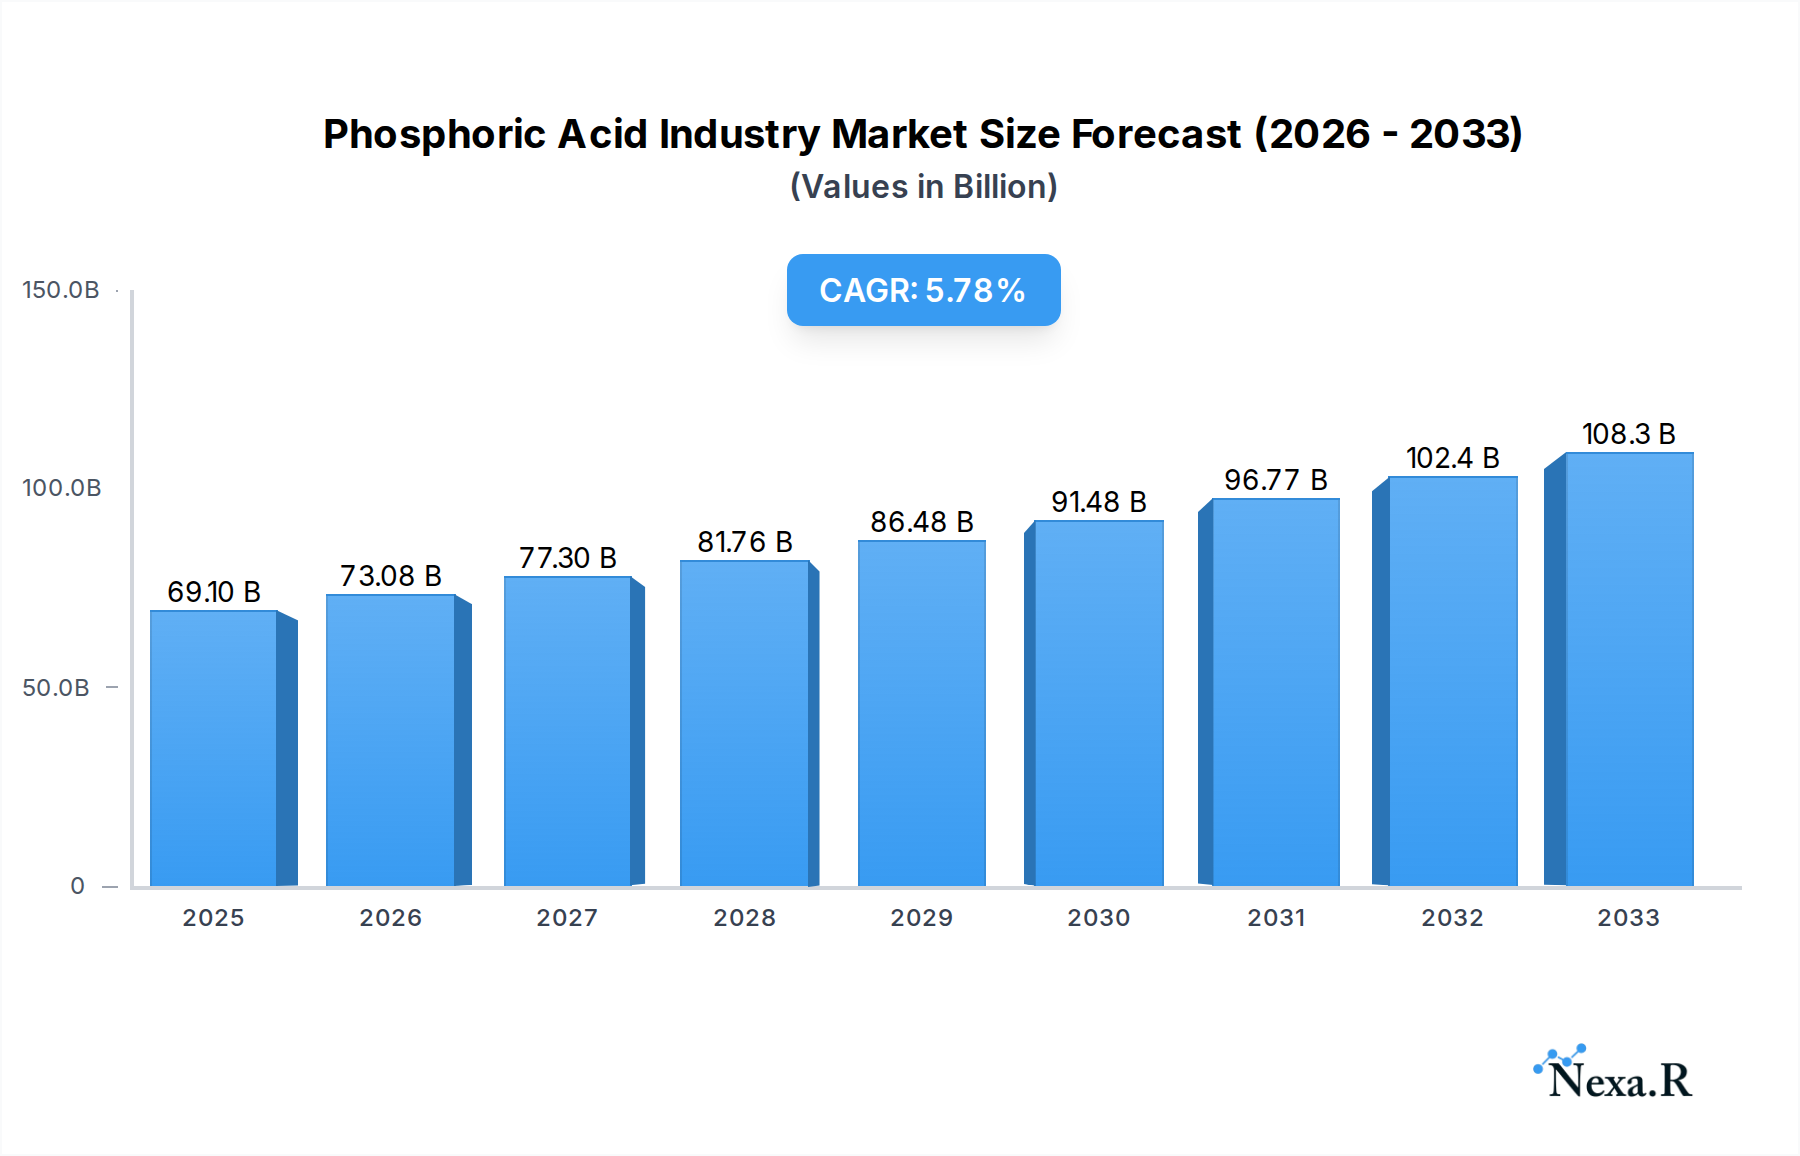
The global Phosphoric Acid market is projected for substantial growth, with an estimated market size of $69.1 billion in 2025. This expansion is underpinned by a robust Compound Annual Growth Rate (CAGR) of 5.7% anticipated from 2025 to 2033. The increasing demand from the fertilizer industry remains a primary driver, as phosphoric acid is a crucial component in the production of phosphate fertilizers, essential for global food security. Furthermore, the food and beverage sector is witnessing a rising demand for phosphoric acid as an acidulant and flavoring agent in various products. The chemical industry also contributes significantly to market growth, utilizing phosphoric acid in the production of a wide array of chemicals and industrial applications. Emerging economies, particularly in the Asia Pacific region, are expected to be key growth engines due to rapid industrialization and increasing agricultural output. The medicine sector's application of phosphoric acid in pharmaceuticals and dental products further bolsters its market relevance.

Phosphoric Acid Industry Market Size (In Billion)
Despite the positive growth trajectory, certain factors could moderate the market's pace. The fluctuating prices of raw materials, particularly phosphate rock and sulfur, can impact production costs and profitability for manufacturers. Stringent environmental regulations concerning the production and disposal of phosphoric acid by-products, such as phosphogypsum, may also pose a challenge, necessitating investment in cleaner production technologies. However, ongoing research and development in creating high-purity phosphoric acid for specialized applications, like in electronics and batteries, are creating new avenues for market expansion. Innovations in recycling and waste management for phosphoric acid production are also being explored to mitigate environmental concerns and enhance resource efficiency. The market's diverse application spectrum, from agriculture to advanced technological uses, ensures its continued relevance and demand globally.
Phosphoric Acid Industry Company Market Share
This comprehensive report provides an in-depth analysis of the global phosphoric acid market, a critical compound integral to agricultural fertilizers, food and beverages, chemicals, medicine, and metallurgy. Covering a study period from 2019 to 2033, with a base year of 2025 and a forecast period extending from 2025 to 2033, this report offers invaluable insights for industry stakeholders, investors, and decision-makers. We meticulously examine market dynamics, growth trends, regional dominance, product landscape, key drivers, challenges, emerging opportunities, and the strategic moves of leading companies shaping this vital sector. All quantitative data is presented in billions of USD unless otherwise specified.
Phosphoric Acid Industry Market Dynamics & Structure
The global phosphoric acid market exhibits a moderately concentrated structure, with a few key players dominating production and distribution. Technological innovation remains a significant driver, particularly in developing more efficient and sustainable production processes, such as advancements in wet-process phosphoric acid technology and purification techniques for food-grade applications. Stringent environmental regulations globally are influencing production methods and waste management practices, driving investments in cleaner technologies. Competitive product substitutes, primarily in lower-grade industrial applications, do exist but are often outcompeted by the purity and versatility of phosphoric acid. End-user demographics are heavily influenced by the agricultural sector's demand for phosphate fertilizers, which constitutes the largest segment. However, the food and beverage sector's increasing demand for phosphoric acid as an acidulant and preservative, alongside its critical role in pharmaceuticals and metallurgical treatments, contributes to market diversification. Mergers and acquisitions (M&A) trends are actively reshaping the competitive landscape, with strategic acquisitions aimed at expanding product portfolios, geographical reach, and vertical integration.
- Market Concentration: Dominated by a mix of large multinational corporations and regional players.
- Technological Innovation Drivers: Focus on process efficiency, sustainability, and higher purity grades.
- Regulatory Frameworks: Environmental compliance and product safety standards are key influences.
- Competitive Product Substitutes: Exist primarily in bulk chemical applications, but high-purity grades offer differentiation.
- End-User Demographics: Agriculture (fertilizers) is the largest driver, followed by food & beverages and industrial applications.
- M&A Trends: Strategic acquisitions to enhance market position and expand capabilities are prevalent.
Phosphoric Acid Industry Growth Trends & Insights
The phosphoric acid industry is poised for robust growth, driven by the ever-increasing global demand for food and the expanding applications of phosphoric acid across diverse sectors. The market size is projected to witness a significant expansion, with a Compound Annual Growth Rate (CAGR) of approximately xx% during the forecast period. This growth is underpinned by the rising adoption rates of advanced fertilizer formulations that enhance crop yields, directly impacting the agricultural segment. Technological disruptions, including the development of novel purification methods and the exploration of alternative sourcing, are continuously refining production efficiencies and product quality. Consumer behavior shifts, particularly the growing preference for processed foods and beverages requiring acidulants, further fuel demand. The expanding pharmaceutical industry's reliance on phosphoric acid for drug formulation and the metallurgical sector's use in metal treatment and passivation also contribute significantly to market penetration across various end-user industries. The base year market size for phosphoric acid was estimated at USD xx billion in 2025, with projections indicating a substantial increase by 2033.
Dominant Regions, Countries, or Segments in Phosphoric Acid Industry
The Fertilizer end-user industry stands as the undisputed dominant segment within the global phosphoric acid market, acting as the primary engine for its growth and expansion. This dominance is intrinsically linked to the fundamental need for enhanced agricultural productivity to feed a growing global population. Key drivers behind this segment's supremacy include:
- Global Food Security Initiatives: Government policies and international organizations prioritizing agricultural output to ensure food security directly translate into increased demand for phosphate-based fertilizers, of which phosphoric acid is a crucial precursor.
- Arable Land Limitations: With limited arable land available, farmers are increasingly reliant on fertilizers to maximize crop yields from existing farmland, thus boosting the consumption of phosphoric acid-derived fertilizers.
- Technological Advancements in Agriculture: The adoption of precision agriculture techniques and the development of more efficient fertilizer formulations, often incorporating phosphoric acid, further enhance its demand in this sector.
- Economic Policies Supporting Agriculture: Subsidies and trade policies in major agricultural economies actively promote fertilizer use, creating a stable and growing demand base.
- Emerging Economies' Agricultural Growth: Rapidly developing nations are witnessing significant growth in their agricultural sectors, driven by industrialization and increasing disposable incomes, which in turn fuels fertilizer consumption.
While the fertilizer segment leads, the Food and Beverages sector represents a significant and growing market for high-purity phosphoric acid. Its use as an acidulant, pH regulator, and flavoring agent in carbonated drinks, processed foods, and dairy products contributes substantially to market volume and value. The Chemicals segment, encompassing a wide array of industrial applications from detergents to water treatment, also provides a steady demand. The Medicine sector, where phosphoric acid is employed in the manufacturing of pharmaceuticals and as a dental etching agent, demonstrates consistent growth due to advancements in healthcare. The Metallurgy sector utilizes phosphoric acid for metal cleaning, rust removal, and phosphating, offering a niche but important market. The "Other End-user Industries" category captures diverse applications that, collectively, contribute to the overall market's resilience and expansion.
Phosphoric Acid Industry Product Landscape
The phosphoric acid product landscape is characterized by continuous innovation aimed at enhancing purity, functionality, and sustainability. Key product advancements include the development of ultra-high purity phosphoric acid grades essential for the semiconductor and electronics industries, as well as specialized food-grade varieties meeting stringent regulatory requirements for pH adjustment and flavor enhancement in beverages and food products. Advances in purification technologies, such as solvent extraction and membrane filtration, are crucial for achieving these higher purity levels. The performance metrics of phosphoric acid are continuously being refined, with a focus on its efficacy as a fertilizer nutrient, its stability in food formulations, and its effectiveness in metal treatment processes. Unique selling propositions for manufacturers lie in their ability to consistently deliver high-quality products, offer customized grades, and ensure supply chain reliability.
Key Drivers, Barriers & Challenges in Phosphoric Acid Industry
Key Drivers:
- Global Population Growth & Food Demand: The escalating need for food security directly fuels the demand for phosphate fertilizers.
- Agricultural Modernization: Increased adoption of advanced farming techniques and higher-yielding crop varieties necessitates greater fertilizer usage.
- Expanding Industrial Applications: Growing use in food & beverages, pharmaceuticals, and metallurgy provides diversified demand streams.
- Technological Advancements: Innovations in production efficiency and purification processes drive market competitiveness.
- Government Support for Agriculture: Subsidies and policies promoting fertilizer use in key regions bolster demand.
Key Barriers & Challenges:
- Environmental Regulations & Compliance: Stricter environmental laws necessitate significant investment in cleaner production technologies and waste management, increasing operational costs.
- Phosphate Rock Scarcity & Price Volatility: Reliance on finite phosphate rock reserves can lead to supply chain disruptions and price fluctuations.
- High Capital Investment: Establishing and maintaining large-scale phosphoric acid production facilities requires substantial capital outlay, posing a barrier to new entrants.
- Geopolitical Instability: Disruptions in key phosphate-producing regions can impact global supply and pricing.
- Competition from Alternative Fertilizers: While phosphate is essential, the development of alternative nutrient sources or more efficient delivery methods could present long-term challenges.
Emerging Opportunities in Phosphoric Acid Industry
Emerging opportunities within the phosphoric acid industry lie in the development of novel fertilizer technologies that improve nutrient uptake efficiency and reduce environmental impact, such as controlled-release fertilizers. The growing trend towards sustainable and organic food production is also creating demand for bio-based phosphoric acid alternatives or more environmentally friendly production methods. Furthermore, the expanding use of phosphoric acid in advanced materials, battery technologies, and specialized chemical synthesis presents untapped market potential. The increasing focus on recycling and circular economy principles offers opportunities for developing processes to recover phosphorus from waste streams, creating a more sustainable supply chain.
Growth Accelerators in the Phosphoric Acid Industry Industry
The long-term growth of the phosphoric acid industry is being significantly accelerated by continuous technological breakthroughs in extraction and purification, leading to higher yields and reduced environmental footprints. Strategic partnerships and collaborations between raw material suppliers, producers, and end-users are fostering innovation and market expansion. Furthermore, the increasing investment in agricultural infrastructure and research and development in emerging economies is creating new demand centers. The development of more specialized, high-value phosphoric acid grades catering to niche industrial and pharmaceutical applications also acts as a significant growth catalyst, diversifying revenue streams beyond traditional fertilizer markets.
Key Players Shaping the Phosphoric Acid Industry Market
- ICL
- Innophos
- Mosaic
- J R Simplot Company
- EuroChem Group
- Sterlite Copper (A Unit of Vedanta Limited)
- Agropolychim
- Aditya Birla Chemicals
- Phosagro
- IFFCO
- Nutrien Ltd
Notable Milestones in Phosphoric Acid Industry Sector
- May 2023: The OCP Group secured a 50% ownership share in GlobalFeed SL, broadening its presence in the animal nutrition industry and enhancing customer accessibility to its phosphoric acid products.
- July 2022: Nutrien Ltd acquired Brazilian company Casa do Adubo SA (Casa do Adubo), a transaction involving 39 retail stores and ten distribution centers, expanding Nutrien's customer reach and expected to generate USD 400 million in sales revenue.
- February 2022: EuroChem Group completed the acquisition of the Serra do Salitre phosphate project in Minas Gerais, comprising an open-pit phosphate mine with over 350 million metric tons of reserves and a plant with a 1 MMT fertilizer production capacity.
In-Depth Phosphoric Acid Industry Market Outlook
The future outlook for the phosphoric acid industry is exceptionally strong, driven by sustained global demand for food and a widening array of industrial applications. Growth accelerators such as advancements in sustainable production, the development of specialized high-purity grades for burgeoning sectors like electronics and pharmaceuticals, and strategic market expansions in developing economies are expected to propel the industry forward. The increasing emphasis on resource efficiency and the circular economy presents opportunities for innovation in phosphorus recovery and recycling. Strategic partnerships and continued investment in R&D will be crucial for players to capitalize on these evolving market dynamics and secure long-term profitability.
Phosphoric Acid Industry Segmentation
-
1. End-user Industry
- 1.1. Fertilizer
- 1.2. Food and Beverages
- 1.3. Chemicals
- 1.4. Medicine
- 1.5. Metallurgy
- 1.6. Other End-user Industries
Phosphoric Acid Industry Segmentation By Geography
-
1. Asia Pacific
- 1.1. China
- 1.2. India
- 1.3. Japan
- 1.4. South Korea
- 1.5. Rest of Asia Pacific
-
2. North America
- 2.1. United States
- 2.2. Mexico
- 2.3. Canada
-
3. Europe
- 3.1. Germany
- 3.2. United Kingdom
- 3.3. Italy
- 3.4. France
- 3.5. Rest of Europe
-
4. South America
- 4.1. Brazil
- 4.2. Argentina
- 4.3. Rest of South America
-
5. Middle East and Africa
- 5.1. Saudi Arabia
- 5.2. South Africa
- 5.3. Rest of Middle East and Africa
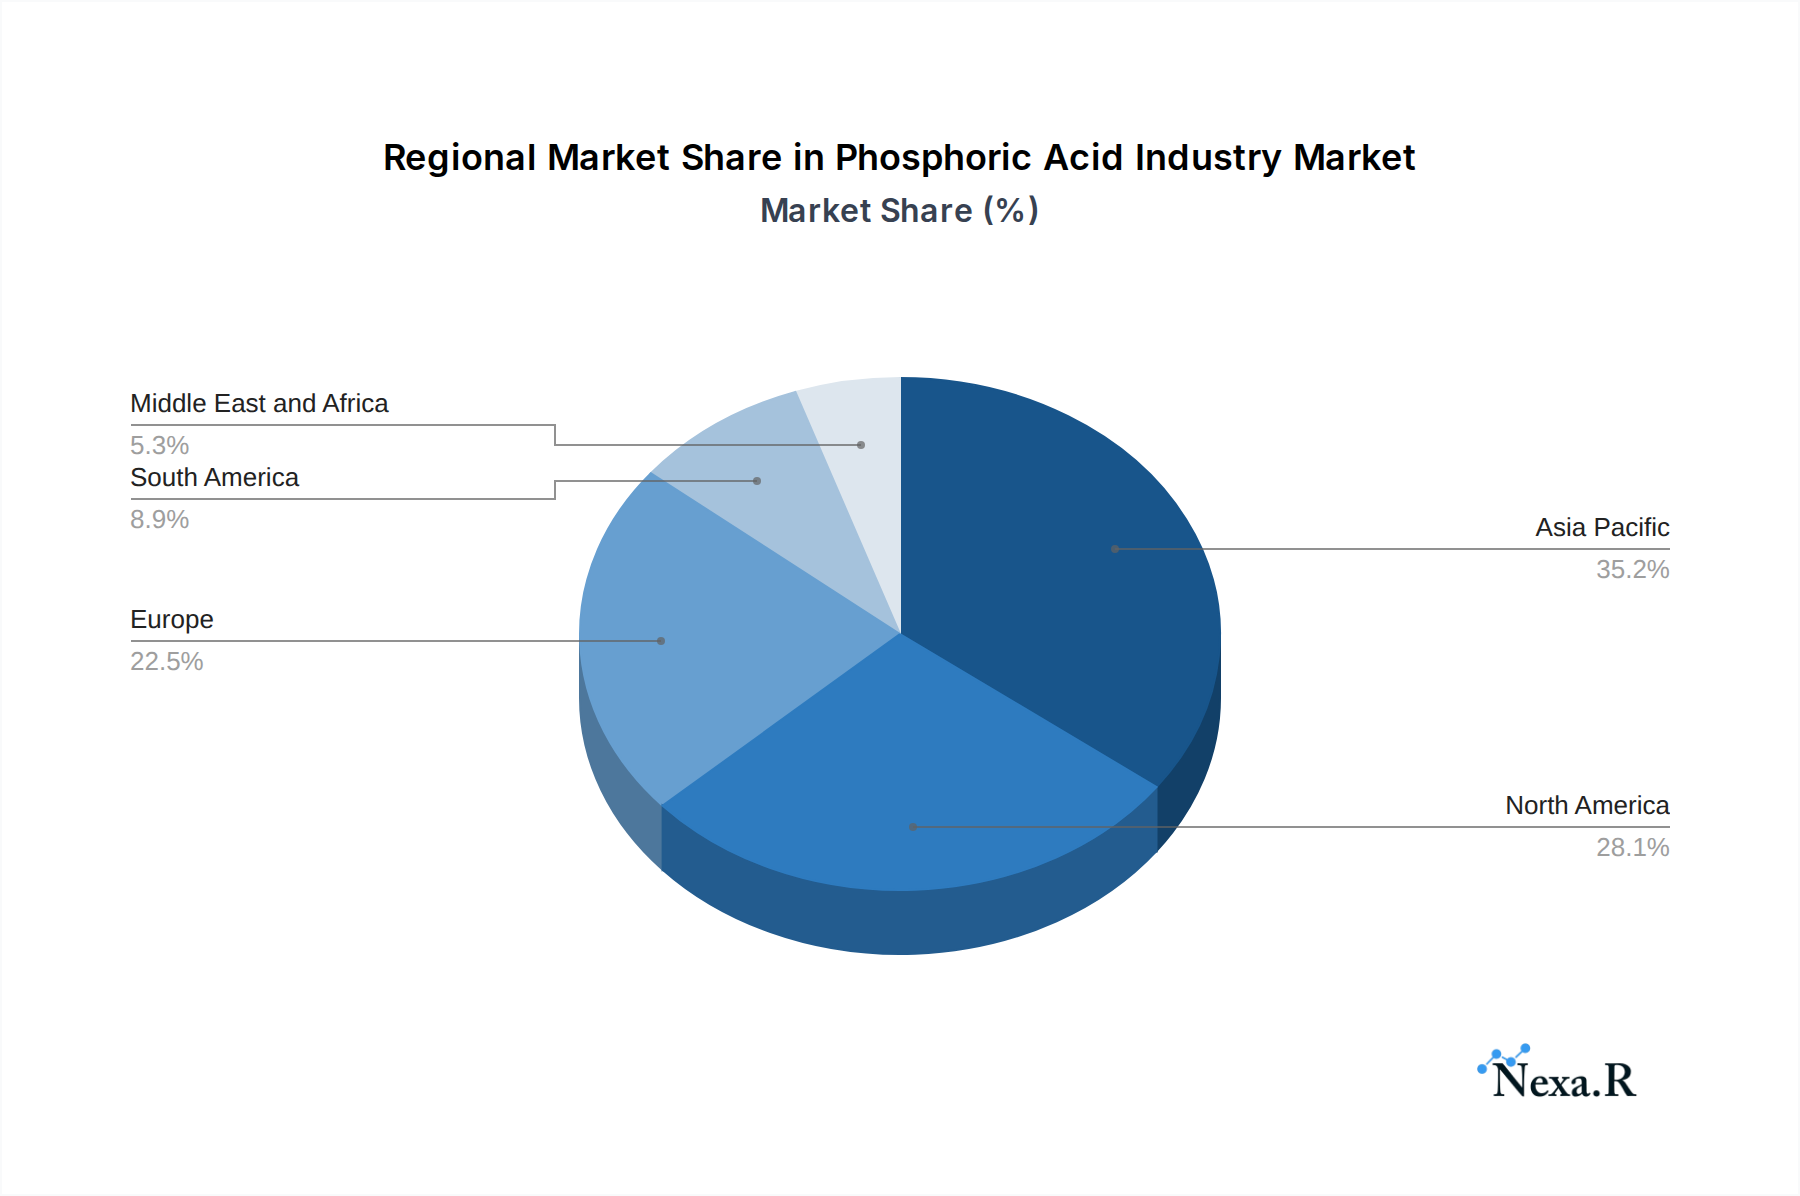
Phosphoric Acid Industry Regional Market Share
Geographic Coverage of Phosphoric Acid Industry
Phosphoric Acid Industry REPORT HIGHLIGHTS
| Aspects | Details |
|---|---|
| Study Period | 2020-2034 |
| Base Year | 2025 |
| Estimated Year | 2026 |
| Forecast Period | 2026-2034 |
| Historical Period | 2020-2025 |
| Growth Rate | CAGR of 5.7% from 2020-2034 |
| Segmentation |
|
Table of Contents
- 1. Introduction
- 1.1. Research Scope
- 1.2. Market Segmentation
- 1.3. Research Objective
- 1.4. Definitions and Assumptions
- 2. Executive Summary
- 2.1. Market Snapshot
- 3. Market Dynamics
- 3.1. Market Drivers
- 3.2. Market Restrains
- 3.3. Market Trends
- 3.4. Market Opportunities
- 4. Market Factor Analysis
- 4.1. Porters Five Forces
- 4.1.1. Bargaining Power of Suppliers
- 4.1.2. Bargaining Power of Buyers
- 4.1.3. Threat of New Entrants
- 4.1.4. Threat of Substitutes
- 4.1.5. Competitive Rivalry
- 4.2. PESTEL analysis
- 4.3. BCG Analysis
- 4.3.1. Stars (High Growth, High Market Share)
- 4.3.2. Cash Cows (Low Growth, High Market Share)
- 4.3.3. Question Mark (High Growth, Low Market Share)
- 4.3.4. Dogs (Low Growth, Low Market Share)
- 4.4. Ansoff Matrix Analysis
- 4.5. Supply Chain Analysis
- 4.6. Regulatory Landscape
- 4.7. Current Market Potential and Opportunity Assessment (TAM–SAM–SOM Framework)
- 4.8. NRP Analyst Note
- 4.1. Porters Five Forces
- 5. Market Analysis, Insights and Forecast 2021-2033
- 5.1. Market Analysis, Insights and Forecast - by End-user Industry
- 5.1.1. Fertilizer
- 5.1.2. Food and Beverages
- 5.1.3. Chemicals
- 5.1.4. Medicine
- 5.1.5. Metallurgy
- 5.1.6. Other End-user Industries
- 5.2. Market Analysis, Insights and Forecast - by Region
- 5.2.1. Asia Pacific
- 5.2.2. North America
- 5.2.3. Europe
- 5.2.4. South America
- 5.2.5. Middle East and Africa
- 5.1. Market Analysis, Insights and Forecast - by End-user Industry
- 6. Global Phosphoric Acid Industry Analysis, Insights and Forecast, 2021-2033
- 6.1. Market Analysis, Insights and Forecast - by End-user Industry
- 6.1.1. Fertilizer
- 6.1.2. Food and Beverages
- 6.1.3. Chemicals
- 6.1.4. Medicine
- 6.1.5. Metallurgy
- 6.1.6. Other End-user Industries
- 6.1. Market Analysis, Insights and Forecast - by End-user Industry
- 7. Asia Pacific Phosphoric Acid Industry Analysis, Insights and Forecast, 2020-2032
- 7.1. Market Analysis, Insights and Forecast - by End-user Industry
- 7.1.1. Fertilizer
- 7.1.2. Food and Beverages
- 7.1.3. Chemicals
- 7.1.4. Medicine
- 7.1.5. Metallurgy
- 7.1.6. Other End-user Industries
- 7.1. Market Analysis, Insights and Forecast - by End-user Industry
- 8. North America Phosphoric Acid Industry Analysis, Insights and Forecast, 2020-2032
- 8.1. Market Analysis, Insights and Forecast - by End-user Industry
- 8.1.1. Fertilizer
- 8.1.2. Food and Beverages
- 8.1.3. Chemicals
- 8.1.4. Medicine
- 8.1.5. Metallurgy
- 8.1.6. Other End-user Industries
- 8.1. Market Analysis, Insights and Forecast - by End-user Industry
- 9. Europe Phosphoric Acid Industry Analysis, Insights and Forecast, 2020-2032
- 9.1. Market Analysis, Insights and Forecast - by End-user Industry
- 9.1.1. Fertilizer
- 9.1.2. Food and Beverages
- 9.1.3. Chemicals
- 9.1.4. Medicine
- 9.1.5. Metallurgy
- 9.1.6. Other End-user Industries
- 9.1. Market Analysis, Insights and Forecast - by End-user Industry
- 10. South America Phosphoric Acid Industry Analysis, Insights and Forecast, 2020-2032
- 10.1. Market Analysis, Insights and Forecast - by End-user Industry
- 10.1.1. Fertilizer
- 10.1.2. Food and Beverages
- 10.1.3. Chemicals
- 10.1.4. Medicine
- 10.1.5. Metallurgy
- 10.1.6. Other End-user Industries
- 10.1. Market Analysis, Insights and Forecast - by End-user Industry
- 11. Middle East and Africa Phosphoric Acid Industry Analysis, Insights and Forecast, 2020-2032
- 11.1. Market Analysis, Insights and Forecast - by End-user Industry
- 11.1.1. Fertilizer
- 11.1.2. Food and Beverages
- 11.1.3. Chemicals
- 11.1.4. Medicine
- 11.1.5. Metallurgy
- 11.1.6. Other End-user Industries
- 11.1. Market Analysis, Insights and Forecast - by End-user Industry
- 12. Competitive Analysis
- 12.1. Company Profiles
- 12.1.1 ICL
- 12.1.1.1. Company Overview
- 12.1.1.2. Products
- 12.1.1.3. Company Financials
- 12.1.1.4. SWOT Analysis
- 12.1.2 Innophos
- 12.1.2.1. Company Overview
- 12.1.2.2. Products
- 12.1.2.3. Company Financials
- 12.1.2.4. SWOT Analysis
- 12.1.3 Mosaic
- 12.1.3.1. Company Overview
- 12.1.3.2. Products
- 12.1.3.3. Company Financials
- 12.1.3.4. SWOT Analysis
- 12.1.4 J R Simplot Company
- 12.1.4.1. Company Overview
- 12.1.4.2. Products
- 12.1.4.3. Company Financials
- 12.1.4.4. SWOT Analysis
- 12.1.5 EuroChem Group
- 12.1.5.1. Company Overview
- 12.1.5.2. Products
- 12.1.5.3. Company Financials
- 12.1.5.4. SWOT Analysis
- 12.1.6 Sterlite Copper (A Unit of Vedanta Limited) *List Not Exhaustive
- 12.1.6.1. Company Overview
- 12.1.6.2. Products
- 12.1.6.3. Company Financials
- 12.1.6.4. SWOT Analysis
- 12.1.7 Agropolychim
- 12.1.7.1. Company Overview
- 12.1.7.2. Products
- 12.1.7.3. Company Financials
- 12.1.7.4. SWOT Analysis
- 12.1.8 Aditya Birla Chemicals
- 12.1.8.1. Company Overview
- 12.1.8.2. Products
- 12.1.8.3. Company Financials
- 12.1.8.4. SWOT Analysis
- 12.1.9 Phosagro
- 12.1.9.1. Company Overview
- 12.1.9.2. Products
- 12.1.9.3. Company Financials
- 12.1.9.4. SWOT Analysis
- 12.1.10 IFFCO
- 12.1.10.1. Company Overview
- 12.1.10.2. Products
- 12.1.10.3. Company Financials
- 12.1.10.4. SWOT Analysis
- 12.1.11 Nutrien Ltd
- 12.1.11.1. Company Overview
- 12.1.11.2. Products
- 12.1.11.3. Company Financials
- 12.1.11.4. SWOT Analysis
- 12.1.1 ICL
- 12.2. Market Entropy
- 12.2.1 Company's Key Areas Served
- 12.2.2 Recent Developments
- 12.3. Company Market Share Analysis 2025
- 12.3.1 Top 5 Companies Market Share Analysis
- 12.3.2 Top 3 Companies Market Share Analysis
- 12.4. List of Potential Customers
- 13. Research Methodology
List of Figures
- Figure 1: Global Phosphoric Acid Industry Revenue Breakdown (billion, %) by Region 2025 & 2033
- Figure 2: Global Phosphoric Acid Industry Volume Breakdown (Million, %) by Region 2025 & 2033
- Figure 3: Asia Pacific Phosphoric Acid Industry Revenue (billion), by End-user Industry 2025 & 2033
- Figure 4: Asia Pacific Phosphoric Acid Industry Volume (Million), by End-user Industry 2025 & 2033
- Figure 5: Asia Pacific Phosphoric Acid Industry Revenue Share (%), by End-user Industry 2025 & 2033
- Figure 6: Asia Pacific Phosphoric Acid Industry Volume Share (%), by End-user Industry 2025 & 2033
- Figure 7: Asia Pacific Phosphoric Acid Industry Revenue (billion), by Country 2025 & 2033
- Figure 8: Asia Pacific Phosphoric Acid Industry Volume (Million), by Country 2025 & 2033
- Figure 9: Asia Pacific Phosphoric Acid Industry Revenue Share (%), by Country 2025 & 2033
- Figure 10: Asia Pacific Phosphoric Acid Industry Volume Share (%), by Country 2025 & 2033
- Figure 11: North America Phosphoric Acid Industry Revenue (billion), by End-user Industry 2025 & 2033
- Figure 12: North America Phosphoric Acid Industry Volume (Million), by End-user Industry 2025 & 2033
- Figure 13: North America Phosphoric Acid Industry Revenue Share (%), by End-user Industry 2025 & 2033
- Figure 14: North America Phosphoric Acid Industry Volume Share (%), by End-user Industry 2025 & 2033
- Figure 15: North America Phosphoric Acid Industry Revenue (billion), by Country 2025 & 2033
- Figure 16: North America Phosphoric Acid Industry Volume (Million), by Country 2025 & 2033
- Figure 17: North America Phosphoric Acid Industry Revenue Share (%), by Country 2025 & 2033
- Figure 18: North America Phosphoric Acid Industry Volume Share (%), by Country 2025 & 2033
- Figure 19: Europe Phosphoric Acid Industry Revenue (billion), by End-user Industry 2025 & 2033
- Figure 20: Europe Phosphoric Acid Industry Volume (Million), by End-user Industry 2025 & 2033
- Figure 21: Europe Phosphoric Acid Industry Revenue Share (%), by End-user Industry 2025 & 2033
- Figure 22: Europe Phosphoric Acid Industry Volume Share (%), by End-user Industry 2025 & 2033
- Figure 23: Europe Phosphoric Acid Industry Revenue (billion), by Country 2025 & 2033
- Figure 24: Europe Phosphoric Acid Industry Volume (Million), by Country 2025 & 2033
- Figure 25: Europe Phosphoric Acid Industry Revenue Share (%), by Country 2025 & 2033
- Figure 26: Europe Phosphoric Acid Industry Volume Share (%), by Country 2025 & 2033
- Figure 27: South America Phosphoric Acid Industry Revenue (billion), by End-user Industry 2025 & 2033
- Figure 28: South America Phosphoric Acid Industry Volume (Million), by End-user Industry 2025 & 2033
- Figure 29: South America Phosphoric Acid Industry Revenue Share (%), by End-user Industry 2025 & 2033
- Figure 30: South America Phosphoric Acid Industry Volume Share (%), by End-user Industry 2025 & 2033
- Figure 31: South America Phosphoric Acid Industry Revenue (billion), by Country 2025 & 2033
- Figure 32: South America Phosphoric Acid Industry Volume (Million), by Country 2025 & 2033
- Figure 33: South America Phosphoric Acid Industry Revenue Share (%), by Country 2025 & 2033
- Figure 34: South America Phosphoric Acid Industry Volume Share (%), by Country 2025 & 2033
- Figure 35: Middle East and Africa Phosphoric Acid Industry Revenue (billion), by End-user Industry 2025 & 2033
- Figure 36: Middle East and Africa Phosphoric Acid Industry Volume (Million), by End-user Industry 2025 & 2033
- Figure 37: Middle East and Africa Phosphoric Acid Industry Revenue Share (%), by End-user Industry 2025 & 2033
- Figure 38: Middle East and Africa Phosphoric Acid Industry Volume Share (%), by End-user Industry 2025 & 2033
- Figure 39: Middle East and Africa Phosphoric Acid Industry Revenue (billion), by Country 2025 & 2033
- Figure 40: Middle East and Africa Phosphoric Acid Industry Volume (Million), by Country 2025 & 2033
- Figure 41: Middle East and Africa Phosphoric Acid Industry Revenue Share (%), by Country 2025 & 2033
- Figure 42: Middle East and Africa Phosphoric Acid Industry Volume Share (%), by Country 2025 & 2033
List of Tables
- Table 1: Global Phosphoric Acid Industry Revenue billion Forecast, by End-user Industry 2020 & 2033
- Table 2: Global Phosphoric Acid Industry Volume Million Forecast, by End-user Industry 2020 & 2033
- Table 3: Global Phosphoric Acid Industry Revenue billion Forecast, by Region 2020 & 2033
- Table 4: Global Phosphoric Acid Industry Volume Million Forecast, by Region 2020 & 2033
- Table 5: Global Phosphoric Acid Industry Revenue billion Forecast, by End-user Industry 2020 & 2033
- Table 6: Global Phosphoric Acid Industry Volume Million Forecast, by End-user Industry 2020 & 2033
- Table 7: Global Phosphoric Acid Industry Revenue billion Forecast, by Country 2020 & 2033
- Table 8: Global Phosphoric Acid Industry Volume Million Forecast, by Country 2020 & 2033
- Table 9: China Phosphoric Acid Industry Revenue (billion) Forecast, by Application 2020 & 2033
- Table 10: China Phosphoric Acid Industry Volume (Million) Forecast, by Application 2020 & 2033
- Table 11: India Phosphoric Acid Industry Revenue (billion) Forecast, by Application 2020 & 2033
- Table 12: India Phosphoric Acid Industry Volume (Million) Forecast, by Application 2020 & 2033
- Table 13: Japan Phosphoric Acid Industry Revenue (billion) Forecast, by Application 2020 & 2033
- Table 14: Japan Phosphoric Acid Industry Volume (Million) Forecast, by Application 2020 & 2033
- Table 15: South Korea Phosphoric Acid Industry Revenue (billion) Forecast, by Application 2020 & 2033
- Table 16: South Korea Phosphoric Acid Industry Volume (Million) Forecast, by Application 2020 & 2033
- Table 17: Rest of Asia Pacific Phosphoric Acid Industry Revenue (billion) Forecast, by Application 2020 & 2033
- Table 18: Rest of Asia Pacific Phosphoric Acid Industry Volume (Million) Forecast, by Application 2020 & 2033
- Table 19: Global Phosphoric Acid Industry Revenue billion Forecast, by End-user Industry 2020 & 2033
- Table 20: Global Phosphoric Acid Industry Volume Million Forecast, by End-user Industry 2020 & 2033
- Table 21: Global Phosphoric Acid Industry Revenue billion Forecast, by Country 2020 & 2033
- Table 22: Global Phosphoric Acid Industry Volume Million Forecast, by Country 2020 & 2033
- Table 23: United States Phosphoric Acid Industry Revenue (billion) Forecast, by Application 2020 & 2033
- Table 24: United States Phosphoric Acid Industry Volume (Million) Forecast, by Application 2020 & 2033
- Table 25: Mexico Phosphoric Acid Industry Revenue (billion) Forecast, by Application 2020 & 2033
- Table 26: Mexico Phosphoric Acid Industry Volume (Million) Forecast, by Application 2020 & 2033
- Table 27: Canada Phosphoric Acid Industry Revenue (billion) Forecast, by Application 2020 & 2033
- Table 28: Canada Phosphoric Acid Industry Volume (Million) Forecast, by Application 2020 & 2033
- Table 29: Global Phosphoric Acid Industry Revenue billion Forecast, by End-user Industry 2020 & 2033
- Table 30: Global Phosphoric Acid Industry Volume Million Forecast, by End-user Industry 2020 & 2033
- Table 31: Global Phosphoric Acid Industry Revenue billion Forecast, by Country 2020 & 2033
- Table 32: Global Phosphoric Acid Industry Volume Million Forecast, by Country 2020 & 2033
- Table 33: Germany Phosphoric Acid Industry Revenue (billion) Forecast, by Application 2020 & 2033
- Table 34: Germany Phosphoric Acid Industry Volume (Million) Forecast, by Application 2020 & 2033
- Table 35: United Kingdom Phosphoric Acid Industry Revenue (billion) Forecast, by Application 2020 & 2033
- Table 36: United Kingdom Phosphoric Acid Industry Volume (Million) Forecast, by Application 2020 & 2033
- Table 37: Italy Phosphoric Acid Industry Revenue (billion) Forecast, by Application 2020 & 2033
- Table 38: Italy Phosphoric Acid Industry Volume (Million) Forecast, by Application 2020 & 2033
- Table 39: France Phosphoric Acid Industry Revenue (billion) Forecast, by Application 2020 & 2033
- Table 40: France Phosphoric Acid Industry Volume (Million) Forecast, by Application 2020 & 2033
- Table 41: Rest of Europe Phosphoric Acid Industry Revenue (billion) Forecast, by Application 2020 & 2033
- Table 42: Rest of Europe Phosphoric Acid Industry Volume (Million) Forecast, by Application 2020 & 2033
- Table 43: Global Phosphoric Acid Industry Revenue billion Forecast, by End-user Industry 2020 & 2033
- Table 44: Global Phosphoric Acid Industry Volume Million Forecast, by End-user Industry 2020 & 2033
- Table 45: Global Phosphoric Acid Industry Revenue billion Forecast, by Country 2020 & 2033
- Table 46: Global Phosphoric Acid Industry Volume Million Forecast, by Country 2020 & 2033
- Table 47: Brazil Phosphoric Acid Industry Revenue (billion) Forecast, by Application 2020 & 2033
- Table 48: Brazil Phosphoric Acid Industry Volume (Million) Forecast, by Application 2020 & 2033
- Table 49: Argentina Phosphoric Acid Industry Revenue (billion) Forecast, by Application 2020 & 2033
- Table 50: Argentina Phosphoric Acid Industry Volume (Million) Forecast, by Application 2020 & 2033
- Table 51: Rest of South America Phosphoric Acid Industry Revenue (billion) Forecast, by Application 2020 & 2033
- Table 52: Rest of South America Phosphoric Acid Industry Volume (Million) Forecast, by Application 2020 & 2033
- Table 53: Global Phosphoric Acid Industry Revenue billion Forecast, by End-user Industry 2020 & 2033
- Table 54: Global Phosphoric Acid Industry Volume Million Forecast, by End-user Industry 2020 & 2033
- Table 55: Global Phosphoric Acid Industry Revenue billion Forecast, by Country 2020 & 2033
- Table 56: Global Phosphoric Acid Industry Volume Million Forecast, by Country 2020 & 2033
- Table 57: Saudi Arabia Phosphoric Acid Industry Revenue (billion) Forecast, by Application 2020 & 2033
- Table 58: Saudi Arabia Phosphoric Acid Industry Volume (Million) Forecast, by Application 2020 & 2033
- Table 59: South Africa Phosphoric Acid Industry Revenue (billion) Forecast, by Application 2020 & 2033
- Table 60: South Africa Phosphoric Acid Industry Volume (Million) Forecast, by Application 2020 & 2033
- Table 61: Rest of Middle East and Africa Phosphoric Acid Industry Revenue (billion) Forecast, by Application 2020 & 2033
- Table 62: Rest of Middle East and Africa Phosphoric Acid Industry Volume (Million) Forecast, by Application 2020 & 2033
Frequently Asked Questions
1. What is the projected Compound Annual Growth Rate (CAGR) of the Phosphoric Acid Industry?
The projected CAGR is approximately 5.7%.
2. Which companies are prominent players in the Phosphoric Acid Industry?
Key companies in the market include ICL, Innophos, Mosaic, J R Simplot Company, EuroChem Group, Sterlite Copper (A Unit of Vedanta Limited) *List Not Exhaustive, Agropolychim, Aditya Birla Chemicals, Phosagro, IFFCO, Nutrien Ltd.
3. What are the main segments of the Phosphoric Acid Industry?
The market segments include End-user Industry.
4. Can you provide details about the market size?
The market size is estimated to be USD 69.1 billion as of 2022.
5. What are some drivers contributing to market growth?
High Demand for Fertilizer Industry; Increasing Usage in the Food and Beverage Industry.
6. What are the notable trends driving market growth?
Fertilizer Industry to Dominate the Market.
7. Are there any restraints impacting market growth?
Health Hazards Caused by Phosphoric Acid.
8. Can you provide examples of recent developments in the market?
May 2023: The OCP Group secured a 50% ownership share in GlobalFeed SL. This strategic acquisition enabled OCP to broaden its presence in the animal nutrition industry and enhance customers' accessibility to the company's phosphoric acid products.
9. What pricing options are available for accessing the report?
Pricing options include single-user, multi-user, and enterprise licenses priced at USD 4750, USD 5250, and USD 8750 respectively.
10. Is the market size provided in terms of value or volume?
The market size is provided in terms of value, measured in billion and volume, measured in Million.
11. Are there any specific market keywords associated with the report?
Yes, the market keyword associated with the report is "Phosphoric Acid Industry," which aids in identifying and referencing the specific market segment covered.
12. How do I determine which pricing option suits my needs best?
The pricing options vary based on user requirements and access needs. Individual users may opt for single-user licenses, while businesses requiring broader access may choose multi-user or enterprise licenses for cost-effective access to the report.
13. Are there any additional resources or data provided in the Phosphoric Acid Industry report?
While the report offers comprehensive insights, it's advisable to review the specific contents or supplementary materials provided to ascertain if additional resources or data are available.
14. How can I stay updated on further developments or reports in the Phosphoric Acid Industry?
To stay informed about further developments, trends, and reports in the Phosphoric Acid Industry, consider subscribing to industry newsletters, following relevant companies and organizations, or regularly checking reputable industry news sources and publications.
Methodology
Step 1 - Identification of Relevant Samples Size from Population Database


Step 2 - Approaches for Defining Global Market Size (Value, Volume* & Price*)

Note*: In applicable scenarios
Step 3 - Data Sources
Primary Research
- Web Analytics
- Survey Reports
- Research Institute
- Latest Research Reports
- Opinion Leaders
Secondary Research
- Annual Reports
- White Paper
- Latest Press Release
- Industry Association
- Paid Database
- Investor Presentations

Step 4 - Data Triangulation
Involves using different sources of information in order to increase the validity of a study
These sources are likely to be stakeholders in a program - participants, other researchers, program staff, other community members, and so on.
Then we put all data in single framework & apply various statistical tools to find out the dynamic on the market.
During the analysis stage, feedback from the stakeholder groups would be compared to determine areas of agreement as well as areas of divergence