

Key Insights
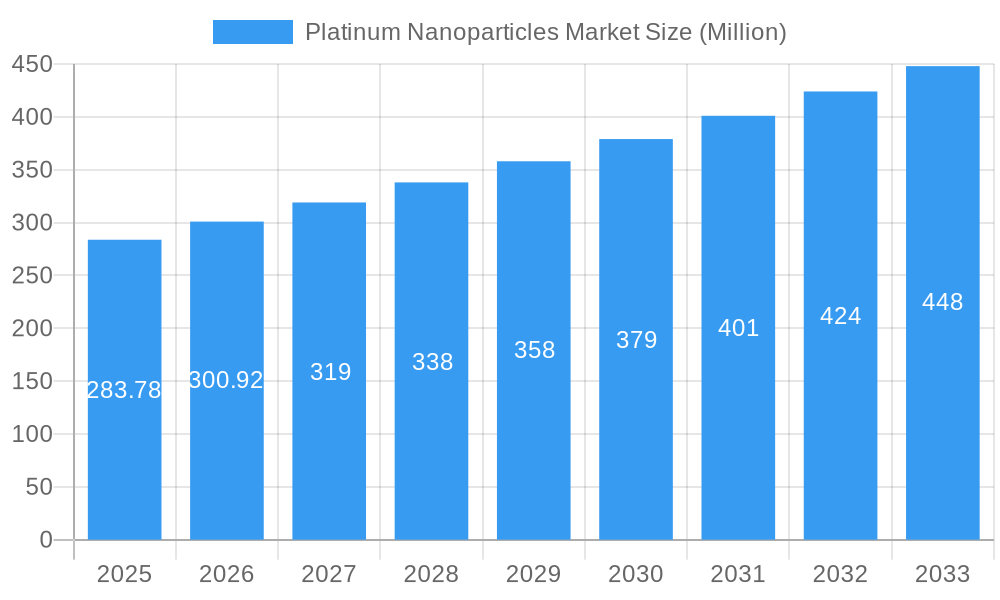
The Platinum Nanoparticles market, valued at $283.78 million in 2025, is projected to experience robust growth, driven by increasing applications across diverse sectors. A Compound Annual Growth Rate (CAGR) of 6% from 2025 to 2033 indicates a significant expansion of this market over the forecast period. Key drivers include the rising demand for platinum nanoparticles in the automotive industry for catalytic converters and sensors, and expanding applications in the healthcare sector for drug delivery and diagnostics. The chemical industry also contributes significantly to market growth, utilizing these nanoparticles in various chemical processes and catalysis. Spherical platinum nanoparticles currently dominate the product segment, followed by cubic and square shapes. North America and Europe are currently leading regional markets due to established infrastructure and a strong focus on research and development. However, the Asia-Pacific region is expected to witness significant growth fueled by expanding industrialization and rising disposable incomes. While challenges exist regarding the high cost of platinum and potential toxicity concerns, ongoing research and development efforts focused on cost-effective production and safer handling techniques are mitigating these restraints, fostering market expansion.
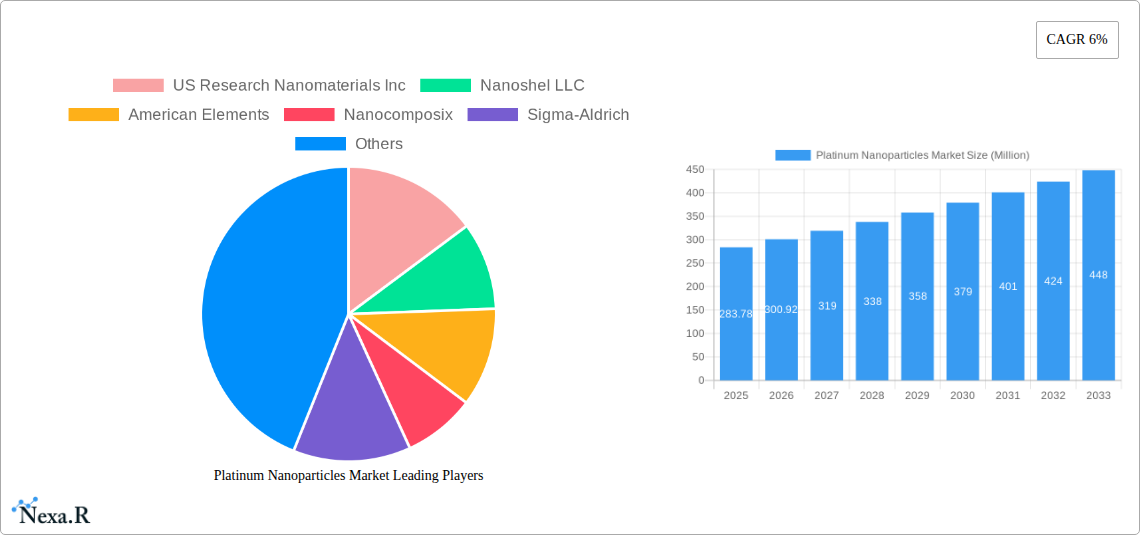
Platinum Nanoparticles Market Market Size (In Million)
The market segmentation reveals considerable opportunity for growth. The automotive industry's reliance on catalytic converters for emission control is a major driver, while advancements in nanomedicine are pushing the healthcare segment's demand. The chemical industry's utilization for specialized catalysts and chemical synthesis further contributes to overall growth. Competitive landscape analysis indicates a mix of established players like Sigma-Aldrich and emerging companies specializing in nanoparticle synthesis and modification. The ongoing innovation in synthesis methods, surface functionalization, and targeted applications are expected to influence market dynamics and create new avenues for growth within the platinum nanoparticles market throughout the forecast period. Future growth will depend on continued innovation in applications and the successful mitigation of cost and safety concerns.
Platinum Nanoparticles Market Company Market Share
Platinum Nanoparticles Market: A Comprehensive Report (2019-2033)
This in-depth report provides a comprehensive analysis of the Platinum Nanoparticles Market, encompassing market dynamics, growth trends, regional dominance, product landscape, key players, and future outlook. The report covers the period from 2019 to 2033, with 2025 serving as the base and estimated year. The parent market is the Nanomaterials market, and the child market is Platinum-based nanomaterials. The market size is projected to reach xx Million by 2033.
Platinum Nanoparticles Market Dynamics & Structure
The Platinum Nanoparticles market is characterized by moderate concentration, with key players holding significant market share. Technological innovation, particularly in synthesis techniques and surface functionalization, is a major driver. Stringent regulatory frameworks regarding nanomaterial safety influence market growth. Competitive substitutes include other noble metal nanoparticles (e.g., gold, palladium). End-user demographics are diverse, spanning various industries. M&A activity has been relatively modest in recent years, with approximately xx deals recorded between 2019 and 2024, representing a xx% market share change.
- Market Concentration: Moderately concentrated, with top 5 players holding xx% market share in 2024.
- Technological Innovation: Focus on enhancing catalytic activity, biocompatibility, and stability.
- Regulatory Landscape: Stringent regulations on nanomaterial safety and environmental impact.
- Competitive Substitutes: Gold, palladium, and other noble metal nanoparticles.
- End-User Demographics: Automotive, healthcare, chemical, and other industries.
- M&A Trends: Relatively low M&A activity, with xx deals recorded between 2019 and 2024.
- Innovation Barriers: High R&D costs, complex synthesis processes, and regulatory hurdles.
Platinum Nanoparticles Market Growth Trends & Insights
The Platinum Nanoparticles market experienced a CAGR of xx% during the historical period (2019-2024), driven by increasing demand from the automotive and healthcare sectors. Adoption rates are projected to increase steadily, fueled by technological advancements and rising awareness of the unique properties of platinum nanoparticles. Market penetration in key industries remains relatively low, indicating significant growth potential. Consumer behavior shifts towards sustainable and environmentally friendly technologies are further boosting demand. The market size is estimated at xx Million in 2025 and is projected to reach xx Million by 2033, exhibiting a CAGR of xx%. This growth is significantly influenced by increasing adoption in catalysis, biomedicine, and electronics.
Dominant Regions, Countries, or Segments in Platinum Nanoparticles Market
North America currently holds the largest market share, driven by strong R&D investments and a well-established healthcare sector. Within product segments, spherical platinum nanoparticles dominate due to their ease of synthesis and versatile applications. In end-user industries, the healthcare sector is exhibiting the fastest growth, fueled by the rising demand for drug delivery systems and diagnostic tools.
- Leading Region: North America (xx% market share in 2024).
- Leading Product Segment: Spherical nanoparticles (xx% market share in 2024).
- Fastest-Growing End-User Industry: Healthcare (xx% CAGR projected from 2025-2033).
- Key Drivers: Strong R&D investments, favorable regulatory environments, and increasing industrial applications.
- Dominance Factors: Established manufacturing base, technological advancements, and strong consumer demand.
Platinum Nanoparticles Market Product Landscape
Platinum nanoparticles are available in various shapes (spherical, cube, square, etc.) and sizes, each offering unique properties. Recent innovations focus on enhancing their catalytic activity, biocompatibility, and stability. Applications span catalysis, drug delivery, biosensors, and electronics. Key performance metrics include particle size distribution, surface area, and catalytic efficiency. Unique selling propositions revolve around improved performance and tailored functionalities for specific applications.
Key Drivers, Barriers & Challenges in Platinum Nanoparticles Market
Key Drivers: Increasing demand from automotive catalysts and the healthcare sector, advancements in synthesis techniques, and government initiatives promoting nanotechnology research.
Challenges: High cost of platinum, toxicity concerns, and stringent regulatory requirements. Supply chain disruptions due to geopolitical factors are causing price volatility and impacting availability, leading to an estimated xx% reduction in market growth in specific years.
Emerging Opportunities in Platinum Nanoparticles Market
Emerging applications in targeted drug delivery, advanced diagnostics, and sustainable energy technologies present significant growth opportunities. Untapped markets in developing economies also offer considerable potential. Evolving consumer preferences towards personalized medicine and environmentally friendly products are driving innovation.
Growth Accelerators in the Platinum Nanoparticles Market Industry
Technological advancements in synthesis and functionalization are key growth accelerators. Strategic partnerships between research institutions and industry players are fostering innovation. Expansion into new applications and markets, particularly in developing economies, will further propel market growth.
Key Players Shaping the Platinum Nanoparticles Market Market
- US Research Nanomaterials Inc
- Nanoshel LLC
- American Elements
- Nanocomposix
- Sigma-Aldrich
- NanoBio Chemicals India Pvt Ltd
- TANAKA HOLDINGS Co Ltd
- Nanostructured & Amorphous Materials Inc
- Metrohm India Limited
- HiQ-Nano s r l
- Strem Chemicals Inc
- PlasmaChem GmbH
- Meliorum Technologies Inc
- Particular GMBH
- NANOCHEMAZONE
Notable Milestones in Platinum Nanoparticles Market Sector
- 2021: Introduction of a novel platinum nanoparticle synthesis method by Nanocomposix, resulting in improved catalytic efficiency.
- 2022: Strategic partnership between Sigma-Aldrich and a leading pharmaceutical company to develop platinum nanoparticle-based drug delivery systems.
- 2023: Regulatory approval of a platinum nanoparticle-based diagnostic tool in the European Union.
In-Depth Platinum Nanoparticles Market Market Outlook
The Platinum Nanoparticles market is poised for significant growth over the forecast period (2025-2033), driven by technological advancements, expanding applications, and increasing government support. Strategic investments in R&D, collaborations, and market expansion initiatives will be crucial for success in this dynamic market. The market's future hinges on addressing toxicity concerns and navigating the complexities of regulatory frameworks.
Platinum Nanoparticles Market Segmentation
-
1. Product
- 1.1. Spherical
- 1.2. Cube
- 1.3. Square
- 1.4. Others
-
2. End-user Industry
- 2.1. Automotive
- 2.2. Health Care
- 2.3. Chemical
- 2.4. Others
Platinum Nanoparticles Market Segmentation By Geography
-
1. Asia Pacific
- 1.1. China
- 1.2. India
- 1.3. Japan
- 1.4. South Korea
- 1.5. Rest of Asia Pacific
-
2. North America
- 2.1. United States
- 2.2. Canada
- 2.3. Mexico
-
3. Europe
- 3.1. Germany
- 3.2. United Kingdom
- 3.3. France
- 3.4. Italy
- 3.5. Rest of Europe
-
4. South America
- 4.1. Brazil
- 4.2. Argentina
- 4.3. Rest of South America
-
5. Middle East and Africa
- 5.1. Saudi Arabia
- 5.2. South Africa
- 5.3. Rest of Middle East and Africa
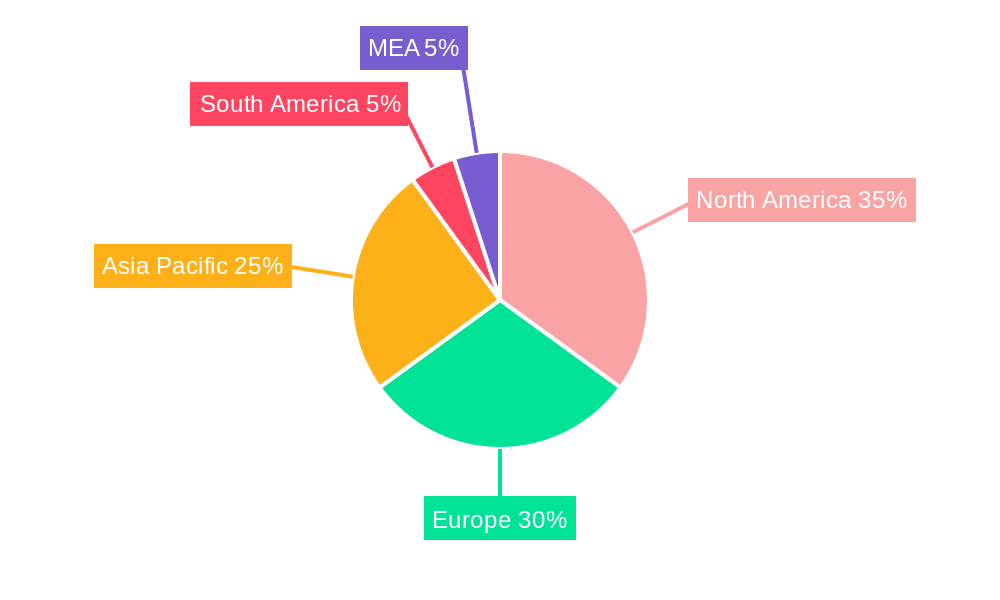
Platinum Nanoparticles Market Regional Market Share
Geographic Coverage of Platinum Nanoparticles Market
Platinum Nanoparticles Market REPORT HIGHLIGHTS
| Aspects | Details |
|---|---|
| Study Period | 2020-2034 |
| Base Year | 2025 |
| Estimated Year | 2026 |
| Forecast Period | 2026-2034 |
| Historical Period | 2020-2025 |
| Growth Rate | CAGR of 6% from 2020-2034 |
| Segmentation |
|
Table of Contents
- 1. Introduction
- 1.1. Research Scope
- 1.2. Market Segmentation
- 1.3. Research Objective
- 1.4. Definitions and Assumptions
- 2. Executive Summary
- 2.1. Market Snapshot
- 3. Market Dynamics
- 3.1. Market Drivers
- 3.2. Market Restrains
- 3.3. Market Trends
- 3.4. Market Opportunities
- 4. Market Factor Analysis
- 4.1. Porters Five Forces
- 4.1.1. Bargaining Power of Suppliers
- 4.1.2. Bargaining Power of Buyers
- 4.1.3. Threat of New Entrants
- 4.1.4. Threat of Substitutes
- 4.1.5. Competitive Rivalry
- 4.2. PESTEL analysis
- 4.3. BCG Analysis
- 4.3.1. Stars (High Growth, High Market Share)
- 4.3.2. Cash Cows (Low Growth, High Market Share)
- 4.3.3. Question Mark (High Growth, Low Market Share)
- 4.3.4. Dogs (Low Growth, Low Market Share)
- 4.4. Ansoff Matrix Analysis
- 4.5. Supply Chain Analysis
- 4.6. Regulatory Landscape
- 4.7. Current Market Potential and Opportunity Assessment (TAM–SAM–SOM Framework)
- 4.8. NRP Analyst Note
- 4.1. Porters Five Forces
- 5. Market Analysis, Insights and Forecast 2021-2033
- 5.1. Market Analysis, Insights and Forecast - by Product
- 5.1.1. Spherical
- 5.1.2. Cube
- 5.1.3. Square
- 5.1.4. Others
- 5.2. Market Analysis, Insights and Forecast - by End-user Industry
- 5.2.1. Automotive
- 5.2.2. Health Care
- 5.2.3. Chemical
- 5.2.4. Others
- 5.3. Market Analysis, Insights and Forecast - by Region
- 5.3.1. Asia Pacific
- 5.3.2. North America
- 5.3.3. Europe
- 5.3.4. South America
- 5.3.5. Middle East and Africa
- 5.1. Market Analysis, Insights and Forecast - by Product
- 6. Global Platinum Nanoparticles Market Analysis, Insights and Forecast, 2021-2033
- 6.1. Market Analysis, Insights and Forecast - by Product
- 6.1.1. Spherical
- 6.1.2. Cube
- 6.1.3. Square
- 6.1.4. Others
- 6.2. Market Analysis, Insights and Forecast - by End-user Industry
- 6.2.1. Automotive
- 6.2.2. Health Care
- 6.2.3. Chemical
- 6.2.4. Others
- 6.1. Market Analysis, Insights and Forecast - by Product
- 7. Asia Pacific Platinum Nanoparticles Market Analysis, Insights and Forecast, 2020-2032
- 7.1. Market Analysis, Insights and Forecast - by Product
- 7.1.1. Spherical
- 7.1.2. Cube
- 7.1.3. Square
- 7.1.4. Others
- 7.2. Market Analysis, Insights and Forecast - by End-user Industry
- 7.2.1. Automotive
- 7.2.2. Health Care
- 7.2.3. Chemical
- 7.2.4. Others
- 7.1. Market Analysis, Insights and Forecast - by Product
- 8. North America Platinum Nanoparticles Market Analysis, Insights and Forecast, 2020-2032
- 8.1. Market Analysis, Insights and Forecast - by Product
- 8.1.1. Spherical
- 8.1.2. Cube
- 8.1.3. Square
- 8.1.4. Others
- 8.2. Market Analysis, Insights and Forecast - by End-user Industry
- 8.2.1. Automotive
- 8.2.2. Health Care
- 8.2.3. Chemical
- 8.2.4. Others
- 8.1. Market Analysis, Insights and Forecast - by Product
- 9. Europe Platinum Nanoparticles Market Analysis, Insights and Forecast, 2020-2032
- 9.1. Market Analysis, Insights and Forecast - by Product
- 9.1.1. Spherical
- 9.1.2. Cube
- 9.1.3. Square
- 9.1.4. Others
- 9.2. Market Analysis, Insights and Forecast - by End-user Industry
- 9.2.1. Automotive
- 9.2.2. Health Care
- 9.2.3. Chemical
- 9.2.4. Others
- 9.1. Market Analysis, Insights and Forecast - by Product
- 10. South America Platinum Nanoparticles Market Analysis, Insights and Forecast, 2020-2032
- 10.1. Market Analysis, Insights and Forecast - by Product
- 10.1.1. Spherical
- 10.1.2. Cube
- 10.1.3. Square
- 10.1.4. Others
- 10.2. Market Analysis, Insights and Forecast - by End-user Industry
- 10.2.1. Automotive
- 10.2.2. Health Care
- 10.2.3. Chemical
- 10.2.4. Others
- 10.1. Market Analysis, Insights and Forecast - by Product
- 11. Middle East and Africa Platinum Nanoparticles Market Analysis, Insights and Forecast, 2020-2032
- 11.1. Market Analysis, Insights and Forecast - by Product
- 11.1.1. Spherical
- 11.1.2. Cube
- 11.1.3. Square
- 11.1.4. Others
- 11.2. Market Analysis, Insights and Forecast - by End-user Industry
- 11.2.1. Automotive
- 11.2.2. Health Care
- 11.2.3. Chemical
- 11.2.4. Others
- 11.1. Market Analysis, Insights and Forecast - by Product
- 12. Competitive Analysis
- 12.1. Company Profiles
- 12.1.1 US Research Nanomaterials Inc
- 12.1.1.1. Company Overview
- 12.1.1.2. Products
- 12.1.1.3. Company Financials
- 12.1.1.4. SWOT Analysis
- 12.1.2 Nanoshel LLC
- 12.1.2.1. Company Overview
- 12.1.2.2. Products
- 12.1.2.3. Company Financials
- 12.1.2.4. SWOT Analysis
- 12.1.3 American Elements
- 12.1.3.1. Company Overview
- 12.1.3.2. Products
- 12.1.3.3. Company Financials
- 12.1.3.4. SWOT Analysis
- 12.1.4 Nanocomposix
- 12.1.4.1. Company Overview
- 12.1.4.2. Products
- 12.1.4.3. Company Financials
- 12.1.4.4. SWOT Analysis
- 12.1.5 Sigma-Aldrich
- 12.1.5.1. Company Overview
- 12.1.5.2. Products
- 12.1.5.3. Company Financials
- 12.1.5.4. SWOT Analysis
- 12.1.6 NanoBio Chemicals India Pvt Ltd
- 12.1.6.1. Company Overview
- 12.1.6.2. Products
- 12.1.6.3. Company Financials
- 12.1.6.4. SWOT Analysis
- 12.1.7 TANAKA HOLDINGS Co Ltd
- 12.1.7.1. Company Overview
- 12.1.7.2. Products
- 12.1.7.3. Company Financials
- 12.1.7.4. SWOT Analysis
- 12.1.8 Nanostructured & Amorphous Materials Inc
- 12.1.8.1. Company Overview
- 12.1.8.2. Products
- 12.1.8.3. Company Financials
- 12.1.8.4. SWOT Analysis
- 12.1.9 Metrohm India Limited
- 12.1.9.1. Company Overview
- 12.1.9.2. Products
- 12.1.9.3. Company Financials
- 12.1.9.4. SWOT Analysis
- 12.1.10 HiQ-Nano s r l
- 12.1.10.1. Company Overview
- 12.1.10.2. Products
- 12.1.10.3. Company Financials
- 12.1.10.4. SWOT Analysis
- 12.1.11 Strem Chemicals Inc
- 12.1.11.1. Company Overview
- 12.1.11.2. Products
- 12.1.11.3. Company Financials
- 12.1.11.4. SWOT Analysis
- 12.1.12 PlasmaChem GmbH
- 12.1.12.1. Company Overview
- 12.1.12.2. Products
- 12.1.12.3. Company Financials
- 12.1.12.4. SWOT Analysis
- 12.1.13 Meliorum Technologies Inc
- 12.1.13.1. Company Overview
- 12.1.13.2. Products
- 12.1.13.3. Company Financials
- 12.1.13.4. SWOT Analysis
- 12.1.14 Particular GMBH
- 12.1.14.1. Company Overview
- 12.1.14.2. Products
- 12.1.14.3. Company Financials
- 12.1.14.4. SWOT Analysis
- 12.1.15 NANOCHEMAZONE
- 12.1.15.1. Company Overview
- 12.1.15.2. Products
- 12.1.15.3. Company Financials
- 12.1.15.4. SWOT Analysis
- 12.1.1 US Research Nanomaterials Inc
- 12.2. Market Entropy
- 12.2.1 Company's Key Areas Served
- 12.2.2 Recent Developments
- 12.3. Company Market Share Analysis 2025
- 12.3.1 Top 5 Companies Market Share Analysis
- 12.3.2 Top 3 Companies Market Share Analysis
- 12.4. List of Potential Customers
- 13. Research Methodology
List of Figures
- Figure 1: Global Platinum Nanoparticles Market Revenue Breakdown (Million, %) by Region 2025 & 2033
- Figure 2: Global Platinum Nanoparticles Market Volume Breakdown (K Tons, %) by Region 2025 & 2033
- Figure 3: Asia Pacific Platinum Nanoparticles Market Revenue (Million), by Product 2025 & 2033
- Figure 4: Asia Pacific Platinum Nanoparticles Market Volume (K Tons), by Product 2025 & 2033
- Figure 5: Asia Pacific Platinum Nanoparticles Market Revenue Share (%), by Product 2025 & 2033
- Figure 6: Asia Pacific Platinum Nanoparticles Market Volume Share (%), by Product 2025 & 2033
- Figure 7: Asia Pacific Platinum Nanoparticles Market Revenue (Million), by End-user Industry 2025 & 2033
- Figure 8: Asia Pacific Platinum Nanoparticles Market Volume (K Tons), by End-user Industry 2025 & 2033
- Figure 9: Asia Pacific Platinum Nanoparticles Market Revenue Share (%), by End-user Industry 2025 & 2033
- Figure 10: Asia Pacific Platinum Nanoparticles Market Volume Share (%), by End-user Industry 2025 & 2033
- Figure 11: Asia Pacific Platinum Nanoparticles Market Revenue (Million), by Country 2025 & 2033
- Figure 12: Asia Pacific Platinum Nanoparticles Market Volume (K Tons), by Country 2025 & 2033
- Figure 13: Asia Pacific Platinum Nanoparticles Market Revenue Share (%), by Country 2025 & 2033
- Figure 14: Asia Pacific Platinum Nanoparticles Market Volume Share (%), by Country 2025 & 2033
- Figure 15: North America Platinum Nanoparticles Market Revenue (Million), by Product 2025 & 2033
- Figure 16: North America Platinum Nanoparticles Market Volume (K Tons), by Product 2025 & 2033
- Figure 17: North America Platinum Nanoparticles Market Revenue Share (%), by Product 2025 & 2033
- Figure 18: North America Platinum Nanoparticles Market Volume Share (%), by Product 2025 & 2033
- Figure 19: North America Platinum Nanoparticles Market Revenue (Million), by End-user Industry 2025 & 2033
- Figure 20: North America Platinum Nanoparticles Market Volume (K Tons), by End-user Industry 2025 & 2033
- Figure 21: North America Platinum Nanoparticles Market Revenue Share (%), by End-user Industry 2025 & 2033
- Figure 22: North America Platinum Nanoparticles Market Volume Share (%), by End-user Industry 2025 & 2033
- Figure 23: North America Platinum Nanoparticles Market Revenue (Million), by Country 2025 & 2033
- Figure 24: North America Platinum Nanoparticles Market Volume (K Tons), by Country 2025 & 2033
- Figure 25: North America Platinum Nanoparticles Market Revenue Share (%), by Country 2025 & 2033
- Figure 26: North America Platinum Nanoparticles Market Volume Share (%), by Country 2025 & 2033
- Figure 27: Europe Platinum Nanoparticles Market Revenue (Million), by Product 2025 & 2033
- Figure 28: Europe Platinum Nanoparticles Market Volume (K Tons), by Product 2025 & 2033
- Figure 29: Europe Platinum Nanoparticles Market Revenue Share (%), by Product 2025 & 2033
- Figure 30: Europe Platinum Nanoparticles Market Volume Share (%), by Product 2025 & 2033
- Figure 31: Europe Platinum Nanoparticles Market Revenue (Million), by End-user Industry 2025 & 2033
- Figure 32: Europe Platinum Nanoparticles Market Volume (K Tons), by End-user Industry 2025 & 2033
- Figure 33: Europe Platinum Nanoparticles Market Revenue Share (%), by End-user Industry 2025 & 2033
- Figure 34: Europe Platinum Nanoparticles Market Volume Share (%), by End-user Industry 2025 & 2033
- Figure 35: Europe Platinum Nanoparticles Market Revenue (Million), by Country 2025 & 2033
- Figure 36: Europe Platinum Nanoparticles Market Volume (K Tons), by Country 2025 & 2033
- Figure 37: Europe Platinum Nanoparticles Market Revenue Share (%), by Country 2025 & 2033
- Figure 38: Europe Platinum Nanoparticles Market Volume Share (%), by Country 2025 & 2033
- Figure 39: South America Platinum Nanoparticles Market Revenue (Million), by Product 2025 & 2033
- Figure 40: South America Platinum Nanoparticles Market Volume (K Tons), by Product 2025 & 2033
- Figure 41: South America Platinum Nanoparticles Market Revenue Share (%), by Product 2025 & 2033
- Figure 42: South America Platinum Nanoparticles Market Volume Share (%), by Product 2025 & 2033
- Figure 43: South America Platinum Nanoparticles Market Revenue (Million), by End-user Industry 2025 & 2033
- Figure 44: South America Platinum Nanoparticles Market Volume (K Tons), by End-user Industry 2025 & 2033
- Figure 45: South America Platinum Nanoparticles Market Revenue Share (%), by End-user Industry 2025 & 2033
- Figure 46: South America Platinum Nanoparticles Market Volume Share (%), by End-user Industry 2025 & 2033
- Figure 47: South America Platinum Nanoparticles Market Revenue (Million), by Country 2025 & 2033
- Figure 48: South America Platinum Nanoparticles Market Volume (K Tons), by Country 2025 & 2033
- Figure 49: South America Platinum Nanoparticles Market Revenue Share (%), by Country 2025 & 2033
- Figure 50: South America Platinum Nanoparticles Market Volume Share (%), by Country 2025 & 2033
- Figure 51: Middle East and Africa Platinum Nanoparticles Market Revenue (Million), by Product 2025 & 2033
- Figure 52: Middle East and Africa Platinum Nanoparticles Market Volume (K Tons), by Product 2025 & 2033
- Figure 53: Middle East and Africa Platinum Nanoparticles Market Revenue Share (%), by Product 2025 & 2033
- Figure 54: Middle East and Africa Platinum Nanoparticles Market Volume Share (%), by Product 2025 & 2033
- Figure 55: Middle East and Africa Platinum Nanoparticles Market Revenue (Million), by End-user Industry 2025 & 2033
- Figure 56: Middle East and Africa Platinum Nanoparticles Market Volume (K Tons), by End-user Industry 2025 & 2033
- Figure 57: Middle East and Africa Platinum Nanoparticles Market Revenue Share (%), by End-user Industry 2025 & 2033
- Figure 58: Middle East and Africa Platinum Nanoparticles Market Volume Share (%), by End-user Industry 2025 & 2033
- Figure 59: Middle East and Africa Platinum Nanoparticles Market Revenue (Million), by Country 2025 & 2033
- Figure 60: Middle East and Africa Platinum Nanoparticles Market Volume (K Tons), by Country 2025 & 2033
- Figure 61: Middle East and Africa Platinum Nanoparticles Market Revenue Share (%), by Country 2025 & 2033
- Figure 62: Middle East and Africa Platinum Nanoparticles Market Volume Share (%), by Country 2025 & 2033
List of Tables
- Table 1: Global Platinum Nanoparticles Market Revenue Million Forecast, by Product 2020 & 2033
- Table 2: Global Platinum Nanoparticles Market Volume K Tons Forecast, by Product 2020 & 2033
- Table 3: Global Platinum Nanoparticles Market Revenue Million Forecast, by End-user Industry 2020 & 2033
- Table 4: Global Platinum Nanoparticles Market Volume K Tons Forecast, by End-user Industry 2020 & 2033
- Table 5: Global Platinum Nanoparticles Market Revenue Million Forecast, by Region 2020 & 2033
- Table 6: Global Platinum Nanoparticles Market Volume K Tons Forecast, by Region 2020 & 2033
- Table 7: Global Platinum Nanoparticles Market Revenue Million Forecast, by Product 2020 & 2033
- Table 8: Global Platinum Nanoparticles Market Volume K Tons Forecast, by Product 2020 & 2033
- Table 9: Global Platinum Nanoparticles Market Revenue Million Forecast, by End-user Industry 2020 & 2033
- Table 10: Global Platinum Nanoparticles Market Volume K Tons Forecast, by End-user Industry 2020 & 2033
- Table 11: Global Platinum Nanoparticles Market Revenue Million Forecast, by Country 2020 & 2033
- Table 12: Global Platinum Nanoparticles Market Volume K Tons Forecast, by Country 2020 & 2033
- Table 13: China Platinum Nanoparticles Market Revenue (Million) Forecast, by Application 2020 & 2033
- Table 14: China Platinum Nanoparticles Market Volume (K Tons) Forecast, by Application 2020 & 2033
- Table 15: India Platinum Nanoparticles Market Revenue (Million) Forecast, by Application 2020 & 2033
- Table 16: India Platinum Nanoparticles Market Volume (K Tons) Forecast, by Application 2020 & 2033
- Table 17: Japan Platinum Nanoparticles Market Revenue (Million) Forecast, by Application 2020 & 2033
- Table 18: Japan Platinum Nanoparticles Market Volume (K Tons) Forecast, by Application 2020 & 2033
- Table 19: South Korea Platinum Nanoparticles Market Revenue (Million) Forecast, by Application 2020 & 2033
- Table 20: South Korea Platinum Nanoparticles Market Volume (K Tons) Forecast, by Application 2020 & 2033
- Table 21: Rest of Asia Pacific Platinum Nanoparticles Market Revenue (Million) Forecast, by Application 2020 & 2033
- Table 22: Rest of Asia Pacific Platinum Nanoparticles Market Volume (K Tons) Forecast, by Application 2020 & 2033
- Table 23: Global Platinum Nanoparticles Market Revenue Million Forecast, by Product 2020 & 2033
- Table 24: Global Platinum Nanoparticles Market Volume K Tons Forecast, by Product 2020 & 2033
- Table 25: Global Platinum Nanoparticles Market Revenue Million Forecast, by End-user Industry 2020 & 2033
- Table 26: Global Platinum Nanoparticles Market Volume K Tons Forecast, by End-user Industry 2020 & 2033
- Table 27: Global Platinum Nanoparticles Market Revenue Million Forecast, by Country 2020 & 2033
- Table 28: Global Platinum Nanoparticles Market Volume K Tons Forecast, by Country 2020 & 2033
- Table 29: United States Platinum Nanoparticles Market Revenue (Million) Forecast, by Application 2020 & 2033
- Table 30: United States Platinum Nanoparticles Market Volume (K Tons) Forecast, by Application 2020 & 2033
- Table 31: Canada Platinum Nanoparticles Market Revenue (Million) Forecast, by Application 2020 & 2033
- Table 32: Canada Platinum Nanoparticles Market Volume (K Tons) Forecast, by Application 2020 & 2033
- Table 33: Mexico Platinum Nanoparticles Market Revenue (Million) Forecast, by Application 2020 & 2033
- Table 34: Mexico Platinum Nanoparticles Market Volume (K Tons) Forecast, by Application 2020 & 2033
- Table 35: Global Platinum Nanoparticles Market Revenue Million Forecast, by Product 2020 & 2033
- Table 36: Global Platinum Nanoparticles Market Volume K Tons Forecast, by Product 2020 & 2033
- Table 37: Global Platinum Nanoparticles Market Revenue Million Forecast, by End-user Industry 2020 & 2033
- Table 38: Global Platinum Nanoparticles Market Volume K Tons Forecast, by End-user Industry 2020 & 2033
- Table 39: Global Platinum Nanoparticles Market Revenue Million Forecast, by Country 2020 & 2033
- Table 40: Global Platinum Nanoparticles Market Volume K Tons Forecast, by Country 2020 & 2033
- Table 41: Germany Platinum Nanoparticles Market Revenue (Million) Forecast, by Application 2020 & 2033
- Table 42: Germany Platinum Nanoparticles Market Volume (K Tons) Forecast, by Application 2020 & 2033
- Table 43: United Kingdom Platinum Nanoparticles Market Revenue (Million) Forecast, by Application 2020 & 2033
- Table 44: United Kingdom Platinum Nanoparticles Market Volume (K Tons) Forecast, by Application 2020 & 2033
- Table 45: France Platinum Nanoparticles Market Revenue (Million) Forecast, by Application 2020 & 2033
- Table 46: France Platinum Nanoparticles Market Volume (K Tons) Forecast, by Application 2020 & 2033
- Table 47: Italy Platinum Nanoparticles Market Revenue (Million) Forecast, by Application 2020 & 2033
- Table 48: Italy Platinum Nanoparticles Market Volume (K Tons) Forecast, by Application 2020 & 2033
- Table 49: Rest of Europe Platinum Nanoparticles Market Revenue (Million) Forecast, by Application 2020 & 2033
- Table 50: Rest of Europe Platinum Nanoparticles Market Volume (K Tons) Forecast, by Application 2020 & 2033
- Table 51: Global Platinum Nanoparticles Market Revenue Million Forecast, by Product 2020 & 2033
- Table 52: Global Platinum Nanoparticles Market Volume K Tons Forecast, by Product 2020 & 2033
- Table 53: Global Platinum Nanoparticles Market Revenue Million Forecast, by End-user Industry 2020 & 2033
- Table 54: Global Platinum Nanoparticles Market Volume K Tons Forecast, by End-user Industry 2020 & 2033
- Table 55: Global Platinum Nanoparticles Market Revenue Million Forecast, by Country 2020 & 2033
- Table 56: Global Platinum Nanoparticles Market Volume K Tons Forecast, by Country 2020 & 2033
- Table 57: Brazil Platinum Nanoparticles Market Revenue (Million) Forecast, by Application 2020 & 2033
- Table 58: Brazil Platinum Nanoparticles Market Volume (K Tons) Forecast, by Application 2020 & 2033
- Table 59: Argentina Platinum Nanoparticles Market Revenue (Million) Forecast, by Application 2020 & 2033
- Table 60: Argentina Platinum Nanoparticles Market Volume (K Tons) Forecast, by Application 2020 & 2033
- Table 61: Rest of South America Platinum Nanoparticles Market Revenue (Million) Forecast, by Application 2020 & 2033
- Table 62: Rest of South America Platinum Nanoparticles Market Volume (K Tons) Forecast, by Application 2020 & 2033
- Table 63: Global Platinum Nanoparticles Market Revenue Million Forecast, by Product 2020 & 2033
- Table 64: Global Platinum Nanoparticles Market Volume K Tons Forecast, by Product 2020 & 2033
- Table 65: Global Platinum Nanoparticles Market Revenue Million Forecast, by End-user Industry 2020 & 2033
- Table 66: Global Platinum Nanoparticles Market Volume K Tons Forecast, by End-user Industry 2020 & 2033
- Table 67: Global Platinum Nanoparticles Market Revenue Million Forecast, by Country 2020 & 2033
- Table 68: Global Platinum Nanoparticles Market Volume K Tons Forecast, by Country 2020 & 2033
- Table 69: Saudi Arabia Platinum Nanoparticles Market Revenue (Million) Forecast, by Application 2020 & 2033
- Table 70: Saudi Arabia Platinum Nanoparticles Market Volume (K Tons) Forecast, by Application 2020 & 2033
- Table 71: South Africa Platinum Nanoparticles Market Revenue (Million) Forecast, by Application 2020 & 2033
- Table 72: South Africa Platinum Nanoparticles Market Volume (K Tons) Forecast, by Application 2020 & 2033
- Table 73: Rest of Middle East and Africa Platinum Nanoparticles Market Revenue (Million) Forecast, by Application 2020 & 2033
- Table 74: Rest of Middle East and Africa Platinum Nanoparticles Market Volume (K Tons) Forecast, by Application 2020 & 2033
Frequently Asked Questions
1. What is the projected Compound Annual Growth Rate (CAGR) of the Platinum Nanoparticles Market?
The projected CAGR is approximately 6%.
2. Which companies are prominent players in the Platinum Nanoparticles Market?
Key companies in the market include US Research Nanomaterials Inc, Nanoshel LLC, American Elements, Nanocomposix, Sigma-Aldrich, NanoBio Chemicals India Pvt Ltd, TANAKA HOLDINGS Co Ltd, Nanostructured & Amorphous Materials Inc, Metrohm India Limited, HiQ-Nano s r l, Strem Chemicals Inc, PlasmaChem GmbH, Meliorum Technologies Inc, Particular GMBH, NANOCHEMAZONE.
3. What are the main segments of the Platinum Nanoparticles Market?
The market segments include Product, End-user Industry.
4. Can you provide details about the market size?
The market size is estimated to be USD 283.78 Million as of 2022.
5. What are some drivers contributing to market growth?
; Growing Health Care Industry; Other Drivers.
6. What are the notable trends driving market growth?
Health Care Segment to Dominate the Market.
7. Are there any restraints impacting market growth?
; Toxic Nature of Platinum Nanoparticles; Unfavorable Conditions in Non-medical End-user Industries Arising Due to COVID-19 Outbreak.
8. Can you provide examples of recent developments in the market?
N/A
9. What pricing options are available for accessing the report?
Pricing options include single-user, multi-user, and enterprise licenses priced at USD 4750, USD 5250, and USD 8750 respectively.
10. Is the market size provided in terms of value or volume?
The market size is provided in terms of value, measured in Million and volume, measured in K Tons.
11. Are there any specific market keywords associated with the report?
Yes, the market keyword associated with the report is "Platinum Nanoparticles Market," which aids in identifying and referencing the specific market segment covered.
12. How do I determine which pricing option suits my needs best?
The pricing options vary based on user requirements and access needs. Individual users may opt for single-user licenses, while businesses requiring broader access may choose multi-user or enterprise licenses for cost-effective access to the report.
13. Are there any additional resources or data provided in the Platinum Nanoparticles Market report?
While the report offers comprehensive insights, it's advisable to review the specific contents or supplementary materials provided to ascertain if additional resources or data are available.
14. How can I stay updated on further developments or reports in the Platinum Nanoparticles Market?
To stay informed about further developments, trends, and reports in the Platinum Nanoparticles Market, consider subscribing to industry newsletters, following relevant companies and organizations, or regularly checking reputable industry news sources and publications.
Methodology
Step 1 - Identification of Relevant Samples Size from Population Database


Step 2 - Approaches for Defining Global Market Size (Value, Volume* & Price*)

Note*: In applicable scenarios
Step 3 - Data Sources
Primary Research
- Web Analytics
- Survey Reports
- Research Institute
- Latest Research Reports
- Opinion Leaders
Secondary Research
- Annual Reports
- White Paper
- Latest Press Release
- Industry Association
- Paid Database
- Investor Presentations

Step 4 - Data Triangulation
Involves using different sources of information in order to increase the validity of a study
These sources are likely to be stakeholders in a program - participants, other researchers, program staff, other community members, and so on.
Then we put all data in single framework & apply various statistical tools to find out the dynamic on the market.
During the analysis stage, feedback from the stakeholder groups would be compared to determine areas of agreement as well as areas of divergence