

Key Insights
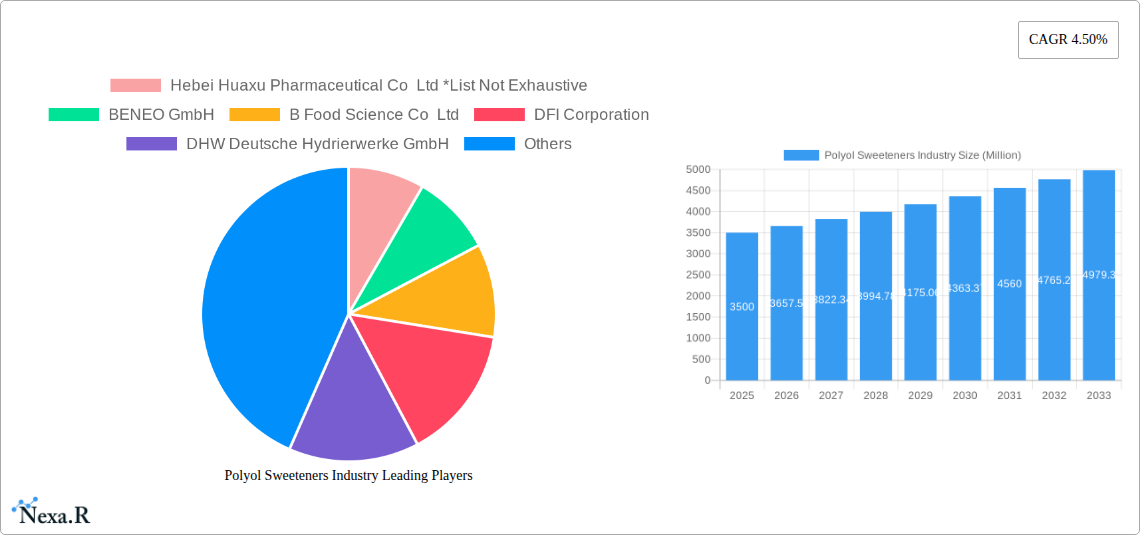
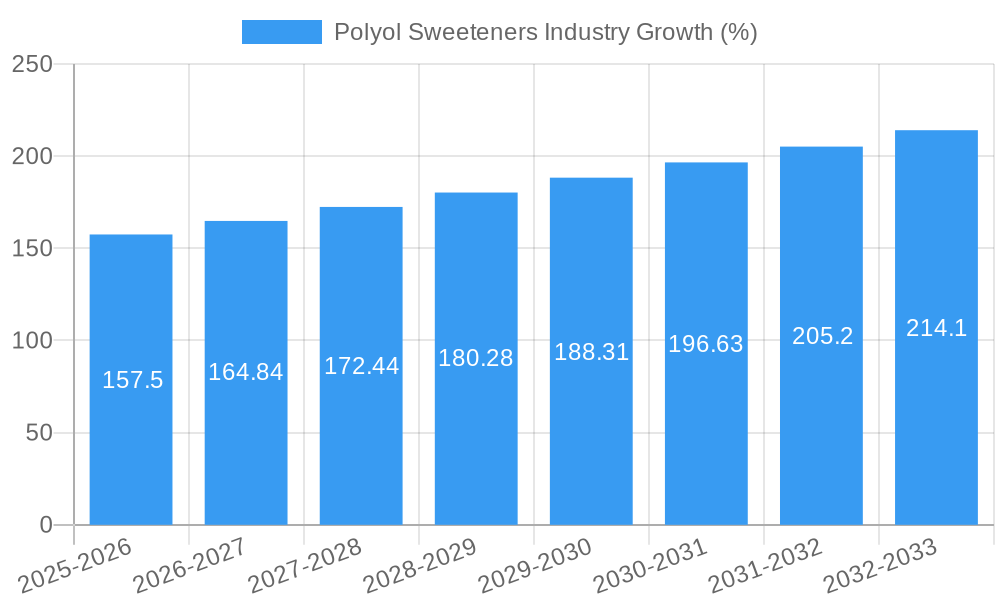
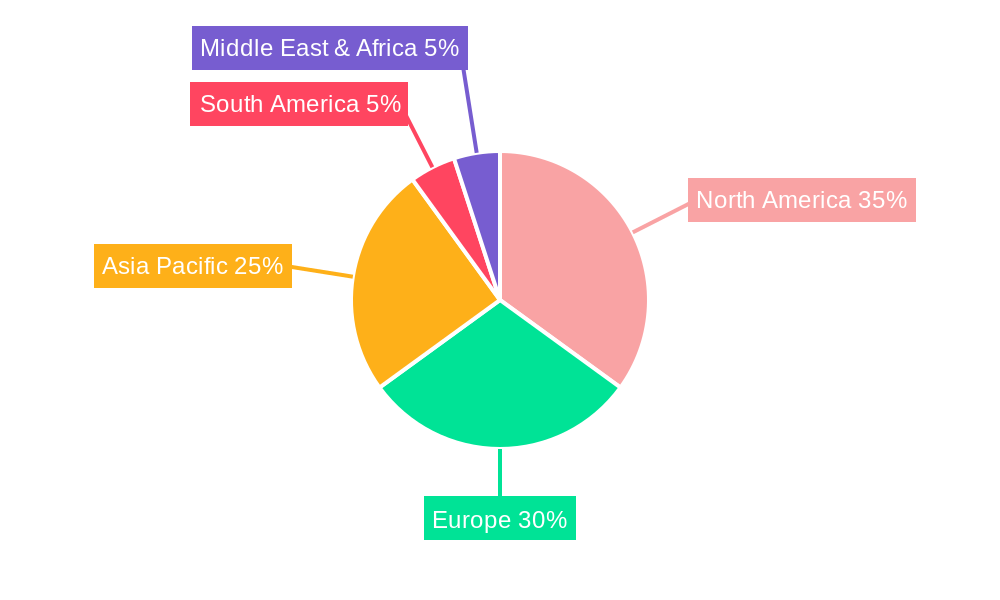
The global polyol sweeteners market, valued at $3.5 billion in 2025, is projected to experience steady growth, driven by increasing consumer demand for healthier alternatives to traditional sugars. The compound annual growth rate (CAGR) of 4.5% from 2025 to 2033 indicates a substantial market expansion, reaching an estimated value exceeding $5 billion by 2033. Key drivers include the rising prevalence of diabetes and related health concerns, coupled with the growing awareness of the negative impacts of high-sugar diets. The food and beverage industry remains the dominant application segment, fueled by the incorporation of polyol sweeteners in a wide range of products, including confectionery, baked goods, and beverages. Erythritol and sorbitol are currently the leading polyol types, owing to their widespread availability and relatively lower cost compared to other options like isomalt and maltitol. However, the market is witnessing a surge in demand for other specialized polyol types, driven by the development of novel food products with enhanced texture and functionality. Growth is further supported by increasing innovations in formulations and technological advancements in polyol production, addressing concerns around potential digestive issues associated with some polyol sweeteners. Regional variations exist; North America and Europe currently hold significant market shares, but the Asia-Pacific region is expected to witness the fastest growth in the coming years due to rapid economic development and changing dietary preferences.
Regulatory factors and potential price fluctuations of raw materials pose challenges to market expansion. Competition amongst major players including Cargill, Ingredion, Roquette, and BENEO, necessitates strategic pricing and product differentiation. Companies are focusing on developing high-quality, functional polyol sweeteners, exploring novel applications beyond traditional food and beverages, including pharmaceuticals and personal care products. This diversification will be crucial in sustaining market growth and enhancing profitability amidst intensified competition. The increasing demand for natural and organic sweeteners may also influence future market trends, prompting manufacturers to adopt sustainable sourcing and production practices to satisfy the growing consumer preference for environmentally conscious products. Continued research and development in polyol sweeteners will play a vital role in shaping the market's future landscape.
Polyol Sweeteners Industry Market Report: 2019-2033
This comprehensive report provides a detailed analysis of the Polyol Sweeteners market, encompassing historical data (2019-2024), current estimates (2025), and future forecasts (2025-2033). It delves into market dynamics, growth trends, regional segmentation (by type and application), competitive landscape, and future opportunities within the broader food and beverage, pharmaceutical, and personal care industries. This in-depth study is an essential resource for industry professionals, investors, and strategic decision-makers seeking to navigate this dynamic market.
Polyol Sweeteners Industry Market Dynamics & Structure
The global polyol sweeteners market is characterized by a moderately concentrated structure with key players holding significant market shares. Technological innovation, particularly in the development of novel polyols with improved functionalities and reduced caloric content, is a major driver. Stringent regulatory frameworks concerning food additives and health claims influence product development and marketing strategies. Competitive pressure from alternative sweeteners, such as stevia and monk fruit, necessitates continuous innovation. The end-user demographics are diverse, encompassing food and beverage manufacturers, pharmaceutical companies, and personal care brands. Mergers and acquisitions (M&A) activity has been relatively consistent, with larger players consolidating market share through strategic acquisitions of smaller businesses.
- Market Concentration: Moderately concentrated, with top 5 players holding approximately xx% market share in 2025.
- Technological Innovation: Focus on developing healthier, functional polyols with improved taste and texture profiles.
- Regulatory Landscape: Stringent regulations regarding labeling, safety, and health claims influence market dynamics.
- Competitive Substitutes: Growing competition from alternative natural sweeteners (e.g., stevia, monk fruit).
- M&A Activity: Consistent M&A activity, with xx major deals recorded between 2019 and 2024.
- Innovation Barriers: High R&D costs and stringent regulatory approvals present challenges for new product development.
Polyol Sweeteners Industry Growth Trends & Insights
The global polyol sweeteners market exhibited robust growth during the historical period (2019-2024), driven by increasing demand for healthier and low-calorie alternatives to traditional sugars. The market size reached xx million units in 2024 and is projected to reach xx million units by 2025, showcasing a CAGR of xx% during the forecast period (2025-2033). This growth is fueled by rising consumer awareness of health and wellness, coupled with the growing prevalence of obesity and diabetes globally. Technological advancements in polyol production and application have further stimulated market expansion. Changes in consumer preferences towards natural and functional ingredients also contribute to market growth. The increasing adoption of polyols in the food and beverage sector, driven by their functional properties and taste profiles, is a key factor driving market expansion.
Dominant Regions, Countries, or Segments in Polyol Sweeteners Industry
North America and Europe currently dominate the polyol sweeteners market, driven by high consumer demand for healthy food and beverage products and strong regulatory frameworks supporting the use of these sweeteners. However, Asia-Pacific is expected to witness substantial growth during the forecast period, fueled by rising disposable incomes and changing dietary habits.
By Type:
- Sorbitol: Remains the leading segment, driven by its widespread use in confectionery and pharmaceutical applications.
- Erythritol: Growing popularity due to its low-calorie nature and minimal impact on blood sugar levels.
- Maltitol: Strong demand in confectionery and chewing gum applications.
- Isomalt: Niche applications in sugar-free confectionery.
- Other Types: This segment is predicted to witness considerable growth fueled by innovation.
By Application:
Food and Beverages: The largest application segment, owing to the extensive use of polyols in various food products.
Pharmaceuticals: Significant demand in the pharmaceutical industry due to the functional properties of polyols.
Personal Care: Growing application in personal care products such as toothpastes and mouthwashes.
Key Drivers: Rising health consciousness, increasing prevalence of chronic diseases, and growth of the functional food & beverage market.
Polyol Sweeteners Industry Product Landscape
The polyol sweeteners market showcases a diverse range of products, each tailored to specific applications and consumer preferences. Recent innovations focus on enhancing taste and texture profiles while minimizing the potential drawbacks associated with certain polyols. Advancements in production technologies enable the creation of polyols with improved functionalities, such as enhanced solubility, reduced aftertaste, and increased stability. Unique selling propositions often highlight the health benefits and functional properties, catering to the growing demand for natural and low-calorie alternatives. Manufacturers emphasize sustainability and ethical sourcing in marketing their products.
Key Drivers, Barriers & Challenges in Polyol Sweeteners Industry
Key Drivers:
- Increasing demand for healthy and low-calorie food and beverages.
- Growing prevalence of chronic diseases like diabetes and obesity.
- Technological advancements in polyol production.
- Increasing regulatory approval for polyol-based products.
Challenges and Restraints:
- Potential for gastrointestinal side effects with excessive consumption of certain polyols.
- High production costs compared to some traditional sweeteners.
- Competition from other low-calorie sweeteners.
- Fluctuations in raw material prices.
Emerging Opportunities in Polyol Sweeteners Industry
- Growing demand for sugar-free confectionery and bakery products.
- Expanding application of polyols in functional food and beverage products.
- Increasing use of polyols in personal care and pharmaceutical applications.
- Development of novel polyols with improved properties.
Growth Accelerators in the Polyol Sweeteners Industry Industry
Technological advancements in production processes and product formulation, coupled with strategic partnerships among key players, are driving long-term market growth. Expanding into untapped markets, especially in developing economies with rising disposable incomes and changing dietary preferences, represent significant growth opportunities. Companies are increasingly focusing on sustainability and ethical sourcing to gain a competitive edge.
Key Players Shaping the Polyol Sweeteners Industry Market
- Hebei Huaxu Pharmaceutical Co Ltd
- BENEO GmbH
- B Food Science Co Ltd
- DFI Corporation
- DHW Deutsche Hydrierwerke GmbH
- Dupont Nutrition & Health (Danisco)
- Archer Daniels Midland Company
- Roquette Frères
- Cargill Inc
- Ingredion Incorporated
Notable Milestones in Polyol Sweeteners Industry Sector
- March 2023: Archer Daniels Midland Company launched the Knwble Grwn brand, emphasizing sustainably sourced, plant-based ingredients. This signifies a growing market focus on ethical and sustainable sourcing.
- March 2022: Roquette invested EURO 25 million (USD 27.6 million) in liquid and powder sugar polyol production, strengthening its market position and capacity. This indicates a strategic investment to meet rising demand.
In-Depth Polyol Sweeteners Industry Market Outlook
The polyol sweeteners market is poised for continued growth, driven by favorable macroeconomic conditions and evolving consumer preferences. Strategic partnerships, technological innovation, and expansion into new geographic regions will further fuel market expansion. Companies focusing on product differentiation, sustainability, and ethical sourcing will be well-positioned to capitalize on emerging opportunities and navigate the challenges in this dynamic market.
Polyol Sweeteners Industry Segmentation
-
1. Type
- 1.1. Erythritol
- 1.2. Sorbitol
- 1.3. Maltitol
- 1.4. Isomalt
- 1.5. Other Types
-
2. Application
- 2.1. Food and Beverages
- 2.2. Pharmaceuticals
- 2.3. Personal Care
Polyol Sweeteners Industry Segmentation By Geography
-
1. North America
- 1.1. United States
- 1.2. Canada
- 1.3. Mexico
- 1.4. Rest of North America
-
2. Europe
- 2.1. United Kingdom
- 2.2. Germany
- 2.3. France
- 2.4. Russia
- 2.5. Italy
- 2.6. Spain
- 2.7. Rest of Europe
-
3. Asia Pacific
- 3.1. India
- 3.2. China
- 3.3. Japan
- 3.4. Australia
- 3.5. Rest of Asia Pacific
-
4. South America
- 4.1. Brazil
- 4.2. Argentina
- 4.3. Rest of South America
- 5. Middle East
-
6. South Africa
- 6.1. Saudi Arabia
- 6.2. Rest of MEA
Polyol Sweeteners Industry REPORT HIGHLIGHTS
| Aspects | Details |
|---|---|
| Study Period | 2019-2033 |
| Base Year | 2024 |
| Estimated Year | 2025 |
| Forecast Period | 2025-2033 |
| Historical Period | 2019-2024 |
| Growth Rate | CAGR of 4.50% from 2019-2033 |
| Segmentation |
|
Table of Contents
- 1. Introduction
- 1.1. Research Scope
- 1.2. Market Segmentation
- 1.3. Research Methodology
- 1.4. Definitions and Assumptions
- 2. Executive Summary
- 2.1. Introduction
- 3. Market Dynamics
- 3.1. Introduction
- 3.2. Market Drivers
- 3.2.1. Increasing Demand for Organic Plant Proteins; Increasing Application of Pea Protein in Food and Beverages
- 3.3. Market Restrains
- 3.3.1. Presence of Alternative protein sources
- 3.4. Market Trends
- 3.4.1. Rising Preference Towards Low-Calorie Sweetener
- 4. Market Factor Analysis
- 4.1. Porters Five Forces
- 4.2. Supply/Value Chain
- 4.3. PESTEL analysis
- 4.4. Market Entropy
- 4.5. Patent/Trademark Analysis
- 5. Global Polyol Sweeteners Industry Analysis, Insights and Forecast, 2019-2031
- 5.1. Market Analysis, Insights and Forecast - by Type
- 5.1.1. Erythritol
- 5.1.2. Sorbitol
- 5.1.3. Maltitol
- 5.1.4. Isomalt
- 5.1.5. Other Types
- 5.2. Market Analysis, Insights and Forecast - by Application
- 5.2.1. Food and Beverages
- 5.2.2. Pharmaceuticals
- 5.2.3. Personal Care
- 5.3. Market Analysis, Insights and Forecast - by Region
- 5.3.1. North America
- 5.3.2. Europe
- 5.3.3. Asia Pacific
- 5.3.4. South America
- 5.3.5. Middle East
- 5.3.6. South Africa
- 5.1. Market Analysis, Insights and Forecast - by Type
- 6. North America Polyol Sweeteners Industry Analysis, Insights and Forecast, 2019-2031
- 6.1. Market Analysis, Insights and Forecast - by Type
- 6.1.1. Erythritol
- 6.1.2. Sorbitol
- 6.1.3. Maltitol
- 6.1.4. Isomalt
- 6.1.5. Other Types
- 6.2. Market Analysis, Insights and Forecast - by Application
- 6.2.1. Food and Beverages
- 6.2.2. Pharmaceuticals
- 6.2.3. Personal Care
- 6.1. Market Analysis, Insights and Forecast - by Type
- 7. Europe Polyol Sweeteners Industry Analysis, Insights and Forecast, 2019-2031
- 7.1. Market Analysis, Insights and Forecast - by Type
- 7.1.1. Erythritol
- 7.1.2. Sorbitol
- 7.1.3. Maltitol
- 7.1.4. Isomalt
- 7.1.5. Other Types
- 7.2. Market Analysis, Insights and Forecast - by Application
- 7.2.1. Food and Beverages
- 7.2.2. Pharmaceuticals
- 7.2.3. Personal Care
- 7.1. Market Analysis, Insights and Forecast - by Type
- 8. Asia Pacific Polyol Sweeteners Industry Analysis, Insights and Forecast, 2019-2031
- 8.1. Market Analysis, Insights and Forecast - by Type
- 8.1.1. Erythritol
- 8.1.2. Sorbitol
- 8.1.3. Maltitol
- 8.1.4. Isomalt
- 8.1.5. Other Types
- 8.2. Market Analysis, Insights and Forecast - by Application
- 8.2.1. Food and Beverages
- 8.2.2. Pharmaceuticals
- 8.2.3. Personal Care
- 8.1. Market Analysis, Insights and Forecast - by Type
- 9. South America Polyol Sweeteners Industry Analysis, Insights and Forecast, 2019-2031
- 9.1. Market Analysis, Insights and Forecast - by Type
- 9.1.1. Erythritol
- 9.1.2. Sorbitol
- 9.1.3. Maltitol
- 9.1.4. Isomalt
- 9.1.5. Other Types
- 9.2. Market Analysis, Insights and Forecast - by Application
- 9.2.1. Food and Beverages
- 9.2.2. Pharmaceuticals
- 9.2.3. Personal Care
- 9.1. Market Analysis, Insights and Forecast - by Type
- 10. Middle East Polyol Sweeteners Industry Analysis, Insights and Forecast, 2019-2031
- 10.1. Market Analysis, Insights and Forecast - by Type
- 10.1.1. Erythritol
- 10.1.2. Sorbitol
- 10.1.3. Maltitol
- 10.1.4. Isomalt
- 10.1.5. Other Types
- 10.2. Market Analysis, Insights and Forecast - by Application
- 10.2.1. Food and Beverages
- 10.2.2. Pharmaceuticals
- 10.2.3. Personal Care
- 10.1. Market Analysis, Insights and Forecast - by Type
- 11. South Africa Polyol Sweeteners Industry Analysis, Insights and Forecast, 2019-2031
- 11.1. Market Analysis, Insights and Forecast - by Type
- 11.1.1. Erythritol
- 11.1.2. Sorbitol
- 11.1.3. Maltitol
- 11.1.4. Isomalt
- 11.1.5. Other Types
- 11.2. Market Analysis, Insights and Forecast - by Application
- 11.2.1. Food and Beverages
- 11.2.2. Pharmaceuticals
- 11.2.3. Personal Care
- 11.1. Market Analysis, Insights and Forecast - by Type
- 12. North America Polyol Sweeteners Industry Analysis, Insights and Forecast, 2019-2031
- 12.1. Market Analysis, Insights and Forecast - By Country/Sub-region
- 12.1.1 United States
- 12.1.2 Canada
- 12.1.3 Mexico
- 12.1.4 Rest of North America
- 13. Europe Polyol Sweeteners Industry Analysis, Insights and Forecast, 2019-2031
- 13.1. Market Analysis, Insights and Forecast - By Country/Sub-region
- 13.1.1 United Kingdom
- 13.1.2 Germany
- 13.1.3 France
- 13.1.4 Russia
- 13.1.5 Italy
- 13.1.6 Spain
- 13.1.7 Rest of Europe
- 14. Asia Pacific Polyol Sweeteners Industry Analysis, Insights and Forecast, 2019-2031
- 14.1. Market Analysis, Insights and Forecast - By Country/Sub-region
- 14.1.1 India
- 14.1.2 China
- 14.1.3 Japan
- 14.1.4 Australia
- 14.1.5 Rest of Asia Pacific
- 15. South America Polyol Sweeteners Industry Analysis, Insights and Forecast, 2019-2031
- 15.1. Market Analysis, Insights and Forecast - By Country/Sub-region
- 15.1.1 Brazil
- 15.1.2 Argentina
- 15.1.3 Rest of South America
- 16. Middle East Polyol Sweeteners Industry Analysis, Insights and Forecast, 2019-2031
- 16.1. Market Analysis, Insights and Forecast - By Country/Sub-region
- 16.1.1.
- 17. South Africa Polyol Sweeteners Industry Analysis, Insights and Forecast, 2019-2031
- 17.1. Market Analysis, Insights and Forecast - By Country/Sub-region
- 17.1.1 Saudi Arabia
- 17.1.2 Rest of MEA
- 18. Competitive Analysis
- 18.1. Global Market Share Analysis 2024
- 18.2. Company Profiles
- 18.2.1 Hebei Huaxu Pharmaceutical Co Ltd *List Not Exhaustive
- 18.2.1.1. Overview
- 18.2.1.2. Products
- 18.2.1.3. SWOT Analysis
- 18.2.1.4. Recent Developments
- 18.2.1.5. Financials (Based on Availability)
- 18.2.2 BENEO GmbH
- 18.2.2.1. Overview
- 18.2.2.2. Products
- 18.2.2.3. SWOT Analysis
- 18.2.2.4. Recent Developments
- 18.2.2.5. Financials (Based on Availability)
- 18.2.3 B Food Science Co Ltd
- 18.2.3.1. Overview
- 18.2.3.2. Products
- 18.2.3.3. SWOT Analysis
- 18.2.3.4. Recent Developments
- 18.2.3.5. Financials (Based on Availability)
- 18.2.4 DFI Corporation
- 18.2.4.1. Overview
- 18.2.4.2. Products
- 18.2.4.3. SWOT Analysis
- 18.2.4.4. Recent Developments
- 18.2.4.5. Financials (Based on Availability)
- 18.2.5 DHW Deutsche Hydrierwerke GmbH
- 18.2.5.1. Overview
- 18.2.5.2. Products
- 18.2.5.3. SWOT Analysis
- 18.2.5.4. Recent Developments
- 18.2.5.5. Financials (Based on Availability)
- 18.2.6 Dupont Nutrition & Health (Danisco)
- 18.2.6.1. Overview
- 18.2.6.2. Products
- 18.2.6.3. SWOT Analysis
- 18.2.6.4. Recent Developments
- 18.2.6.5. Financials (Based on Availability)
- 18.2.7 Archer Daniels Midland Company
- 18.2.7.1. Overview
- 18.2.7.2. Products
- 18.2.7.3. SWOT Analysis
- 18.2.7.4. Recent Developments
- 18.2.7.5. Financials (Based on Availability)
- 18.2.8 Roquette Frères
- 18.2.8.1. Overview
- 18.2.8.2. Products
- 18.2.8.3. SWOT Analysis
- 18.2.8.4. Recent Developments
- 18.2.8.5. Financials (Based on Availability)
- 18.2.9 Cargill Inc
- 18.2.9.1. Overview
- 18.2.9.2. Products
- 18.2.9.3. SWOT Analysis
- 18.2.9.4. Recent Developments
- 18.2.9.5. Financials (Based on Availability)
- 18.2.10 Ingredion Incorporated
- 18.2.10.1. Overview
- 18.2.10.2. Products
- 18.2.10.3. SWOT Analysis
- 18.2.10.4. Recent Developments
- 18.2.10.5. Financials (Based on Availability)
- 18.2.1 Hebei Huaxu Pharmaceutical Co Ltd *List Not Exhaustive
List of Figures
- Figure 1: Global Polyol Sweeteners Industry Revenue Breakdown (Million, %) by Region 2024 & 2032
- Figure 2: Global Polyol Sweeteners Industry Volume Breakdown (K Tons, %) by Region 2024 & 2032
- Figure 3: North America Polyol Sweeteners Industry Revenue (Million), by Country 2024 & 2032
- Figure 4: North America Polyol Sweeteners Industry Volume (K Tons), by Country 2024 & 2032
- Figure 5: North America Polyol Sweeteners Industry Revenue Share (%), by Country 2024 & 2032
- Figure 6: North America Polyol Sweeteners Industry Volume Share (%), by Country 2024 & 2032
- Figure 7: Europe Polyol Sweeteners Industry Revenue (Million), by Country 2024 & 2032
- Figure 8: Europe Polyol Sweeteners Industry Volume (K Tons), by Country 2024 & 2032
- Figure 9: Europe Polyol Sweeteners Industry Revenue Share (%), by Country 2024 & 2032
- Figure 10: Europe Polyol Sweeteners Industry Volume Share (%), by Country 2024 & 2032
- Figure 11: Asia Pacific Polyol Sweeteners Industry Revenue (Million), by Country 2024 & 2032
- Figure 12: Asia Pacific Polyol Sweeteners Industry Volume (K Tons), by Country 2024 & 2032
- Figure 13: Asia Pacific Polyol Sweeteners Industry Revenue Share (%), by Country 2024 & 2032
- Figure 14: Asia Pacific Polyol Sweeteners Industry Volume Share (%), by Country 2024 & 2032
- Figure 15: South America Polyol Sweeteners Industry Revenue (Million), by Country 2024 & 2032
- Figure 16: South America Polyol Sweeteners Industry Volume (K Tons), by Country 2024 & 2032
- Figure 17: South America Polyol Sweeteners Industry Revenue Share (%), by Country 2024 & 2032
- Figure 18: South America Polyol Sweeteners Industry Volume Share (%), by Country 2024 & 2032
- Figure 19: Middle East Polyol Sweeteners Industry Revenue (Million), by Country 2024 & 2032
- Figure 20: Middle East Polyol Sweeteners Industry Volume (K Tons), by Country 2024 & 2032
- Figure 21: Middle East Polyol Sweeteners Industry Revenue Share (%), by Country 2024 & 2032
- Figure 22: Middle East Polyol Sweeteners Industry Volume Share (%), by Country 2024 & 2032
- Figure 23: South Africa Polyol Sweeteners Industry Revenue (Million), by Country 2024 & 2032
- Figure 24: South Africa Polyol Sweeteners Industry Volume (K Tons), by Country 2024 & 2032
- Figure 25: South Africa Polyol Sweeteners Industry Revenue Share (%), by Country 2024 & 2032
- Figure 26: South Africa Polyol Sweeteners Industry Volume Share (%), by Country 2024 & 2032
- Figure 27: North America Polyol Sweeteners Industry Revenue (Million), by Type 2024 & 2032
- Figure 28: North America Polyol Sweeteners Industry Volume (K Tons), by Type 2024 & 2032
- Figure 29: North America Polyol Sweeteners Industry Revenue Share (%), by Type 2024 & 2032
- Figure 30: North America Polyol Sweeteners Industry Volume Share (%), by Type 2024 & 2032
- Figure 31: North America Polyol Sweeteners Industry Revenue (Million), by Application 2024 & 2032
- Figure 32: North America Polyol Sweeteners Industry Volume (K Tons), by Application 2024 & 2032
- Figure 33: North America Polyol Sweeteners Industry Revenue Share (%), by Application 2024 & 2032
- Figure 34: North America Polyol Sweeteners Industry Volume Share (%), by Application 2024 & 2032
- Figure 35: North America Polyol Sweeteners Industry Revenue (Million), by Country 2024 & 2032
- Figure 36: North America Polyol Sweeteners Industry Volume (K Tons), by Country 2024 & 2032
- Figure 37: North America Polyol Sweeteners Industry Revenue Share (%), by Country 2024 & 2032
- Figure 38: North America Polyol Sweeteners Industry Volume Share (%), by Country 2024 & 2032
- Figure 39: Europe Polyol Sweeteners Industry Revenue (Million), by Type 2024 & 2032
- Figure 40: Europe Polyol Sweeteners Industry Volume (K Tons), by Type 2024 & 2032
- Figure 41: Europe Polyol Sweeteners Industry Revenue Share (%), by Type 2024 & 2032
- Figure 42: Europe Polyol Sweeteners Industry Volume Share (%), by Type 2024 & 2032
- Figure 43: Europe Polyol Sweeteners Industry Revenue (Million), by Application 2024 & 2032
- Figure 44: Europe Polyol Sweeteners Industry Volume (K Tons), by Application 2024 & 2032
- Figure 45: Europe Polyol Sweeteners Industry Revenue Share (%), by Application 2024 & 2032
- Figure 46: Europe Polyol Sweeteners Industry Volume Share (%), by Application 2024 & 2032
- Figure 47: Europe Polyol Sweeteners Industry Revenue (Million), by Country 2024 & 2032
- Figure 48: Europe Polyol Sweeteners Industry Volume (K Tons), by Country 2024 & 2032
- Figure 49: Europe Polyol Sweeteners Industry Revenue Share (%), by Country 2024 & 2032
- Figure 50: Europe Polyol Sweeteners Industry Volume Share (%), by Country 2024 & 2032
- Figure 51: Asia Pacific Polyol Sweeteners Industry Revenue (Million), by Type 2024 & 2032
- Figure 52: Asia Pacific Polyol Sweeteners Industry Volume (K Tons), by Type 2024 & 2032
- Figure 53: Asia Pacific Polyol Sweeteners Industry Revenue Share (%), by Type 2024 & 2032
- Figure 54: Asia Pacific Polyol Sweeteners Industry Volume Share (%), by Type 2024 & 2032
- Figure 55: Asia Pacific Polyol Sweeteners Industry Revenue (Million), by Application 2024 & 2032
- Figure 56: Asia Pacific Polyol Sweeteners Industry Volume (K Tons), by Application 2024 & 2032
- Figure 57: Asia Pacific Polyol Sweeteners Industry Revenue Share (%), by Application 2024 & 2032
- Figure 58: Asia Pacific Polyol Sweeteners Industry Volume Share (%), by Application 2024 & 2032
- Figure 59: Asia Pacific Polyol Sweeteners Industry Revenue (Million), by Country 2024 & 2032
- Figure 60: Asia Pacific Polyol Sweeteners Industry Volume (K Tons), by Country 2024 & 2032
- Figure 61: Asia Pacific Polyol Sweeteners Industry Revenue Share (%), by Country 2024 & 2032
- Figure 62: Asia Pacific Polyol Sweeteners Industry Volume Share (%), by Country 2024 & 2032
- Figure 63: South America Polyol Sweeteners Industry Revenue (Million), by Type 2024 & 2032
- Figure 64: South America Polyol Sweeteners Industry Volume (K Tons), by Type 2024 & 2032
- Figure 65: South America Polyol Sweeteners Industry Revenue Share (%), by Type 2024 & 2032
- Figure 66: South America Polyol Sweeteners Industry Volume Share (%), by Type 2024 & 2032
- Figure 67: South America Polyol Sweeteners Industry Revenue (Million), by Application 2024 & 2032
- Figure 68: South America Polyol Sweeteners Industry Volume (K Tons), by Application 2024 & 2032
- Figure 69: South America Polyol Sweeteners Industry Revenue Share (%), by Application 2024 & 2032
- Figure 70: South America Polyol Sweeteners Industry Volume Share (%), by Application 2024 & 2032
- Figure 71: South America Polyol Sweeteners Industry Revenue (Million), by Country 2024 & 2032
- Figure 72: South America Polyol Sweeteners Industry Volume (K Tons), by Country 2024 & 2032
- Figure 73: South America Polyol Sweeteners Industry Revenue Share (%), by Country 2024 & 2032
- Figure 74: South America Polyol Sweeteners Industry Volume Share (%), by Country 2024 & 2032
- Figure 75: Middle East Polyol Sweeteners Industry Revenue (Million), by Type 2024 & 2032
- Figure 76: Middle East Polyol Sweeteners Industry Volume (K Tons), by Type 2024 & 2032
- Figure 77: Middle East Polyol Sweeteners Industry Revenue Share (%), by Type 2024 & 2032
- Figure 78: Middle East Polyol Sweeteners Industry Volume Share (%), by Type 2024 & 2032
- Figure 79: Middle East Polyol Sweeteners Industry Revenue (Million), by Application 2024 & 2032
- Figure 80: Middle East Polyol Sweeteners Industry Volume (K Tons), by Application 2024 & 2032
- Figure 81: Middle East Polyol Sweeteners Industry Revenue Share (%), by Application 2024 & 2032
- Figure 82: Middle East Polyol Sweeteners Industry Volume Share (%), by Application 2024 & 2032
- Figure 83: Middle East Polyol Sweeteners Industry Revenue (Million), by Country 2024 & 2032
- Figure 84: Middle East Polyol Sweeteners Industry Volume (K Tons), by Country 2024 & 2032
- Figure 85: Middle East Polyol Sweeteners Industry Revenue Share (%), by Country 2024 & 2032
- Figure 86: Middle East Polyol Sweeteners Industry Volume Share (%), by Country 2024 & 2032
- Figure 87: South Africa Polyol Sweeteners Industry Revenue (Million), by Type 2024 & 2032
- Figure 88: South Africa Polyol Sweeteners Industry Volume (K Tons), by Type 2024 & 2032
- Figure 89: South Africa Polyol Sweeteners Industry Revenue Share (%), by Type 2024 & 2032
- Figure 90: South Africa Polyol Sweeteners Industry Volume Share (%), by Type 2024 & 2032
- Figure 91: South Africa Polyol Sweeteners Industry Revenue (Million), by Application 2024 & 2032
- Figure 92: South Africa Polyol Sweeteners Industry Volume (K Tons), by Application 2024 & 2032
- Figure 93: South Africa Polyol Sweeteners Industry Revenue Share (%), by Application 2024 & 2032
- Figure 94: South Africa Polyol Sweeteners Industry Volume Share (%), by Application 2024 & 2032
- Figure 95: South Africa Polyol Sweeteners Industry Revenue (Million), by Country 2024 & 2032
- Figure 96: South Africa Polyol Sweeteners Industry Volume (K Tons), by Country 2024 & 2032
- Figure 97: South Africa Polyol Sweeteners Industry Revenue Share (%), by Country 2024 & 2032
- Figure 98: South Africa Polyol Sweeteners Industry Volume Share (%), by Country 2024 & 2032
List of Tables
- Table 1: Global Polyol Sweeteners Industry Revenue Million Forecast, by Region 2019 & 2032
- Table 2: Global Polyol Sweeteners Industry Volume K Tons Forecast, by Region 2019 & 2032
- Table 3: Global Polyol Sweeteners Industry Revenue Million Forecast, by Type 2019 & 2032
- Table 4: Global Polyol Sweeteners Industry Volume K Tons Forecast, by Type 2019 & 2032
- Table 5: Global Polyol Sweeteners Industry Revenue Million Forecast, by Application 2019 & 2032
- Table 6: Global Polyol Sweeteners Industry Volume K Tons Forecast, by Application 2019 & 2032
- Table 7: Global Polyol Sweeteners Industry Revenue Million Forecast, by Region 2019 & 2032
- Table 8: Global Polyol Sweeteners Industry Volume K Tons Forecast, by Region 2019 & 2032
- Table 9: Global Polyol Sweeteners Industry Revenue Million Forecast, by Country 2019 & 2032
- Table 10: Global Polyol Sweeteners Industry Volume K Tons Forecast, by Country 2019 & 2032
- Table 11: United States Polyol Sweeteners Industry Revenue (Million) Forecast, by Application 2019 & 2032
- Table 12: United States Polyol Sweeteners Industry Volume (K Tons) Forecast, by Application 2019 & 2032
- Table 13: Canada Polyol Sweeteners Industry Revenue (Million) Forecast, by Application 2019 & 2032
- Table 14: Canada Polyol Sweeteners Industry Volume (K Tons) Forecast, by Application 2019 & 2032
- Table 15: Mexico Polyol Sweeteners Industry Revenue (Million) Forecast, by Application 2019 & 2032
- Table 16: Mexico Polyol Sweeteners Industry Volume (K Tons) Forecast, by Application 2019 & 2032
- Table 17: Rest of North America Polyol Sweeteners Industry Revenue (Million) Forecast, by Application 2019 & 2032
- Table 18: Rest of North America Polyol Sweeteners Industry Volume (K Tons) Forecast, by Application 2019 & 2032
- Table 19: Global Polyol Sweeteners Industry Revenue Million Forecast, by Country 2019 & 2032
- Table 20: Global Polyol Sweeteners Industry Volume K Tons Forecast, by Country 2019 & 2032
- Table 21: United Kingdom Polyol Sweeteners Industry Revenue (Million) Forecast, by Application 2019 & 2032
- Table 22: United Kingdom Polyol Sweeteners Industry Volume (K Tons) Forecast, by Application 2019 & 2032
- Table 23: Germany Polyol Sweeteners Industry Revenue (Million) Forecast, by Application 2019 & 2032
- Table 24: Germany Polyol Sweeteners Industry Volume (K Tons) Forecast, by Application 2019 & 2032
- Table 25: France Polyol Sweeteners Industry Revenue (Million) Forecast, by Application 2019 & 2032
- Table 26: France Polyol Sweeteners Industry Volume (K Tons) Forecast, by Application 2019 & 2032
- Table 27: Russia Polyol Sweeteners Industry Revenue (Million) Forecast, by Application 2019 & 2032
- Table 28: Russia Polyol Sweeteners Industry Volume (K Tons) Forecast, by Application 2019 & 2032
- Table 29: Italy Polyol Sweeteners Industry Revenue (Million) Forecast, by Application 2019 & 2032
- Table 30: Italy Polyol Sweeteners Industry Volume (K Tons) Forecast, by Application 2019 & 2032
- Table 31: Spain Polyol Sweeteners Industry Revenue (Million) Forecast, by Application 2019 & 2032
- Table 32: Spain Polyol Sweeteners Industry Volume (K Tons) Forecast, by Application 2019 & 2032
- Table 33: Rest of Europe Polyol Sweeteners Industry Revenue (Million) Forecast, by Application 2019 & 2032
- Table 34: Rest of Europe Polyol Sweeteners Industry Volume (K Tons) Forecast, by Application 2019 & 2032
- Table 35: Global Polyol Sweeteners Industry Revenue Million Forecast, by Country 2019 & 2032
- Table 36: Global Polyol Sweeteners Industry Volume K Tons Forecast, by Country 2019 & 2032
- Table 37: India Polyol Sweeteners Industry Revenue (Million) Forecast, by Application 2019 & 2032
- Table 38: India Polyol Sweeteners Industry Volume (K Tons) Forecast, by Application 2019 & 2032
- Table 39: China Polyol Sweeteners Industry Revenue (Million) Forecast, by Application 2019 & 2032
- Table 40: China Polyol Sweeteners Industry Volume (K Tons) Forecast, by Application 2019 & 2032
- Table 41: Japan Polyol Sweeteners Industry Revenue (Million) Forecast, by Application 2019 & 2032
- Table 42: Japan Polyol Sweeteners Industry Volume (K Tons) Forecast, by Application 2019 & 2032
- Table 43: Australia Polyol Sweeteners Industry Revenue (Million) Forecast, by Application 2019 & 2032
- Table 44: Australia Polyol Sweeteners Industry Volume (K Tons) Forecast, by Application 2019 & 2032
- Table 45: Rest of Asia Pacific Polyol Sweeteners Industry Revenue (Million) Forecast, by Application 2019 & 2032
- Table 46: Rest of Asia Pacific Polyol Sweeteners Industry Volume (K Tons) Forecast, by Application 2019 & 2032
- Table 47: Global Polyol Sweeteners Industry Revenue Million Forecast, by Country 2019 & 2032
- Table 48: Global Polyol Sweeteners Industry Volume K Tons Forecast, by Country 2019 & 2032
- Table 49: Brazil Polyol Sweeteners Industry Revenue (Million) Forecast, by Application 2019 & 2032
- Table 50: Brazil Polyol Sweeteners Industry Volume (K Tons) Forecast, by Application 2019 & 2032
- Table 51: Argentina Polyol Sweeteners Industry Revenue (Million) Forecast, by Application 2019 & 2032
- Table 52: Argentina Polyol Sweeteners Industry Volume (K Tons) Forecast, by Application 2019 & 2032
- Table 53: Rest of South America Polyol Sweeteners Industry Revenue (Million) Forecast, by Application 2019 & 2032
- Table 54: Rest of South America Polyol Sweeteners Industry Volume (K Tons) Forecast, by Application 2019 & 2032
- Table 55: Global Polyol Sweeteners Industry Revenue Million Forecast, by Country 2019 & 2032
- Table 56: Global Polyol Sweeteners Industry Volume K Tons Forecast, by Country 2019 & 2032
- Table 57: Polyol Sweeteners Industry Revenue (Million) Forecast, by Application 2019 & 2032
- Table 58: Polyol Sweeteners Industry Volume (K Tons) Forecast, by Application 2019 & 2032
- Table 59: Global Polyol Sweeteners Industry Revenue Million Forecast, by Country 2019 & 2032
- Table 60: Global Polyol Sweeteners Industry Volume K Tons Forecast, by Country 2019 & 2032
- Table 61: Saudi Arabia Polyol Sweeteners Industry Revenue (Million) Forecast, by Application 2019 & 2032
- Table 62: Saudi Arabia Polyol Sweeteners Industry Volume (K Tons) Forecast, by Application 2019 & 2032
- Table 63: Rest of MEA Polyol Sweeteners Industry Revenue (Million) Forecast, by Application 2019 & 2032
- Table 64: Rest of MEA Polyol Sweeteners Industry Volume (K Tons) Forecast, by Application 2019 & 2032
- Table 65: Global Polyol Sweeteners Industry Revenue Million Forecast, by Type 2019 & 2032
- Table 66: Global Polyol Sweeteners Industry Volume K Tons Forecast, by Type 2019 & 2032
- Table 67: Global Polyol Sweeteners Industry Revenue Million Forecast, by Application 2019 & 2032
- Table 68: Global Polyol Sweeteners Industry Volume K Tons Forecast, by Application 2019 & 2032
- Table 69: Global Polyol Sweeteners Industry Revenue Million Forecast, by Country 2019 & 2032
- Table 70: Global Polyol Sweeteners Industry Volume K Tons Forecast, by Country 2019 & 2032
- Table 71: United States Polyol Sweeteners Industry Revenue (Million) Forecast, by Application 2019 & 2032
- Table 72: United States Polyol Sweeteners Industry Volume (K Tons) Forecast, by Application 2019 & 2032
- Table 73: Canada Polyol Sweeteners Industry Revenue (Million) Forecast, by Application 2019 & 2032
- Table 74: Canada Polyol Sweeteners Industry Volume (K Tons) Forecast, by Application 2019 & 2032
- Table 75: Mexico Polyol Sweeteners Industry Revenue (Million) Forecast, by Application 2019 & 2032
- Table 76: Mexico Polyol Sweeteners Industry Volume (K Tons) Forecast, by Application 2019 & 2032
- Table 77: Rest of North America Polyol Sweeteners Industry Revenue (Million) Forecast, by Application 2019 & 2032
- Table 78: Rest of North America Polyol Sweeteners Industry Volume (K Tons) Forecast, by Application 2019 & 2032
- Table 79: Global Polyol Sweeteners Industry Revenue Million Forecast, by Type 2019 & 2032
- Table 80: Global Polyol Sweeteners Industry Volume K Tons Forecast, by Type 2019 & 2032
- Table 81: Global Polyol Sweeteners Industry Revenue Million Forecast, by Application 2019 & 2032
- Table 82: Global Polyol Sweeteners Industry Volume K Tons Forecast, by Application 2019 & 2032
- Table 83: Global Polyol Sweeteners Industry Revenue Million Forecast, by Country 2019 & 2032
- Table 84: Global Polyol Sweeteners Industry Volume K Tons Forecast, by Country 2019 & 2032
- Table 85: United Kingdom Polyol Sweeteners Industry Revenue (Million) Forecast, by Application 2019 & 2032
- Table 86: United Kingdom Polyol Sweeteners Industry Volume (K Tons) Forecast, by Application 2019 & 2032
- Table 87: Germany Polyol Sweeteners Industry Revenue (Million) Forecast, by Application 2019 & 2032
- Table 88: Germany Polyol Sweeteners Industry Volume (K Tons) Forecast, by Application 2019 & 2032
- Table 89: France Polyol Sweeteners Industry Revenue (Million) Forecast, by Application 2019 & 2032
- Table 90: France Polyol Sweeteners Industry Volume (K Tons) Forecast, by Application 2019 & 2032
- Table 91: Russia Polyol Sweeteners Industry Revenue (Million) Forecast, by Application 2019 & 2032
- Table 92: Russia Polyol Sweeteners Industry Volume (K Tons) Forecast, by Application 2019 & 2032
- Table 93: Italy Polyol Sweeteners Industry Revenue (Million) Forecast, by Application 2019 & 2032
- Table 94: Italy Polyol Sweeteners Industry Volume (K Tons) Forecast, by Application 2019 & 2032
- Table 95: Spain Polyol Sweeteners Industry Revenue (Million) Forecast, by Application 2019 & 2032
- Table 96: Spain Polyol Sweeteners Industry Volume (K Tons) Forecast, by Application 2019 & 2032
- Table 97: Rest of Europe Polyol Sweeteners Industry Revenue (Million) Forecast, by Application 2019 & 2032
- Table 98: Rest of Europe Polyol Sweeteners Industry Volume (K Tons) Forecast, by Application 2019 & 2032
- Table 99: Global Polyol Sweeteners Industry Revenue Million Forecast, by Type 2019 & 2032
- Table 100: Global Polyol Sweeteners Industry Volume K Tons Forecast, by Type 2019 & 2032
- Table 101: Global Polyol Sweeteners Industry Revenue Million Forecast, by Application 2019 & 2032
- Table 102: Global Polyol Sweeteners Industry Volume K Tons Forecast, by Application 2019 & 2032
- Table 103: Global Polyol Sweeteners Industry Revenue Million Forecast, by Country 2019 & 2032
- Table 104: Global Polyol Sweeteners Industry Volume K Tons Forecast, by Country 2019 & 2032
- Table 105: India Polyol Sweeteners Industry Revenue (Million) Forecast, by Application 2019 & 2032
- Table 106: India Polyol Sweeteners Industry Volume (K Tons) Forecast, by Application 2019 & 2032
- Table 107: China Polyol Sweeteners Industry Revenue (Million) Forecast, by Application 2019 & 2032
- Table 108: China Polyol Sweeteners Industry Volume (K Tons) Forecast, by Application 2019 & 2032
- Table 109: Japan Polyol Sweeteners Industry Revenue (Million) Forecast, by Application 2019 & 2032
- Table 110: Japan Polyol Sweeteners Industry Volume (K Tons) Forecast, by Application 2019 & 2032
- Table 111: Australia Polyol Sweeteners Industry Revenue (Million) Forecast, by Application 2019 & 2032
- Table 112: Australia Polyol Sweeteners Industry Volume (K Tons) Forecast, by Application 2019 & 2032
- Table 113: Rest of Asia Pacific Polyol Sweeteners Industry Revenue (Million) Forecast, by Application 2019 & 2032
- Table 114: Rest of Asia Pacific Polyol Sweeteners Industry Volume (K Tons) Forecast, by Application 2019 & 2032
- Table 115: Global Polyol Sweeteners Industry Revenue Million Forecast, by Type 2019 & 2032
- Table 116: Global Polyol Sweeteners Industry Volume K Tons Forecast, by Type 2019 & 2032
- Table 117: Global Polyol Sweeteners Industry Revenue Million Forecast, by Application 2019 & 2032
- Table 118: Global Polyol Sweeteners Industry Volume K Tons Forecast, by Application 2019 & 2032
- Table 119: Global Polyol Sweeteners Industry Revenue Million Forecast, by Country 2019 & 2032
- Table 120: Global Polyol Sweeteners Industry Volume K Tons Forecast, by Country 2019 & 2032
- Table 121: Brazil Polyol Sweeteners Industry Revenue (Million) Forecast, by Application 2019 & 2032
- Table 122: Brazil Polyol Sweeteners Industry Volume (K Tons) Forecast, by Application 2019 & 2032
- Table 123: Argentina Polyol Sweeteners Industry Revenue (Million) Forecast, by Application 2019 & 2032
- Table 124: Argentina Polyol Sweeteners Industry Volume (K Tons) Forecast, by Application 2019 & 2032
- Table 125: Rest of South America Polyol Sweeteners Industry Revenue (Million) Forecast, by Application 2019 & 2032
- Table 126: Rest of South America Polyol Sweeteners Industry Volume (K Tons) Forecast, by Application 2019 & 2032
- Table 127: Global Polyol Sweeteners Industry Revenue Million Forecast, by Type 2019 & 2032
- Table 128: Global Polyol Sweeteners Industry Volume K Tons Forecast, by Type 2019 & 2032
- Table 129: Global Polyol Sweeteners Industry Revenue Million Forecast, by Application 2019 & 2032
- Table 130: Global Polyol Sweeteners Industry Volume K Tons Forecast, by Application 2019 & 2032
- Table 131: Global Polyol Sweeteners Industry Revenue Million Forecast, by Country 2019 & 2032
- Table 132: Global Polyol Sweeteners Industry Volume K Tons Forecast, by Country 2019 & 2032
- Table 133: Global Polyol Sweeteners Industry Revenue Million Forecast, by Type 2019 & 2032
- Table 134: Global Polyol Sweeteners Industry Volume K Tons Forecast, by Type 2019 & 2032
- Table 135: Global Polyol Sweeteners Industry Revenue Million Forecast, by Application 2019 & 2032
- Table 136: Global Polyol Sweeteners Industry Volume K Tons Forecast, by Application 2019 & 2032
- Table 137: Global Polyol Sweeteners Industry Revenue Million Forecast, by Country 2019 & 2032
- Table 138: Global Polyol Sweeteners Industry Volume K Tons Forecast, by Country 2019 & 2032
- Table 139: Saudi Arabia Polyol Sweeteners Industry Revenue (Million) Forecast, by Application 2019 & 2032
- Table 140: Saudi Arabia Polyol Sweeteners Industry Volume (K Tons) Forecast, by Application 2019 & 2032
- Table 141: Rest of MEA Polyol Sweeteners Industry Revenue (Million) Forecast, by Application 2019 & 2032
- Table 142: Rest of MEA Polyol Sweeteners Industry Volume (K Tons) Forecast, by Application 2019 & 2032
Frequently Asked Questions
1. What is the projected Compound Annual Growth Rate (CAGR) of the Polyol Sweeteners Industry?
The projected CAGR is approximately 4.50%.
2. Which companies are prominent players in the Polyol Sweeteners Industry?
Key companies in the market include Hebei Huaxu Pharmaceutical Co Ltd *List Not Exhaustive, BENEO GmbH, B Food Science Co Ltd, DFI Corporation, DHW Deutsche Hydrierwerke GmbH, Dupont Nutrition & Health (Danisco), Archer Daniels Midland Company, Roquette Frères, Cargill Inc, Ingredion Incorporated.
3. What are the main segments of the Polyol Sweeteners Industry?
The market segments include Type, Application.
4. Can you provide details about the market size?
The market size is estimated to be USD 3500 Million as of 2022.
5. What are some drivers contributing to market growth?
Increasing Demand for Organic Plant Proteins; Increasing Application of Pea Protein in Food and Beverages.
6. What are the notable trends driving market growth?
Rising Preference Towards Low-Calorie Sweetener.
7. Are there any restraints impacting market growth?
Presence of Alternative protein sources.
8. Can you provide examples of recent developments in the market?
March 2023: Archer Daniels Midland Company announced the launch of the Knwble Grwn brand to provide consumers with wholesome, plant-based food ingredients that are sustainably sourced.
9. What pricing options are available for accessing the report?
Pricing options include single-user, multi-user, and enterprise licenses priced at USD 4750, USD 5250, and USD 8750 respectively.
10. Is the market size provided in terms of value or volume?
The market size is provided in terms of value, measured in Million and volume, measured in K Tons.
11. Are there any specific market keywords associated with the report?
Yes, the market keyword associated with the report is "Polyol Sweeteners Industry," which aids in identifying and referencing the specific market segment covered.
12. How do I determine which pricing option suits my needs best?
The pricing options vary based on user requirements and access needs. Individual users may opt for single-user licenses, while businesses requiring broader access may choose multi-user or enterprise licenses for cost-effective access to the report.
13. Are there any additional resources or data provided in the Polyol Sweeteners Industry report?
While the report offers comprehensive insights, it's advisable to review the specific contents or supplementary materials provided to ascertain if additional resources or data are available.
14. How can I stay updated on further developments or reports in the Polyol Sweeteners Industry?
To stay informed about further developments, trends, and reports in the Polyol Sweeteners Industry, consider subscribing to industry newsletters, following relevant companies and organizations, or regularly checking reputable industry news sources and publications.
Methodology
Step 1 - Identification of Relevant Samples Size from Population Database


Step 2 - Approaches for Defining Global Market Size (Value, Volume* & Price*)

Note*: In applicable scenarios
Step 3 - Data Sources
Primary Research
- Web Analytics
- Survey Reports
- Research Institute
- Latest Research Reports
- Opinion Leaders
Secondary Research
- Annual Reports
- White Paper
- Latest Press Release
- Industry Association
- Paid Database
- Investor Presentations

Step 4 - Data Triangulation
Involves using different sources of information in order to increase the validity of a study
These sources are likely to be stakeholders in a program - participants, other researchers, program staff, other community members, and so on.
Then we put all data in single framework & apply various statistical tools to find out the dynamic on the market.
During the analysis stage, feedback from the stakeholder groups would be compared to determine areas of agreement as well as areas of divergence
