

Key Insights
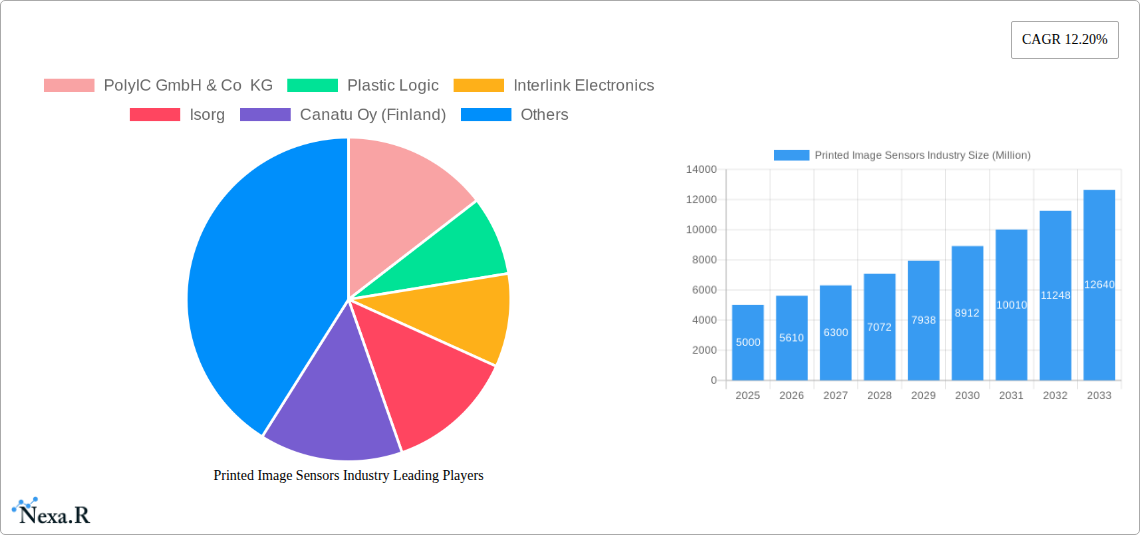
The Printed Image Sensors market is experiencing robust growth, projected to reach a significant size by 2033, driven by a compound annual growth rate (CAGR) of 12.20% from 2025. This expansion is fueled by increasing demand across diverse end-user industries, particularly consumer electronics (driven by advancements in mobile imaging and wearable technology), healthcare (for medical imaging applications and diagnostics), and the automotive and transportation sectors (for advanced driver-assistance systems (ADAS) and autonomous vehicles). The inkjet printing technology segment is leading the market, benefiting from its cost-effectiveness and suitability for high-volume production. However, challenges such as the need for improved image resolution and durability in certain applications, alongside the relatively high cost of some printing technologies, are acting as restraints. Further market penetration is anticipated in emerging economies like India and Southeast Asia, contributing substantially to overall market growth over the forecast period (2025-2033). The competitive landscape involves both established players and emerging companies continually innovating to improve sensor performance, and explore applications in emerging fields like flexible electronics.
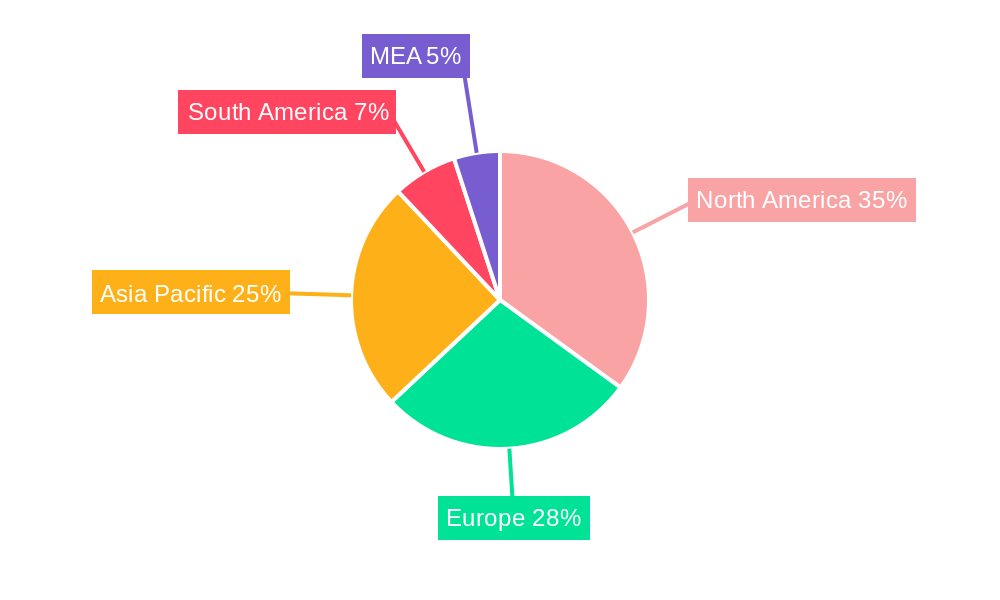
The geographical distribution reveals a strong presence in North America and Europe, driven by early adoption and technological advancements. However, the Asia-Pacific region is poised for significant growth due to its expanding consumer electronics market and increasing investments in manufacturing and technological infrastructure. Companies like PolyIC, Plastic Logic, and others are playing a pivotal role in shaping the market landscape through continuous research and development, focusing on enhancing sensor quality, miniaturization, and cost efficiency. The focus on developing flexible and highly adaptable printed image sensors will be a key driver of growth and market innovation in the coming years. Strategic partnerships and acquisitions are likely to increase as companies aim to improve market share and expand their product portfolio.
Printed Image Sensor Industry Market Report: 2019-2033
This comprehensive report provides an in-depth analysis of the Printed Image Sensors industry, encompassing market dynamics, growth trends, regional dominance, product landscape, and key players. The study period covers 2019-2033, with a base year of 2025 and a forecast period of 2025-2033. The report utilizes data from the historical period (2019-2024) to project future market growth, offering valuable insights for industry professionals, investors, and strategic decision-makers. The market is segmented by printing technology (Inkjet Printing, Screen Printing, Flexographic Printing, Other Printing Technologies) and end-user industry (Consumer Electronics, Healthcare, Industrial, Automotive and Transportation, Other End-user Industries). The total market size in 2025 is estimated at xx Million units.
Printed Image Sensors Industry Market Dynamics & Structure
The Printed Image Sensors market exhibits a moderately fragmented structure, with several key players vying for market share. Technological innovation, particularly in flexible and low-cost printing techniques, is a significant driver of growth. Regulatory frameworks concerning material safety and environmental impact influence market development. Competitive substitutes, such as traditional image sensors, exert pressure, necessitating continuous product improvement. The end-user demographics are broadening, with increasing adoption across various sectors. M&A activity within the industry has been relatively moderate (xx deals in the last 5 years, representing a xx% increase from the previous 5 years), reflecting strategic consolidation and expansion efforts.
- Market Concentration: Moderately fragmented, with no single dominant player holding over 30% market share in 2025.
- Technological Innovation: Focus on improving resolution, sensitivity, and flexibility of printed sensors.
- Regulatory Frameworks: Compliance with RoHS, REACH, and other environmental regulations is crucial.
- Competitive Substitutes: Traditional silicon-based image sensors pose a significant challenge.
- End-User Demographics: Expanding adoption across consumer electronics, automotive, and healthcare sectors.
- M&A Trends: Strategic acquisitions to enhance technology portfolios and expand market reach.
Printed Image Sensors Industry Growth Trends & Insights
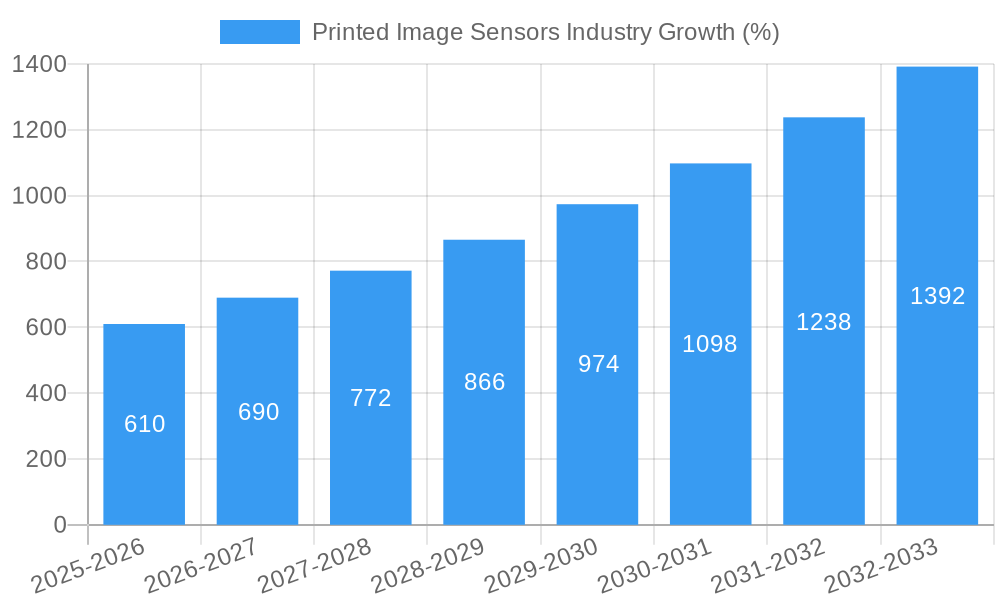
The Printed Image Sensors market is experiencing robust growth, driven by increasing demand for flexible, low-cost, and large-area image sensors. The market size is projected to reach xx Million units by 2033, exhibiting a CAGR of xx% during the forecast period. This growth is fueled by technological advancements, such as the development of high-resolution printing techniques and improved sensor materials. Consumer preference for miniaturization and flexible electronics further drives adoption across various applications. The market penetration rate is expected to increase from xx% in 2025 to xx% by 2033. Technological disruptions, particularly the introduction of new printing techniques and materials, are reshaping the competitive landscape.
Dominant Regions, Countries, or Segments in Printed Image Sensors Industry
North America and Europe currently hold the largest market shares in the Printed Image Sensors industry, driven by strong technological advancements, robust R&D investments, and a well-established supply chain. However, Asia-Pacific is projected to witness the fastest growth rate in the forecast period, driven by increasing consumer electronics manufacturing and rising disposable incomes. Within the segments, inkjet printing technology holds the largest market share (xx%) due to its versatility and scalability, while the consumer electronics sector accounts for the highest demand (xx%).
- Key Drivers:
- North America & Europe: Strong R&D, established supply chains, high consumer spending.
- Asia-Pacific: Rapid growth in consumer electronics manufacturing, rising disposable incomes.
- Inkjet Printing: Versatility, scalability, and cost-effectiveness.
- Consumer Electronics: High demand for integrated sensors in smartphones, wearables, and other devices.
- Dominance Factors: Market share, growth potential, technological advancements, and favorable regulatory environments contribute to regional and segment dominance.
Printed Image Sensors Industry Product Landscape
Printed image sensors offer unique advantages over traditional sensors, including flexibility, low cost, and large-area capabilities. Innovations focus on enhanced resolution, improved sensitivity, and broader spectral response. Applications span diverse sectors, from consumer electronics and healthcare to industrial automation and automotive safety systems. Key performance metrics include resolution, sensitivity, dynamic range, and operating temperature range. The unique selling propositions lie in the cost-effectiveness, formability, and large-area printing capabilities, enabling new applications not possible with traditional sensors.
Key Drivers, Barriers & Challenges in Printed Image Sensors Industry
Key Drivers:
- Technological advancements in printing and material science.
- Growing demand for flexible and wearable electronics.
- Increasing applications across diverse industries.
Key Challenges:
- Maintaining consistent sensor quality and reliability.
- Addressing limitations in resolution and sensitivity compared to traditional sensors.
- Managing the complexity of the supply chain.
Emerging Opportunities in Printed Image Sensors Industry
Emerging opportunities include the expansion into new applications, such as biomedical sensors, environmental monitoring, and smart packaging. Untapped markets in developing economies offer significant growth potential. Innovation in sensor materials and printing technologies presents opportunities to enhance performance and reduce costs. Evolving consumer preferences towards personalized and connected devices drive the demand for integrated sensors.
Growth Accelerators in the Printed Image Sensors Industry Industry
Technological breakthroughs, such as the development of advanced printing techniques and high-performance sensor materials, will significantly accelerate market growth. Strategic partnerships between sensor manufacturers and end-users can foster innovation and market penetration. Expansion into new applications and geographic markets will also drive industry growth.
Key Players Shaping the Printed Image Sensors Industry Market
- PolyIC GmbH & Co KG
- Plastic Logic
- Interlink Electronics
- Isorg
- Canatu Oy (Finland)
- FlexEnable Limited
Notable Milestones in Printed Image Sensors Industry Sector
- 2020: Isorg announces a new high-resolution printed sensor.
- 2021: FlexEnable secures funding for expanding its production capacity.
- 2022: PolyIC launches a new flexible sensor for automotive applications.
- 2023: Canatu Oy introduces innovative printed sensor technology for automotive applications.
- 2024: Plastic Logic develops a new printed sensor technology for consumer electronics applications. (Further milestones to be added based on actual developments.)
In-Depth Printed Image Sensors Industry Market Outlook
The future of the Printed Image Sensors industry is bright, driven by the ongoing development of innovative printing technologies and materials, expanding applications across various sectors, and the increasing demand for flexible and low-cost sensors. Strategic partnerships and investments in R&D will continue to play a crucial role in shaping the market. The market's potential for growth is significant, especially in emerging economies and new applications where printed image sensors offer a unique advantage.
Printed Image Sensors Industry Segmentation
-
1. Printing Technology
- 1.1. Inkjet Printing
- 1.2. Screen Printing
- 1.3. Flexographic Printing
- 1.4. Other Printing Technologies
-
2. End-user Industry
- 2.1. Consumer Electronics
- 2.2. Healthcare
- 2.3. Industrial
- 2.4. Automotive and Transportation
- 2.5. Other End-user Industries
Printed Image Sensors Industry Segmentation By Geography
- 1. North America
- 2. Europe
- 3. Asia Pacific
- 4. Rest of the World
Printed Image Sensors Industry REPORT HIGHLIGHTS
| Aspects | Details |
|---|---|
| Study Period | 2019-2033 |
| Base Year | 2024 |
| Estimated Year | 2025 |
| Forecast Period | 2025-2033 |
| Historical Period | 2019-2024 |
| Growth Rate | CAGR of 12.20% from 2019-2033 |
| Segmentation |
|
Table of Contents
- 1. Introduction
- 1.1. Research Scope
- 1.2. Market Segmentation
- 1.3. Research Methodology
- 1.4. Definitions and Assumptions
- 2. Executive Summary
- 2.1. Introduction
- 3. Market Dynamics
- 3.1. Introduction
- 3.2. Market Drivers
- 3.2.1. ; Use of Integrated Dashboards in Advanced Driver Assistance System (ADAS) in Automotive Sector; Increasing Usage of CMOS Sensors in Consumer Electronics Products
- 3.3. Market Restrains
- 3.3.1. ; Complex Manufacturing Process
- 3.4. Market Trends
- 3.4.1. ADAS Production in Automotive Sector is Driving the Market Growth
- 4. Market Factor Analysis
- 4.1. Porters Five Forces
- 4.2. Supply/Value Chain
- 4.3. PESTEL analysis
- 4.4. Market Entropy
- 4.5. Patent/Trademark Analysis
- 5. Global Printed Image Sensors Industry Analysis, Insights and Forecast, 2019-2031
- 5.1. Market Analysis, Insights and Forecast - by Printing Technology
- 5.1.1. Inkjet Printing
- 5.1.2. Screen Printing
- 5.1.3. Flexographic Printing
- 5.1.4. Other Printing Technologies
- 5.2. Market Analysis, Insights and Forecast - by End-user Industry
- 5.2.1. Consumer Electronics
- 5.2.2. Healthcare
- 5.2.3. Industrial
- 5.2.4. Automotive and Transportation
- 5.2.5. Other End-user Industries
- 5.3. Market Analysis, Insights and Forecast - by Region
- 5.3.1. North America
- 5.3.2. Europe
- 5.3.3. Asia Pacific
- 5.3.4. Rest of the World
- 5.1. Market Analysis, Insights and Forecast - by Printing Technology
- 6. North America Printed Image Sensors Industry Analysis, Insights and Forecast, 2019-2031
- 6.1. Market Analysis, Insights and Forecast - by Printing Technology
- 6.1.1. Inkjet Printing
- 6.1.2. Screen Printing
- 6.1.3. Flexographic Printing
- 6.1.4. Other Printing Technologies
- 6.2. Market Analysis, Insights and Forecast - by End-user Industry
- 6.2.1. Consumer Electronics
- 6.2.2. Healthcare
- 6.2.3. Industrial
- 6.2.4. Automotive and Transportation
- 6.2.5. Other End-user Industries
- 6.1. Market Analysis, Insights and Forecast - by Printing Technology
- 7. Europe Printed Image Sensors Industry Analysis, Insights and Forecast, 2019-2031
- 7.1. Market Analysis, Insights and Forecast - by Printing Technology
- 7.1.1. Inkjet Printing
- 7.1.2. Screen Printing
- 7.1.3. Flexographic Printing
- 7.1.4. Other Printing Technologies
- 7.2. Market Analysis, Insights and Forecast - by End-user Industry
- 7.2.1. Consumer Electronics
- 7.2.2. Healthcare
- 7.2.3. Industrial
- 7.2.4. Automotive and Transportation
- 7.2.5. Other End-user Industries
- 7.1. Market Analysis, Insights and Forecast - by Printing Technology
- 8. Asia Pacific Printed Image Sensors Industry Analysis, Insights and Forecast, 2019-2031
- 8.1. Market Analysis, Insights and Forecast - by Printing Technology
- 8.1.1. Inkjet Printing
- 8.1.2. Screen Printing
- 8.1.3. Flexographic Printing
- 8.1.4. Other Printing Technologies
- 8.2. Market Analysis, Insights and Forecast - by End-user Industry
- 8.2.1. Consumer Electronics
- 8.2.2. Healthcare
- 8.2.3. Industrial
- 8.2.4. Automotive and Transportation
- 8.2.5. Other End-user Industries
- 8.1. Market Analysis, Insights and Forecast - by Printing Technology
- 9. Rest of the World Printed Image Sensors Industry Analysis, Insights and Forecast, 2019-2031
- 9.1. Market Analysis, Insights and Forecast - by Printing Technology
- 9.1.1. Inkjet Printing
- 9.1.2. Screen Printing
- 9.1.3. Flexographic Printing
- 9.1.4. Other Printing Technologies
- 9.2. Market Analysis, Insights and Forecast - by End-user Industry
- 9.2.1. Consumer Electronics
- 9.2.2. Healthcare
- 9.2.3. Industrial
- 9.2.4. Automotive and Transportation
- 9.2.5. Other End-user Industries
- 9.1. Market Analysis, Insights and Forecast - by Printing Technology
- 10. North America Printed Image Sensors Industry Analysis, Insights and Forecast, 2019-2031
- 10.1. Market Analysis, Insights and Forecast - By Country/Sub-region
- 10.1.1 United States
- 10.1.2 Canada
- 10.1.3 Mexico
- 11. Europe Printed Image Sensors Industry Analysis, Insights and Forecast, 2019-2031
- 11.1. Market Analysis, Insights and Forecast - By Country/Sub-region
- 11.1.1 Germany
- 11.1.2 United Kingdom
- 11.1.3 France
- 11.1.4 Spain
- 11.1.5 Italy
- 11.1.6 Spain
- 11.1.7 Belgium
- 11.1.8 Netherland
- 11.1.9 Nordics
- 11.1.10 Rest of Europe
- 12. Asia Pacific Printed Image Sensors Industry Analysis, Insights and Forecast, 2019-2031
- 12.1. Market Analysis, Insights and Forecast - By Country/Sub-region
- 12.1.1 China
- 12.1.2 Japan
- 12.1.3 India
- 12.1.4 South Korea
- 12.1.5 Southeast Asia
- 12.1.6 Australia
- 12.1.7 Indonesia
- 12.1.8 Phillipes
- 12.1.9 Singapore
- 12.1.10 Thailandc
- 12.1.11 Rest of Asia Pacific
- 13. South America Printed Image Sensors Industry Analysis, Insights and Forecast, 2019-2031
- 13.1. Market Analysis, Insights and Forecast - By Country/Sub-region
- 13.1.1 Brazil
- 13.1.2 Argentina
- 13.1.3 Peru
- 13.1.4 Chile
- 13.1.5 Colombia
- 13.1.6 Ecuador
- 13.1.7 Venezuela
- 13.1.8 Rest of South America
- 14. North America Printed Image Sensors Industry Analysis, Insights and Forecast, 2019-2031
- 14.1. Market Analysis, Insights and Forecast - By Country/Sub-region
- 14.1.1 United States
- 14.1.2 Canada
- 14.1.3 Mexico
- 15. MEA Printed Image Sensors Industry Analysis, Insights and Forecast, 2019-2031
- 15.1. Market Analysis, Insights and Forecast - By Country/Sub-region
- 15.1.1 United Arab Emirates
- 15.1.2 Saudi Arabia
- 15.1.3 South Africa
- 15.1.4 Rest of Middle East and Africa
- 16. Competitive Analysis
- 16.1. Global Market Share Analysis 2024
- 16.2. Company Profiles
- 16.2.1 PolyIC GmbH & Co KG
- 16.2.1.1. Overview
- 16.2.1.2. Products
- 16.2.1.3. SWOT Analysis
- 16.2.1.4. Recent Developments
- 16.2.1.5. Financials (Based on Availability)
- 16.2.2 Plastic Logic
- 16.2.2.1. Overview
- 16.2.2.2. Products
- 16.2.2.3. SWOT Analysis
- 16.2.2.4. Recent Developments
- 16.2.2.5. Financials (Based on Availability)
- 16.2.3 Interlink Electronics
- 16.2.3.1. Overview
- 16.2.3.2. Products
- 16.2.3.3. SWOT Analysis
- 16.2.3.4. Recent Developments
- 16.2.3.5. Financials (Based on Availability)
- 16.2.4 Isorg
- 16.2.4.1. Overview
- 16.2.4.2. Products
- 16.2.4.3. SWOT Analysis
- 16.2.4.4. Recent Developments
- 16.2.4.5. Financials (Based on Availability)
- 16.2.5 Canatu Oy (Finland)
- 16.2.5.1. Overview
- 16.2.5.2. Products
- 16.2.5.3. SWOT Analysis
- 16.2.5.4. Recent Developments
- 16.2.5.5. Financials (Based on Availability)
- 16.2.6 FlexEnable Limited
- 16.2.6.1. Overview
- 16.2.6.2. Products
- 16.2.6.3. SWOT Analysis
- 16.2.6.4. Recent Developments
- 16.2.6.5. Financials (Based on Availability)
- 16.2.1 PolyIC GmbH & Co KG
List of Figures
- Figure 1: Global Printed Image Sensors Industry Revenue Breakdown (Million, %) by Region 2024 & 2032
- Figure 2: Global Printed Image Sensors Industry Volume Breakdown (K Unit, %) by Region 2024 & 2032
- Figure 3: North America Printed Image Sensors Industry Revenue (Million), by Country 2024 & 2032
- Figure 4: North America Printed Image Sensors Industry Volume (K Unit), by Country 2024 & 2032
- Figure 5: North America Printed Image Sensors Industry Revenue Share (%), by Country 2024 & 2032
- Figure 6: North America Printed Image Sensors Industry Volume Share (%), by Country 2024 & 2032
- Figure 7: Europe Printed Image Sensors Industry Revenue (Million), by Country 2024 & 2032
- Figure 8: Europe Printed Image Sensors Industry Volume (K Unit), by Country 2024 & 2032
- Figure 9: Europe Printed Image Sensors Industry Revenue Share (%), by Country 2024 & 2032
- Figure 10: Europe Printed Image Sensors Industry Volume Share (%), by Country 2024 & 2032
- Figure 11: Asia Pacific Printed Image Sensors Industry Revenue (Million), by Country 2024 & 2032
- Figure 12: Asia Pacific Printed Image Sensors Industry Volume (K Unit), by Country 2024 & 2032
- Figure 13: Asia Pacific Printed Image Sensors Industry Revenue Share (%), by Country 2024 & 2032
- Figure 14: Asia Pacific Printed Image Sensors Industry Volume Share (%), by Country 2024 & 2032
- Figure 15: South America Printed Image Sensors Industry Revenue (Million), by Country 2024 & 2032
- Figure 16: South America Printed Image Sensors Industry Volume (K Unit), by Country 2024 & 2032
- Figure 17: South America Printed Image Sensors Industry Revenue Share (%), by Country 2024 & 2032
- Figure 18: South America Printed Image Sensors Industry Volume Share (%), by Country 2024 & 2032
- Figure 19: North America Printed Image Sensors Industry Revenue (Million), by Country 2024 & 2032
- Figure 20: North America Printed Image Sensors Industry Volume (K Unit), by Country 2024 & 2032
- Figure 21: North America Printed Image Sensors Industry Revenue Share (%), by Country 2024 & 2032
- Figure 22: North America Printed Image Sensors Industry Volume Share (%), by Country 2024 & 2032
- Figure 23: MEA Printed Image Sensors Industry Revenue (Million), by Country 2024 & 2032
- Figure 24: MEA Printed Image Sensors Industry Volume (K Unit), by Country 2024 & 2032
- Figure 25: MEA Printed Image Sensors Industry Revenue Share (%), by Country 2024 & 2032
- Figure 26: MEA Printed Image Sensors Industry Volume Share (%), by Country 2024 & 2032
- Figure 27: North America Printed Image Sensors Industry Revenue (Million), by Printing Technology 2024 & 2032
- Figure 28: North America Printed Image Sensors Industry Volume (K Unit), by Printing Technology 2024 & 2032
- Figure 29: North America Printed Image Sensors Industry Revenue Share (%), by Printing Technology 2024 & 2032
- Figure 30: North America Printed Image Sensors Industry Volume Share (%), by Printing Technology 2024 & 2032
- Figure 31: North America Printed Image Sensors Industry Revenue (Million), by End-user Industry 2024 & 2032
- Figure 32: North America Printed Image Sensors Industry Volume (K Unit), by End-user Industry 2024 & 2032
- Figure 33: North America Printed Image Sensors Industry Revenue Share (%), by End-user Industry 2024 & 2032
- Figure 34: North America Printed Image Sensors Industry Volume Share (%), by End-user Industry 2024 & 2032
- Figure 35: North America Printed Image Sensors Industry Revenue (Million), by Country 2024 & 2032
- Figure 36: North America Printed Image Sensors Industry Volume (K Unit), by Country 2024 & 2032
- Figure 37: North America Printed Image Sensors Industry Revenue Share (%), by Country 2024 & 2032
- Figure 38: North America Printed Image Sensors Industry Volume Share (%), by Country 2024 & 2032
- Figure 39: Europe Printed Image Sensors Industry Revenue (Million), by Printing Technology 2024 & 2032
- Figure 40: Europe Printed Image Sensors Industry Volume (K Unit), by Printing Technology 2024 & 2032
- Figure 41: Europe Printed Image Sensors Industry Revenue Share (%), by Printing Technology 2024 & 2032
- Figure 42: Europe Printed Image Sensors Industry Volume Share (%), by Printing Technology 2024 & 2032
- Figure 43: Europe Printed Image Sensors Industry Revenue (Million), by End-user Industry 2024 & 2032
- Figure 44: Europe Printed Image Sensors Industry Volume (K Unit), by End-user Industry 2024 & 2032
- Figure 45: Europe Printed Image Sensors Industry Revenue Share (%), by End-user Industry 2024 & 2032
- Figure 46: Europe Printed Image Sensors Industry Volume Share (%), by End-user Industry 2024 & 2032
- Figure 47: Europe Printed Image Sensors Industry Revenue (Million), by Country 2024 & 2032
- Figure 48: Europe Printed Image Sensors Industry Volume (K Unit), by Country 2024 & 2032
- Figure 49: Europe Printed Image Sensors Industry Revenue Share (%), by Country 2024 & 2032
- Figure 50: Europe Printed Image Sensors Industry Volume Share (%), by Country 2024 & 2032
- Figure 51: Asia Pacific Printed Image Sensors Industry Revenue (Million), by Printing Technology 2024 & 2032
- Figure 52: Asia Pacific Printed Image Sensors Industry Volume (K Unit), by Printing Technology 2024 & 2032
- Figure 53: Asia Pacific Printed Image Sensors Industry Revenue Share (%), by Printing Technology 2024 & 2032
- Figure 54: Asia Pacific Printed Image Sensors Industry Volume Share (%), by Printing Technology 2024 & 2032
- Figure 55: Asia Pacific Printed Image Sensors Industry Revenue (Million), by End-user Industry 2024 & 2032
- Figure 56: Asia Pacific Printed Image Sensors Industry Volume (K Unit), by End-user Industry 2024 & 2032
- Figure 57: Asia Pacific Printed Image Sensors Industry Revenue Share (%), by End-user Industry 2024 & 2032
- Figure 58: Asia Pacific Printed Image Sensors Industry Volume Share (%), by End-user Industry 2024 & 2032
- Figure 59: Asia Pacific Printed Image Sensors Industry Revenue (Million), by Country 2024 & 2032
- Figure 60: Asia Pacific Printed Image Sensors Industry Volume (K Unit), by Country 2024 & 2032
- Figure 61: Asia Pacific Printed Image Sensors Industry Revenue Share (%), by Country 2024 & 2032
- Figure 62: Asia Pacific Printed Image Sensors Industry Volume Share (%), by Country 2024 & 2032
- Figure 63: Rest of the World Printed Image Sensors Industry Revenue (Million), by Printing Technology 2024 & 2032
- Figure 64: Rest of the World Printed Image Sensors Industry Volume (K Unit), by Printing Technology 2024 & 2032
- Figure 65: Rest of the World Printed Image Sensors Industry Revenue Share (%), by Printing Technology 2024 & 2032
- Figure 66: Rest of the World Printed Image Sensors Industry Volume Share (%), by Printing Technology 2024 & 2032
- Figure 67: Rest of the World Printed Image Sensors Industry Revenue (Million), by End-user Industry 2024 & 2032
- Figure 68: Rest of the World Printed Image Sensors Industry Volume (K Unit), by End-user Industry 2024 & 2032
- Figure 69: Rest of the World Printed Image Sensors Industry Revenue Share (%), by End-user Industry 2024 & 2032
- Figure 70: Rest of the World Printed Image Sensors Industry Volume Share (%), by End-user Industry 2024 & 2032
- Figure 71: Rest of the World Printed Image Sensors Industry Revenue (Million), by Country 2024 & 2032
- Figure 72: Rest of the World Printed Image Sensors Industry Volume (K Unit), by Country 2024 & 2032
- Figure 73: Rest of the World Printed Image Sensors Industry Revenue Share (%), by Country 2024 & 2032
- Figure 74: Rest of the World Printed Image Sensors Industry Volume Share (%), by Country 2024 & 2032
List of Tables
- Table 1: Global Printed Image Sensors Industry Revenue Million Forecast, by Region 2019 & 2032
- Table 2: Global Printed Image Sensors Industry Volume K Unit Forecast, by Region 2019 & 2032
- Table 3: Global Printed Image Sensors Industry Revenue Million Forecast, by Printing Technology 2019 & 2032
- Table 4: Global Printed Image Sensors Industry Volume K Unit Forecast, by Printing Technology 2019 & 2032
- Table 5: Global Printed Image Sensors Industry Revenue Million Forecast, by End-user Industry 2019 & 2032
- Table 6: Global Printed Image Sensors Industry Volume K Unit Forecast, by End-user Industry 2019 & 2032
- Table 7: Global Printed Image Sensors Industry Revenue Million Forecast, by Region 2019 & 2032
- Table 8: Global Printed Image Sensors Industry Volume K Unit Forecast, by Region 2019 & 2032
- Table 9: Global Printed Image Sensors Industry Revenue Million Forecast, by Country 2019 & 2032
- Table 10: Global Printed Image Sensors Industry Volume K Unit Forecast, by Country 2019 & 2032
- Table 11: United States Printed Image Sensors Industry Revenue (Million) Forecast, by Application 2019 & 2032
- Table 12: United States Printed Image Sensors Industry Volume (K Unit) Forecast, by Application 2019 & 2032
- Table 13: Canada Printed Image Sensors Industry Revenue (Million) Forecast, by Application 2019 & 2032
- Table 14: Canada Printed Image Sensors Industry Volume (K Unit) Forecast, by Application 2019 & 2032
- Table 15: Mexico Printed Image Sensors Industry Revenue (Million) Forecast, by Application 2019 & 2032
- Table 16: Mexico Printed Image Sensors Industry Volume (K Unit) Forecast, by Application 2019 & 2032
- Table 17: Global Printed Image Sensors Industry Revenue Million Forecast, by Country 2019 & 2032
- Table 18: Global Printed Image Sensors Industry Volume K Unit Forecast, by Country 2019 & 2032
- Table 19: Germany Printed Image Sensors Industry Revenue (Million) Forecast, by Application 2019 & 2032
- Table 20: Germany Printed Image Sensors Industry Volume (K Unit) Forecast, by Application 2019 & 2032
- Table 21: United Kingdom Printed Image Sensors Industry Revenue (Million) Forecast, by Application 2019 & 2032
- Table 22: United Kingdom Printed Image Sensors Industry Volume (K Unit) Forecast, by Application 2019 & 2032
- Table 23: France Printed Image Sensors Industry Revenue (Million) Forecast, by Application 2019 & 2032
- Table 24: France Printed Image Sensors Industry Volume (K Unit) Forecast, by Application 2019 & 2032
- Table 25: Spain Printed Image Sensors Industry Revenue (Million) Forecast, by Application 2019 & 2032
- Table 26: Spain Printed Image Sensors Industry Volume (K Unit) Forecast, by Application 2019 & 2032
- Table 27: Italy Printed Image Sensors Industry Revenue (Million) Forecast, by Application 2019 & 2032
- Table 28: Italy Printed Image Sensors Industry Volume (K Unit) Forecast, by Application 2019 & 2032
- Table 29: Spain Printed Image Sensors Industry Revenue (Million) Forecast, by Application 2019 & 2032
- Table 30: Spain Printed Image Sensors Industry Volume (K Unit) Forecast, by Application 2019 & 2032
- Table 31: Belgium Printed Image Sensors Industry Revenue (Million) Forecast, by Application 2019 & 2032
- Table 32: Belgium Printed Image Sensors Industry Volume (K Unit) Forecast, by Application 2019 & 2032
- Table 33: Netherland Printed Image Sensors Industry Revenue (Million) Forecast, by Application 2019 & 2032
- Table 34: Netherland Printed Image Sensors Industry Volume (K Unit) Forecast, by Application 2019 & 2032
- Table 35: Nordics Printed Image Sensors Industry Revenue (Million) Forecast, by Application 2019 & 2032
- Table 36: Nordics Printed Image Sensors Industry Volume (K Unit) Forecast, by Application 2019 & 2032
- Table 37: Rest of Europe Printed Image Sensors Industry Revenue (Million) Forecast, by Application 2019 & 2032
- Table 38: Rest of Europe Printed Image Sensors Industry Volume (K Unit) Forecast, by Application 2019 & 2032
- Table 39: Global Printed Image Sensors Industry Revenue Million Forecast, by Country 2019 & 2032
- Table 40: Global Printed Image Sensors Industry Volume K Unit Forecast, by Country 2019 & 2032
- Table 41: China Printed Image Sensors Industry Revenue (Million) Forecast, by Application 2019 & 2032
- Table 42: China Printed Image Sensors Industry Volume (K Unit) Forecast, by Application 2019 & 2032
- Table 43: Japan Printed Image Sensors Industry Revenue (Million) Forecast, by Application 2019 & 2032
- Table 44: Japan Printed Image Sensors Industry Volume (K Unit) Forecast, by Application 2019 & 2032
- Table 45: India Printed Image Sensors Industry Revenue (Million) Forecast, by Application 2019 & 2032
- Table 46: India Printed Image Sensors Industry Volume (K Unit) Forecast, by Application 2019 & 2032
- Table 47: South Korea Printed Image Sensors Industry Revenue (Million) Forecast, by Application 2019 & 2032
- Table 48: South Korea Printed Image Sensors Industry Volume (K Unit) Forecast, by Application 2019 & 2032
- Table 49: Southeast Asia Printed Image Sensors Industry Revenue (Million) Forecast, by Application 2019 & 2032
- Table 50: Southeast Asia Printed Image Sensors Industry Volume (K Unit) Forecast, by Application 2019 & 2032
- Table 51: Australia Printed Image Sensors Industry Revenue (Million) Forecast, by Application 2019 & 2032
- Table 52: Australia Printed Image Sensors Industry Volume (K Unit) Forecast, by Application 2019 & 2032
- Table 53: Indonesia Printed Image Sensors Industry Revenue (Million) Forecast, by Application 2019 & 2032
- Table 54: Indonesia Printed Image Sensors Industry Volume (K Unit) Forecast, by Application 2019 & 2032
- Table 55: Phillipes Printed Image Sensors Industry Revenue (Million) Forecast, by Application 2019 & 2032
- Table 56: Phillipes Printed Image Sensors Industry Volume (K Unit) Forecast, by Application 2019 & 2032
- Table 57: Singapore Printed Image Sensors Industry Revenue (Million) Forecast, by Application 2019 & 2032
- Table 58: Singapore Printed Image Sensors Industry Volume (K Unit) Forecast, by Application 2019 & 2032
- Table 59: Thailandc Printed Image Sensors Industry Revenue (Million) Forecast, by Application 2019 & 2032
- Table 60: Thailandc Printed Image Sensors Industry Volume (K Unit) Forecast, by Application 2019 & 2032
- Table 61: Rest of Asia Pacific Printed Image Sensors Industry Revenue (Million) Forecast, by Application 2019 & 2032
- Table 62: Rest of Asia Pacific Printed Image Sensors Industry Volume (K Unit) Forecast, by Application 2019 & 2032
- Table 63: Global Printed Image Sensors Industry Revenue Million Forecast, by Country 2019 & 2032
- Table 64: Global Printed Image Sensors Industry Volume K Unit Forecast, by Country 2019 & 2032
- Table 65: Brazil Printed Image Sensors Industry Revenue (Million) Forecast, by Application 2019 & 2032
- Table 66: Brazil Printed Image Sensors Industry Volume (K Unit) Forecast, by Application 2019 & 2032
- Table 67: Argentina Printed Image Sensors Industry Revenue (Million) Forecast, by Application 2019 & 2032
- Table 68: Argentina Printed Image Sensors Industry Volume (K Unit) Forecast, by Application 2019 & 2032
- Table 69: Peru Printed Image Sensors Industry Revenue (Million) Forecast, by Application 2019 & 2032
- Table 70: Peru Printed Image Sensors Industry Volume (K Unit) Forecast, by Application 2019 & 2032
- Table 71: Chile Printed Image Sensors Industry Revenue (Million) Forecast, by Application 2019 & 2032
- Table 72: Chile Printed Image Sensors Industry Volume (K Unit) Forecast, by Application 2019 & 2032
- Table 73: Colombia Printed Image Sensors Industry Revenue (Million) Forecast, by Application 2019 & 2032
- Table 74: Colombia Printed Image Sensors Industry Volume (K Unit) Forecast, by Application 2019 & 2032
- Table 75: Ecuador Printed Image Sensors Industry Revenue (Million) Forecast, by Application 2019 & 2032
- Table 76: Ecuador Printed Image Sensors Industry Volume (K Unit) Forecast, by Application 2019 & 2032
- Table 77: Venezuela Printed Image Sensors Industry Revenue (Million) Forecast, by Application 2019 & 2032
- Table 78: Venezuela Printed Image Sensors Industry Volume (K Unit) Forecast, by Application 2019 & 2032
- Table 79: Rest of South America Printed Image Sensors Industry Revenue (Million) Forecast, by Application 2019 & 2032
- Table 80: Rest of South America Printed Image Sensors Industry Volume (K Unit) Forecast, by Application 2019 & 2032
- Table 81: Global Printed Image Sensors Industry Revenue Million Forecast, by Country 2019 & 2032
- Table 82: Global Printed Image Sensors Industry Volume K Unit Forecast, by Country 2019 & 2032
- Table 83: United States Printed Image Sensors Industry Revenue (Million) Forecast, by Application 2019 & 2032
- Table 84: United States Printed Image Sensors Industry Volume (K Unit) Forecast, by Application 2019 & 2032
- Table 85: Canada Printed Image Sensors Industry Revenue (Million) Forecast, by Application 2019 & 2032
- Table 86: Canada Printed Image Sensors Industry Volume (K Unit) Forecast, by Application 2019 & 2032
- Table 87: Mexico Printed Image Sensors Industry Revenue (Million) Forecast, by Application 2019 & 2032
- Table 88: Mexico Printed Image Sensors Industry Volume (K Unit) Forecast, by Application 2019 & 2032
- Table 89: Global Printed Image Sensors Industry Revenue Million Forecast, by Country 2019 & 2032
- Table 90: Global Printed Image Sensors Industry Volume K Unit Forecast, by Country 2019 & 2032
- Table 91: United Arab Emirates Printed Image Sensors Industry Revenue (Million) Forecast, by Application 2019 & 2032
- Table 92: United Arab Emirates Printed Image Sensors Industry Volume (K Unit) Forecast, by Application 2019 & 2032
- Table 93: Saudi Arabia Printed Image Sensors Industry Revenue (Million) Forecast, by Application 2019 & 2032
- Table 94: Saudi Arabia Printed Image Sensors Industry Volume (K Unit) Forecast, by Application 2019 & 2032
- Table 95: South Africa Printed Image Sensors Industry Revenue (Million) Forecast, by Application 2019 & 2032
- Table 96: South Africa Printed Image Sensors Industry Volume (K Unit) Forecast, by Application 2019 & 2032
- Table 97: Rest of Middle East and Africa Printed Image Sensors Industry Revenue (Million) Forecast, by Application 2019 & 2032
- Table 98: Rest of Middle East and Africa Printed Image Sensors Industry Volume (K Unit) Forecast, by Application 2019 & 2032
- Table 99: Global Printed Image Sensors Industry Revenue Million Forecast, by Printing Technology 2019 & 2032
- Table 100: Global Printed Image Sensors Industry Volume K Unit Forecast, by Printing Technology 2019 & 2032
- Table 101: Global Printed Image Sensors Industry Revenue Million Forecast, by End-user Industry 2019 & 2032
- Table 102: Global Printed Image Sensors Industry Volume K Unit Forecast, by End-user Industry 2019 & 2032
- Table 103: Global Printed Image Sensors Industry Revenue Million Forecast, by Country 2019 & 2032
- Table 104: Global Printed Image Sensors Industry Volume K Unit Forecast, by Country 2019 & 2032
- Table 105: Global Printed Image Sensors Industry Revenue Million Forecast, by Printing Technology 2019 & 2032
- Table 106: Global Printed Image Sensors Industry Volume K Unit Forecast, by Printing Technology 2019 & 2032
- Table 107: Global Printed Image Sensors Industry Revenue Million Forecast, by End-user Industry 2019 & 2032
- Table 108: Global Printed Image Sensors Industry Volume K Unit Forecast, by End-user Industry 2019 & 2032
- Table 109: Global Printed Image Sensors Industry Revenue Million Forecast, by Country 2019 & 2032
- Table 110: Global Printed Image Sensors Industry Volume K Unit Forecast, by Country 2019 & 2032
- Table 111: Global Printed Image Sensors Industry Revenue Million Forecast, by Printing Technology 2019 & 2032
- Table 112: Global Printed Image Sensors Industry Volume K Unit Forecast, by Printing Technology 2019 & 2032
- Table 113: Global Printed Image Sensors Industry Revenue Million Forecast, by End-user Industry 2019 & 2032
- Table 114: Global Printed Image Sensors Industry Volume K Unit Forecast, by End-user Industry 2019 & 2032
- Table 115: Global Printed Image Sensors Industry Revenue Million Forecast, by Country 2019 & 2032
- Table 116: Global Printed Image Sensors Industry Volume K Unit Forecast, by Country 2019 & 2032
- Table 117: Global Printed Image Sensors Industry Revenue Million Forecast, by Printing Technology 2019 & 2032
- Table 118: Global Printed Image Sensors Industry Volume K Unit Forecast, by Printing Technology 2019 & 2032
- Table 119: Global Printed Image Sensors Industry Revenue Million Forecast, by End-user Industry 2019 & 2032
- Table 120: Global Printed Image Sensors Industry Volume K Unit Forecast, by End-user Industry 2019 & 2032
- Table 121: Global Printed Image Sensors Industry Revenue Million Forecast, by Country 2019 & 2032
- Table 122: Global Printed Image Sensors Industry Volume K Unit Forecast, by Country 2019 & 2032
Frequently Asked Questions
1. What is the projected Compound Annual Growth Rate (CAGR) of the Printed Image Sensors Industry?
The projected CAGR is approximately 12.20%.
2. Which companies are prominent players in the Printed Image Sensors Industry?
Key companies in the market include PolyIC GmbH & Co KG, Plastic Logic, Interlink Electronics, Isorg, Canatu Oy (Finland), FlexEnable Limited.
3. What are the main segments of the Printed Image Sensors Industry?
The market segments include Printing Technology, End-user Industry.
4. Can you provide details about the market size?
The market size is estimated to be USD XX Million as of 2022.
5. What are some drivers contributing to market growth?
; Use of Integrated Dashboards in Advanced Driver Assistance System (ADAS) in Automotive Sector; Increasing Usage of CMOS Sensors in Consumer Electronics Products.
6. What are the notable trends driving market growth?
ADAS Production in Automotive Sector is Driving the Market Growth.
7. Are there any restraints impacting market growth?
; Complex Manufacturing Process.
8. Can you provide examples of recent developments in the market?
N/A
9. What pricing options are available for accessing the report?
Pricing options include single-user, multi-user, and enterprise licenses priced at USD 4750, USD 5250, and USD 8750 respectively.
10. Is the market size provided in terms of value or volume?
The market size is provided in terms of value, measured in Million and volume, measured in K Unit.
11. Are there any specific market keywords associated with the report?
Yes, the market keyword associated with the report is "Printed Image Sensors Industry," which aids in identifying and referencing the specific market segment covered.
12. How do I determine which pricing option suits my needs best?
The pricing options vary based on user requirements and access needs. Individual users may opt for single-user licenses, while businesses requiring broader access may choose multi-user or enterprise licenses for cost-effective access to the report.
13. Are there any additional resources or data provided in the Printed Image Sensors Industry report?
While the report offers comprehensive insights, it's advisable to review the specific contents or supplementary materials provided to ascertain if additional resources or data are available.
14. How can I stay updated on further developments or reports in the Printed Image Sensors Industry?
To stay informed about further developments, trends, and reports in the Printed Image Sensors Industry, consider subscribing to industry newsletters, following relevant companies and organizations, or regularly checking reputable industry news sources and publications.
Methodology
Step 1 - Identification of Relevant Samples Size from Population Database


Step 2 - Approaches for Defining Global Market Size (Value, Volume* & Price*)

Note*: In applicable scenarios
Step 3 - Data Sources
Primary Research
- Web Analytics
- Survey Reports
- Research Institute
- Latest Research Reports
- Opinion Leaders
Secondary Research
- Annual Reports
- White Paper
- Latest Press Release
- Industry Association
- Paid Database
- Investor Presentations

Step 4 - Data Triangulation
Involves using different sources of information in order to increase the validity of a study
These sources are likely to be stakeholders in a program - participants, other researchers, program staff, other community members, and so on.
Then we put all data in single framework & apply various statistical tools to find out the dynamic on the market.
During the analysis stage, feedback from the stakeholder groups would be compared to determine areas of agreement as well as areas of divergence
