

Key Insights
The Non-Destructive Testing (NDT) market in power generation is experiencing significant expansion, driven by the critical need to maintain aging power infrastructure. Projected to reach $4.18 billion by 2025, the market demonstrates a Compound Annual Growth Rate (CAGR) of 6.24%. Key growth catalysts include stringent safety regulations, the escalating demand for renewable energy sources requiring rigorous quality assurance, and continuous advancements in NDT technologies. The imperative to prevent costly failures and ensure operational safety in existing power plants worldwide fuels this demand, further amplified by rising global energy consumption and the transition to cleaner energy. The services segment leads the market, followed by equipment, with radiography, ultrasonic, and visual inspection techniques dominating the testing methods. Leading companies like Yxlon International, Intertek, Eddyfi, and SGS are actively investing in R&D to enhance NDT efficiency and accuracy. The Asia Pacific region, particularly China and India, is poised for robust growth due to rapid industrialization and infrastructure development.
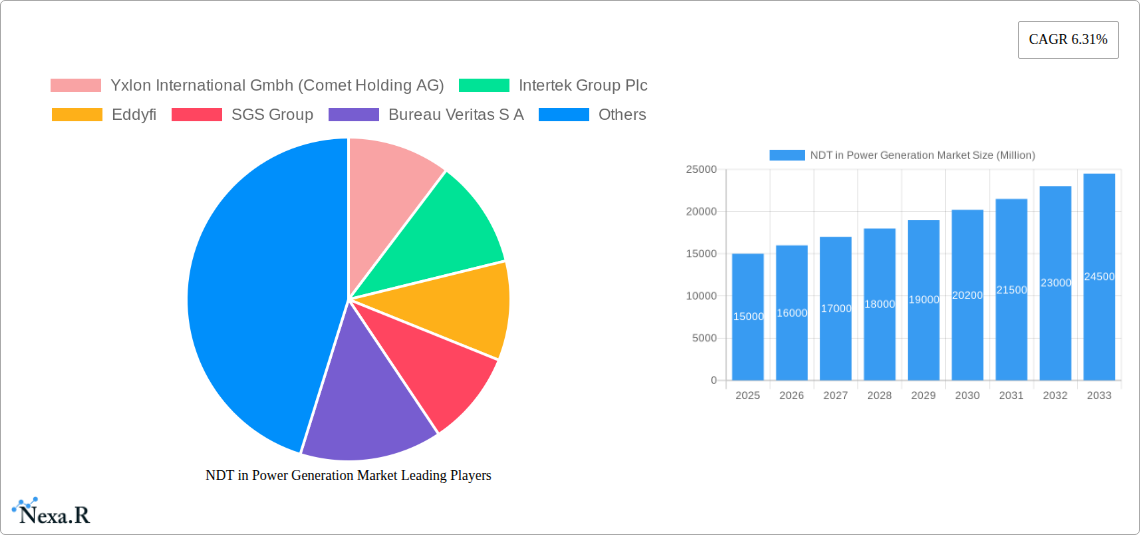
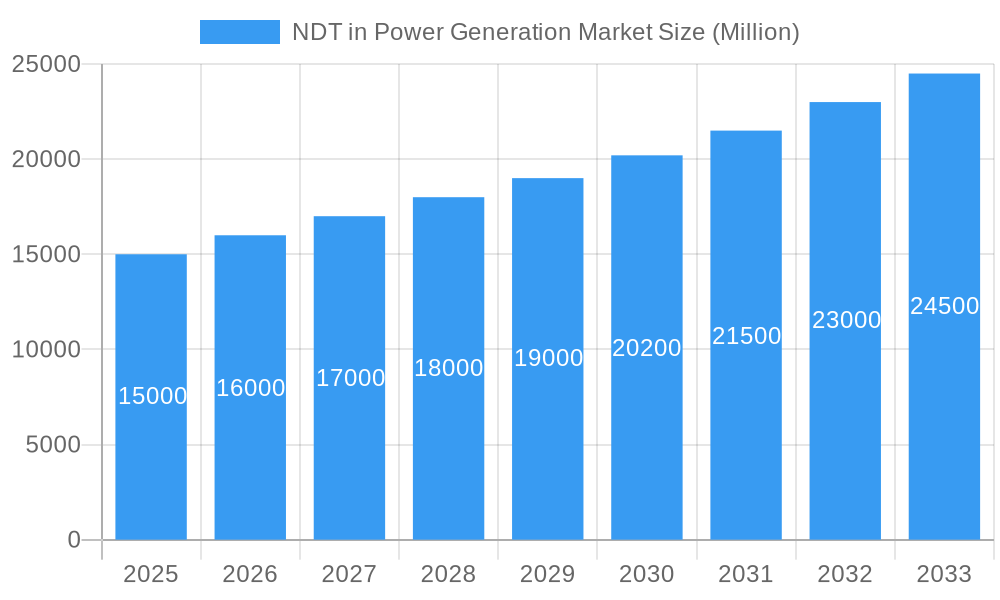
NDT in Power Generation Market Market Size (In Billion)
The competitive landscape features a blend of established multinational corporations and specialized NDT service providers. Innovation and unique service offerings are enabling smaller companies to gain prominence, complementing the brand recognition and global presence of larger players. Future market dynamics will be shaped by government mandates on plant safety, the integration of automation and data analytics in NDT processes, and the adoption of advanced testing methodologies. The development of digital twins for power plants is also expected to foster growth by enabling proactive maintenance and minimizing downtime. Sustained R&D investments by key industry players will focus on improving NDT speed, accuracy, and cost-effectiveness, promoting wider industry adoption.
NDT in Power Generation Market Company Market Share
This comprehensive report offers an in-depth analysis of the Non-Destructive Testing (NDT) market in the power generation sector, providing critical insights for industry professionals, investors, and strategic decision-makers. The study covers the period up to 2033, with a base year of 2025. It examines market dynamics, growth trajectories, regional trends, product segments, key participants, and emerging opportunities, presenting a holistic view of this vital industry. Expect detailed quantitative and qualitative analyses, alongside forward-looking projections to effectively navigate the complexities of the NDT power generation market.
NDT in Power Generation Market Market Dynamics & Structure
The NDT in power generation market is characterized by a moderately concentrated landscape, with several key players holding significant market share. The market size in 2025 is estimated at xx Million, with a projected value of xx Million by 2033. Technological innovation, particularly in AI-powered inspection techniques, is a major driver of growth. Stringent regulatory frameworks and safety standards in the power generation sector are also influencing market expansion. The industry witnesses continuous mergers and acquisitions (M&A) activity, consolidating market share and enhancing technological capabilities. Competitive product substitutes, such as advanced robotic inspection systems, are emerging, posing both challenges and opportunities.
Market Structure:
- Market Concentration: Moderately concentrated, with top 10 players holding approximately xx% of market share in 2025.
- Technological Innovation: Strong focus on AI, automation, and improved data analytics for faster and more efficient inspections.
- Regulatory Framework: Stringent safety regulations and compliance standards driving demand for reliable NDT services and equipment.
- M&A Activity: Significant M&A activity observed in recent years, with approximately xx deals completed between 2019 and 2024, indicating consolidation and strategic expansion within the market. This includes acquisitions like Applus+'s acquisition of Inecosa and Adícora in 2021.
- End-User Demographics: Primarily large power generation companies, independent power producers (IPPs), and nuclear power plant operators.
- Competitive Substitutes: Advanced robotic systems and other innovative inspection technologies present competitive pressure.
NDT in Power Generation Market Growth Trends & Insights
The NDT market within the power generation sector is experiencing robust growth, driven by the increasing demand for reliable and efficient inspection and maintenance practices across different power generation sources. The market exhibits a Compound Annual Growth Rate (CAGR) of xx% during the forecast period (2025-2033). This growth is attributed to factors such as aging infrastructure requiring frequent inspections, stringent safety regulations, and the rising adoption of advanced NDT technologies. Technological disruptions, such as the integration of Artificial Intelligence (AI) and machine learning, are further accelerating market growth, improving accuracy and reducing inspection time. Consumer behavior shifts towards increased prioritization of safety and reliability are also boosting demand. Market penetration of advanced NDT technologies is expected to increase from xx% in 2025 to xx% by 2033.
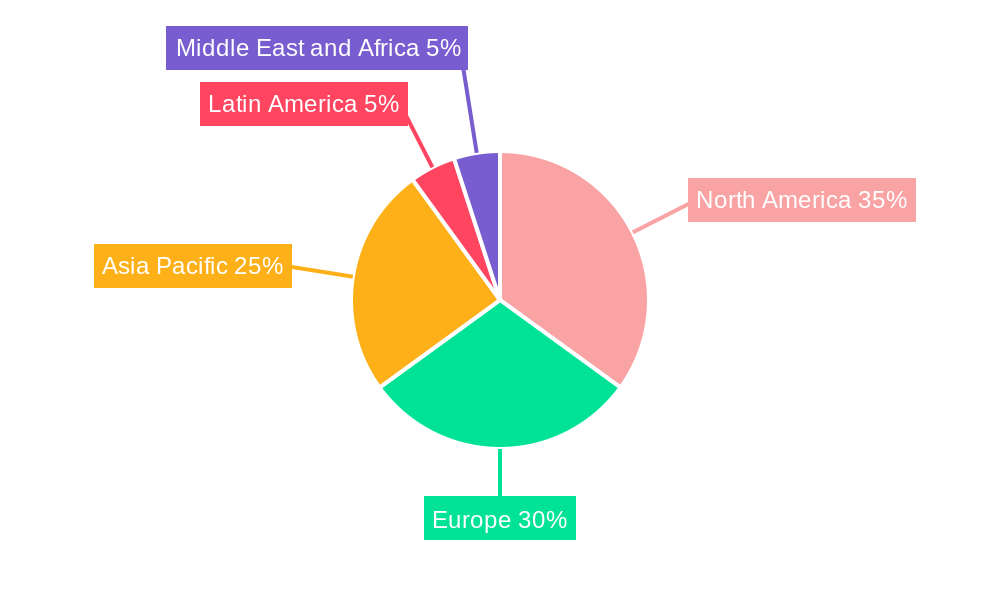
Dominant Regions, Countries, or Segments in NDT in Power Generation Market
The North American region currently holds the largest market share, followed by Europe and Asia-Pacific. This dominance is driven by factors such as the presence of a large number of power plants, stringent safety regulations, and substantial investments in infrastructure maintenance. The substantial growth of renewable energy sources further fuels the expansion of the NDT market, particularly within the solar and wind sectors. Within the testing technologies segment, Ultrasonic Testing (UT) and Radiography Testing (RT) account for the largest market share, due to their wide applicability and established reliability in detecting various defects.
Key Drivers:
- Stringent Safety Regulations: Mandated inspections and rigorous compliance standards contribute to high demand for NDT services.
- Aging Infrastructure: Existing power plants require more frequent inspections, creating a significant market opportunity.
- Growth of Renewable Energy: The expansion of renewable energy sources requires robust NDT for quality control and asset monitoring.
- Technological Advancements: AI-powered inspection methods enhance efficiency and accuracy, driving market expansion.
Dominant Segments:
- Ultrasonic Testing (UT): xx% market share in 2025, driven by its versatility and capability to detect a wide range of defects.
- Radiography Testing (RT): xx% market share in 2025, favored for its ability to provide high-resolution images of internal structures.
- North America: Holds the largest regional market share in 2025 due to established infrastructure, stringent regulations, and significant investment in power plant maintenance.
NDT in Power Generation Market Product Landscape
The NDT product landscape is witnessing significant innovation, with manufacturers focusing on developing advanced and portable equipment featuring AI capabilities. Products are designed with improved accuracy, user-friendliness, and enhanced data analysis features. These advancements streamline inspection processes, reducing downtime and improving overall efficiency. Key selling propositions include real-time data analysis, cloud-based data management, and reduced inspection times. The integration of AI and advanced algorithms significantly improves the accuracy and speed of defect detection.
Key Drivers, Barriers & Challenges in NDT in Power Generation Market
Key Drivers:
- Stringent safety regulations and compliance mandates are driving the adoption of NDT practices.
- The aging infrastructure of many power generation plants necessitates frequent inspections.
- Growth in renewable energy sources, like solar and wind, necessitates advanced NDT for quality control.
Challenges and Restraints:
- High initial investment costs for advanced NDT equipment can deter smaller companies.
- Skilled labor shortages in NDT expertise pose a significant challenge.
- Intense competition among established players and emerging technologies creates pressure on pricing.
Emerging Opportunities in NDT in Power Generation Market
The increasing use of drones and robots for remote inspections presents a significant opportunity for the market to expand its reach into inaccessible areas. The development of AI-powered predictive maintenance models using NDT data allows for proactive maintenance scheduling, reducing downtime and operational costs. The integration of blockchain technology for secure and transparent data management is another emerging trend with the potential to revolutionize the industry.
Growth Accelerators in the NDT in Power Generation Market Industry
Strategic partnerships between NDT technology providers and power generation companies are accelerating market growth. The development of sophisticated data analytics platforms for extracting actionable insights from NDT data is driving the adoption of advanced techniques. Expansion into emerging markets, especially those with developing power generation infrastructures, presents substantial opportunities for growth.
Key Players Shaping the NDT in Power Generation Market Market
Notable Milestones in NDT in Power Generation Market Sector
- June 2022: ALEIA and Omexom NDT Engineering & Services launched the AUTEND project, utilizing AI to accelerate nuclear power plant inspections.
- April 2021: IR Supplies and Services partnered with Creative Electron, enhancing NDT capabilities for Canadian power generation organizations.
- March 2021: Applus+ acquired Inecosa and Adícora, expanding its presence in the power generation and renewable energy sectors.
In-Depth NDT in Power Generation Market Market Outlook
The future of the NDT market in power generation is bright, driven by continued technological advancements, increased regulatory scrutiny, and the growth of renewable energy sources. The integration of AI, automation, and advanced data analytics is poised to further revolutionize inspection practices, increasing efficiency and reducing costs. Strategic partnerships and collaborations are creating a more integrated and efficient ecosystem, leading to accelerated market expansion and the development of innovative solutions that address the unique challenges of power generation maintenance.
NDT in Power Generation Market Segmentation
-
1. Type
- 1.1. Services
- 1.2. Equipment
-
2. Testing Technology
- 2.1. Radiography Testing
- 2.2. Ultrasonic Testing
- 2.3. Visual Inspection Testing
- 2.4. Eddy Current Testing
- 2.5. Other Testing Technologies
NDT in Power Generation Market Segmentation By Geography
-
1. North America
- 1.1. United States
- 1.2. Canada
-
2. Europe
- 2.1. United Kingdom
- 2.2. Germany
- 2.3. France
- 2.4. Rest of Europe
-
3. Asia Pacific
- 3.1. China
- 3.2. Japan
- 3.3. India
- 3.4. Rest of Asia Pacific
- 4. Latin America
- 5. Middle East and Africa
NDT in Power Generation Market Regional Market Share
Geographic Coverage of NDT in Power Generation Market
NDT in Power Generation Market REPORT HIGHLIGHTS
| Aspects | Details |
|---|---|
| Study Period | 2020-2034 |
| Base Year | 2025 |
| Estimated Year | 2026 |
| Forecast Period | 2026-2034 |
| Historical Period | 2020-2025 |
| Growth Rate | CAGR of 6.24% from 2020-2034 |
| Segmentation |
|
Table of Contents
- 1. Introduction
- 1.1. Research Scope
- 1.2. Market Segmentation
- 1.3. Research Objective
- 1.4. Definitions and Assumptions
- 2. Executive Summary
- 2.1. Market Snapshot
- 3. Market Dynamics
- 3.1. Market Drivers
- 3.2. Market Restrains
- 3.3. Market Trends
- 3.4. Market Opportunities
- 4. Market Factor Analysis
- 4.1. Porters Five Forces
- 4.1.1. Bargaining Power of Suppliers
- 4.1.2. Bargaining Power of Buyers
- 4.1.3. Threat of New Entrants
- 4.1.4. Threat of Substitutes
- 4.1.5. Competitive Rivalry
- 4.2. PESTEL analysis
- 4.3. BCG Analysis
- 4.3.1. Stars (High Growth, High Market Share)
- 4.3.2. Cash Cows (Low Growth, High Market Share)
- 4.3.3. Question Mark (High Growth, Low Market Share)
- 4.3.4. Dogs (Low Growth, Low Market Share)
- 4.4. Ansoff Matrix Analysis
- 4.5. Supply Chain Analysis
- 4.6. Regulatory Landscape
- 4.7. Current Market Potential and Opportunity Assessment (TAM–SAM–SOM Framework)
- 4.8. NRP Analyst Note
- 4.1. Porters Five Forces
- 5. Market Analysis, Insights and Forecast 2021-2033
- 5.1. Market Analysis, Insights and Forecast - by Type
- 5.1.1. Services
- 5.1.2. Equipment
- 5.2. Market Analysis, Insights and Forecast - by Testing Technology
- 5.2.1. Radiography Testing
- 5.2.2. Ultrasonic Testing
- 5.2.3. Visual Inspection Testing
- 5.2.4. Eddy Current Testing
- 5.2.5. Other Testing Technologies
- 5.3. Market Analysis, Insights and Forecast - by Region
- 5.3.1. North America
- 5.3.2. Europe
- 5.3.3. Asia Pacific
- 5.3.4. Latin America
- 5.3.5. Middle East and Africa
- 5.1. Market Analysis, Insights and Forecast - by Type
- 6. Global NDT in Power Generation Market Analysis, Insights and Forecast, 2021-2033
- 6.1. Market Analysis, Insights and Forecast - by Type
- 6.1.1. Services
- 6.1.2. Equipment
- 6.2. Market Analysis, Insights and Forecast - by Testing Technology
- 6.2.1. Radiography Testing
- 6.2.2. Ultrasonic Testing
- 6.2.3. Visual Inspection Testing
- 6.2.4. Eddy Current Testing
- 6.2.5. Other Testing Technologies
- 6.1. Market Analysis, Insights and Forecast - by Type
- 7. North America NDT in Power Generation Market Analysis, Insights and Forecast, 2020-2032
- 7.1. Market Analysis, Insights and Forecast - by Type
- 7.1.1. Services
- 7.1.2. Equipment
- 7.2. Market Analysis, Insights and Forecast - by Testing Technology
- 7.2.1. Radiography Testing
- 7.2.2. Ultrasonic Testing
- 7.2.3. Visual Inspection Testing
- 7.2.4. Eddy Current Testing
- 7.2.5. Other Testing Technologies
- 7.1. Market Analysis, Insights and Forecast - by Type
- 8. Europe NDT in Power Generation Market Analysis, Insights and Forecast, 2020-2032
- 8.1. Market Analysis, Insights and Forecast - by Type
- 8.1.1. Services
- 8.1.2. Equipment
- 8.2. Market Analysis, Insights and Forecast - by Testing Technology
- 8.2.1. Radiography Testing
- 8.2.2. Ultrasonic Testing
- 8.2.3. Visual Inspection Testing
- 8.2.4. Eddy Current Testing
- 8.2.5. Other Testing Technologies
- 8.1. Market Analysis, Insights and Forecast - by Type
- 9. Asia Pacific NDT in Power Generation Market Analysis, Insights and Forecast, 2020-2032
- 9.1. Market Analysis, Insights and Forecast - by Type
- 9.1.1. Services
- 9.1.2. Equipment
- 9.2. Market Analysis, Insights and Forecast - by Testing Technology
- 9.2.1. Radiography Testing
- 9.2.2. Ultrasonic Testing
- 9.2.3. Visual Inspection Testing
- 9.2.4. Eddy Current Testing
- 9.2.5. Other Testing Technologies
- 9.1. Market Analysis, Insights and Forecast - by Type
- 10. Latin America NDT in Power Generation Market Analysis, Insights and Forecast, 2020-2032
- 10.1. Market Analysis, Insights and Forecast - by Type
- 10.1.1. Services
- 10.1.2. Equipment
- 10.2. Market Analysis, Insights and Forecast - by Testing Technology
- 10.2.1. Radiography Testing
- 10.2.2. Ultrasonic Testing
- 10.2.3. Visual Inspection Testing
- 10.2.4. Eddy Current Testing
- 10.2.5. Other Testing Technologies
- 10.1. Market Analysis, Insights and Forecast - by Type
- 11. Middle East and Africa NDT in Power Generation Market Analysis, Insights and Forecast, 2020-2032
- 11.1. Market Analysis, Insights and Forecast - by Type
- 11.1.1. Services
- 11.1.2. Equipment
- 11.2. Market Analysis, Insights and Forecast - by Testing Technology
- 11.2.1. Radiography Testing
- 11.2.2. Ultrasonic Testing
- 11.2.3. Visual Inspection Testing
- 11.2.4. Eddy Current Testing
- 11.2.5. Other Testing Technologies
- 11.1. Market Analysis, Insights and Forecast - by Type
- 12. Competitive Analysis
- 12.1. Company Profiles
- 12.1.1 Yxlon International Gmbh (Comet Holding AG)
- 12.1.1.1. Company Overview
- 12.1.1.2. Products
- 12.1.1.3. Company Financials
- 12.1.1.4. SWOT Analysis
- 12.1.2 Intertek Group Plc
- 12.1.2.1. Company Overview
- 12.1.2.2. Products
- 12.1.2.3. Company Financials
- 12.1.2.4. SWOT Analysis
- 12.1.3 Eddyfi
- 12.1.3.1. Company Overview
- 12.1.3.2. Products
- 12.1.3.3. Company Financials
- 12.1.3.4. SWOT Analysis
- 12.1.4 SGS Group
- 12.1.4.1. Company Overview
- 12.1.4.2. Products
- 12.1.4.3. Company Financials
- 12.1.4.4. SWOT Analysis
- 12.1.5 Bureau Veritas S A
- 12.1.5.1. Company Overview
- 12.1.5.2. Products
- 12.1.5.3. Company Financials
- 12.1.5.4. SWOT Analysis
- 12.1.6 Fujifilm Corporation
- 12.1.6.1. Company Overview
- 12.1.6.2. Products
- 12.1.6.3. Company Financials
- 12.1.6.4. SWOT Analysis
- 12.1.7 Mistras Group Inc
- 12.1.7.1. Company Overview
- 12.1.7.2. Products
- 12.1.7.3. Company Financials
- 12.1.7.4. SWOT Analysis
- 12.1.8 Zetec Inc
- 12.1.8.1. Company Overview
- 12.1.8.2. Products
- 12.1.8.3. Company Financials
- 12.1.8.4. SWOT Analysis
- 12.1.9 Applus+ Services Technologies S L
- 12.1.9.1. Company Overview
- 12.1.9.2. Products
- 12.1.9.3. Company Financials
- 12.1.9.4. SWOT Analysis
- 12.1.10 Baker Hughes Company
- 12.1.10.1. Company Overview
- 12.1.10.2. Products
- 12.1.10.3. Company Financials
- 12.1.10.4. SWOT Analysis
- 12.1.11 Team Inc *List Not Exhaustive
- 12.1.11.1. Company Overview
- 12.1.11.2. Products
- 12.1.11.3. Company Financials
- 12.1.11.4. SWOT Analysis
- 12.1.12 Olympus Corporation
- 12.1.12.1. Company Overview
- 12.1.12.2. Products
- 12.1.12.3. Company Financials
- 12.1.12.4. SWOT Analysis
- 12.1.1 Yxlon International Gmbh (Comet Holding AG)
- 12.2. Market Entropy
- 12.2.1 Company's Key Areas Served
- 12.2.2 Recent Developments
- 12.3. Company Market Share Analysis 2025
- 12.3.1 Top 5 Companies Market Share Analysis
- 12.3.2 Top 3 Companies Market Share Analysis
- 12.4. List of Potential Customers
- 13. Research Methodology
List of Figures
- Figure 1: Global NDT in Power Generation Market Revenue Breakdown (billion, %) by Region 2025 & 2033
- Figure 2: North America NDT in Power Generation Market Revenue (billion), by Type 2025 & 2033
- Figure 3: North America NDT in Power Generation Market Revenue Share (%), by Type 2025 & 2033
- Figure 4: North America NDT in Power Generation Market Revenue (billion), by Testing Technology 2025 & 2033
- Figure 5: North America NDT in Power Generation Market Revenue Share (%), by Testing Technology 2025 & 2033
- Figure 6: North America NDT in Power Generation Market Revenue (billion), by Country 2025 & 2033
- Figure 7: North America NDT in Power Generation Market Revenue Share (%), by Country 2025 & 2033
- Figure 8: Europe NDT in Power Generation Market Revenue (billion), by Type 2025 & 2033
- Figure 9: Europe NDT in Power Generation Market Revenue Share (%), by Type 2025 & 2033
- Figure 10: Europe NDT in Power Generation Market Revenue (billion), by Testing Technology 2025 & 2033
- Figure 11: Europe NDT in Power Generation Market Revenue Share (%), by Testing Technology 2025 & 2033
- Figure 12: Europe NDT in Power Generation Market Revenue (billion), by Country 2025 & 2033
- Figure 13: Europe NDT in Power Generation Market Revenue Share (%), by Country 2025 & 2033
- Figure 14: Asia Pacific NDT in Power Generation Market Revenue (billion), by Type 2025 & 2033
- Figure 15: Asia Pacific NDT in Power Generation Market Revenue Share (%), by Type 2025 & 2033
- Figure 16: Asia Pacific NDT in Power Generation Market Revenue (billion), by Testing Technology 2025 & 2033
- Figure 17: Asia Pacific NDT in Power Generation Market Revenue Share (%), by Testing Technology 2025 & 2033
- Figure 18: Asia Pacific NDT in Power Generation Market Revenue (billion), by Country 2025 & 2033
- Figure 19: Asia Pacific NDT in Power Generation Market Revenue Share (%), by Country 2025 & 2033
- Figure 20: Latin America NDT in Power Generation Market Revenue (billion), by Type 2025 & 2033
- Figure 21: Latin America NDT in Power Generation Market Revenue Share (%), by Type 2025 & 2033
- Figure 22: Latin America NDT in Power Generation Market Revenue (billion), by Testing Technology 2025 & 2033
- Figure 23: Latin America NDT in Power Generation Market Revenue Share (%), by Testing Technology 2025 & 2033
- Figure 24: Latin America NDT in Power Generation Market Revenue (billion), by Country 2025 & 2033
- Figure 25: Latin America NDT in Power Generation Market Revenue Share (%), by Country 2025 & 2033
- Figure 26: Middle East and Africa NDT in Power Generation Market Revenue (billion), by Type 2025 & 2033
- Figure 27: Middle East and Africa NDT in Power Generation Market Revenue Share (%), by Type 2025 & 2033
- Figure 28: Middle East and Africa NDT in Power Generation Market Revenue (billion), by Testing Technology 2025 & 2033
- Figure 29: Middle East and Africa NDT in Power Generation Market Revenue Share (%), by Testing Technology 2025 & 2033
- Figure 30: Middle East and Africa NDT in Power Generation Market Revenue (billion), by Country 2025 & 2033
- Figure 31: Middle East and Africa NDT in Power Generation Market Revenue Share (%), by Country 2025 & 2033
List of Tables
- Table 1: Global NDT in Power Generation Market Revenue billion Forecast, by Type 2020 & 2033
- Table 2: Global NDT in Power Generation Market Revenue billion Forecast, by Testing Technology 2020 & 2033
- Table 3: Global NDT in Power Generation Market Revenue billion Forecast, by Region 2020 & 2033
- Table 4: Global NDT in Power Generation Market Revenue billion Forecast, by Type 2020 & 2033
- Table 5: Global NDT in Power Generation Market Revenue billion Forecast, by Testing Technology 2020 & 2033
- Table 6: Global NDT in Power Generation Market Revenue billion Forecast, by Country 2020 & 2033
- Table 7: United States NDT in Power Generation Market Revenue (billion) Forecast, by Application 2020 & 2033
- Table 8: Canada NDT in Power Generation Market Revenue (billion) Forecast, by Application 2020 & 2033
- Table 9: Global NDT in Power Generation Market Revenue billion Forecast, by Type 2020 & 2033
- Table 10: Global NDT in Power Generation Market Revenue billion Forecast, by Testing Technology 2020 & 2033
- Table 11: Global NDT in Power Generation Market Revenue billion Forecast, by Country 2020 & 2033
- Table 12: United Kingdom NDT in Power Generation Market Revenue (billion) Forecast, by Application 2020 & 2033
- Table 13: Germany NDT in Power Generation Market Revenue (billion) Forecast, by Application 2020 & 2033
- Table 14: France NDT in Power Generation Market Revenue (billion) Forecast, by Application 2020 & 2033
- Table 15: Rest of Europe NDT in Power Generation Market Revenue (billion) Forecast, by Application 2020 & 2033
- Table 16: Global NDT in Power Generation Market Revenue billion Forecast, by Type 2020 & 2033
- Table 17: Global NDT in Power Generation Market Revenue billion Forecast, by Testing Technology 2020 & 2033
- Table 18: Global NDT in Power Generation Market Revenue billion Forecast, by Country 2020 & 2033
- Table 19: China NDT in Power Generation Market Revenue (billion) Forecast, by Application 2020 & 2033
- Table 20: Japan NDT in Power Generation Market Revenue (billion) Forecast, by Application 2020 & 2033
- Table 21: India NDT in Power Generation Market Revenue (billion) Forecast, by Application 2020 & 2033
- Table 22: Rest of Asia Pacific NDT in Power Generation Market Revenue (billion) Forecast, by Application 2020 & 2033
- Table 23: Global NDT in Power Generation Market Revenue billion Forecast, by Type 2020 & 2033
- Table 24: Global NDT in Power Generation Market Revenue billion Forecast, by Testing Technology 2020 & 2033
- Table 25: Global NDT in Power Generation Market Revenue billion Forecast, by Country 2020 & 2033
- Table 26: Global NDT in Power Generation Market Revenue billion Forecast, by Type 2020 & 2033
- Table 27: Global NDT in Power Generation Market Revenue billion Forecast, by Testing Technology 2020 & 2033
- Table 28: Global NDT in Power Generation Market Revenue billion Forecast, by Country 2020 & 2033
Frequently Asked Questions
1. What is the projected Compound Annual Growth Rate (CAGR) of the NDT in Power Generation Market?
The projected CAGR is approximately 6.24%.
2. Which companies are prominent players in the NDT in Power Generation Market?
Key companies in the market include Yxlon International Gmbh (Comet Holding AG), Intertek Group Plc, Eddyfi, SGS Group, Bureau Veritas S A, Fujifilm Corporation, Mistras Group Inc, Zetec Inc, Applus+ Services Technologies S L, Baker Hughes Company, Team Inc *List Not Exhaustive, Olympus Corporation.
3. What are the main segments of the NDT in Power Generation Market?
The market segments include Type, Testing Technology.
4. Can you provide details about the market size?
The market size is estimated to be USD 4.18 billion as of 2022.
5. What are some drivers contributing to market growth?
Stringent Regulations Mandating Safety Standards; Increase in Demand for Flaw Detection to Reduce Repair Cost; Aging Infrastructure and Increasing Need for Maintenance.
6. What are the notable trends driving market growth?
Visual Inspection Testing is Expected to Witness a Significant Growth.
7. Are there any restraints impacting market growth?
Lack of Skilled Workforce and Training Regulations.
8. Can you provide examples of recent developments in the market?
June 2022 - ALEIA, a startup specializing in AI, and Omexom NDT Engineering & Services, in collaboration with the Laboratoire d'Acoustique de l'Université du Mans (LAUM) UMR CNRS, have announced the deployment of the AUTEND project. The project is aimed to accelerate the inspection of nuclear power plants through AI. Moreover, the project is presently focusing on Non-Destructive Testing, which is an inspection process for nuclear infrastructures using eddy current or ultrasonic testing methods.
9. What pricing options are available for accessing the report?
Pricing options include single-user, multi-user, and enterprise licenses priced at USD 4750, USD 5250, and USD 8750 respectively.
10. Is the market size provided in terms of value or volume?
The market size is provided in terms of value, measured in billion.
11. Are there any specific market keywords associated with the report?
Yes, the market keyword associated with the report is "NDT in Power Generation Market," which aids in identifying and referencing the specific market segment covered.
12. How do I determine which pricing option suits my needs best?
The pricing options vary based on user requirements and access needs. Individual users may opt for single-user licenses, while businesses requiring broader access may choose multi-user or enterprise licenses for cost-effective access to the report.
13. Are there any additional resources or data provided in the NDT in Power Generation Market report?
While the report offers comprehensive insights, it's advisable to review the specific contents or supplementary materials provided to ascertain if additional resources or data are available.
14. How can I stay updated on further developments or reports in the NDT in Power Generation Market?
To stay informed about further developments, trends, and reports in the NDT in Power Generation Market, consider subscribing to industry newsletters, following relevant companies and organizations, or regularly checking reputable industry news sources and publications.
Methodology
Step 1 - Identification of Relevant Samples Size from Population Database


Step 2 - Approaches for Defining Global Market Size (Value, Volume* & Price*)

Note*: In applicable scenarios
Step 3 - Data Sources
Primary Research
- Web Analytics
- Survey Reports
- Research Institute
- Latest Research Reports
- Opinion Leaders
Secondary Research
- Annual Reports
- White Paper
- Latest Press Release
- Industry Association
- Paid Database
- Investor Presentations

Step 4 - Data Triangulation
Involves using different sources of information in order to increase the validity of a study
These sources are likely to be stakeholders in a program - participants, other researchers, program staff, other community members, and so on.
Then we put all data in single framework & apply various statistical tools to find out the dynamic on the market.
During the analysis stage, feedback from the stakeholder groups would be compared to determine areas of agreement as well as areas of divergence