

Key Insights
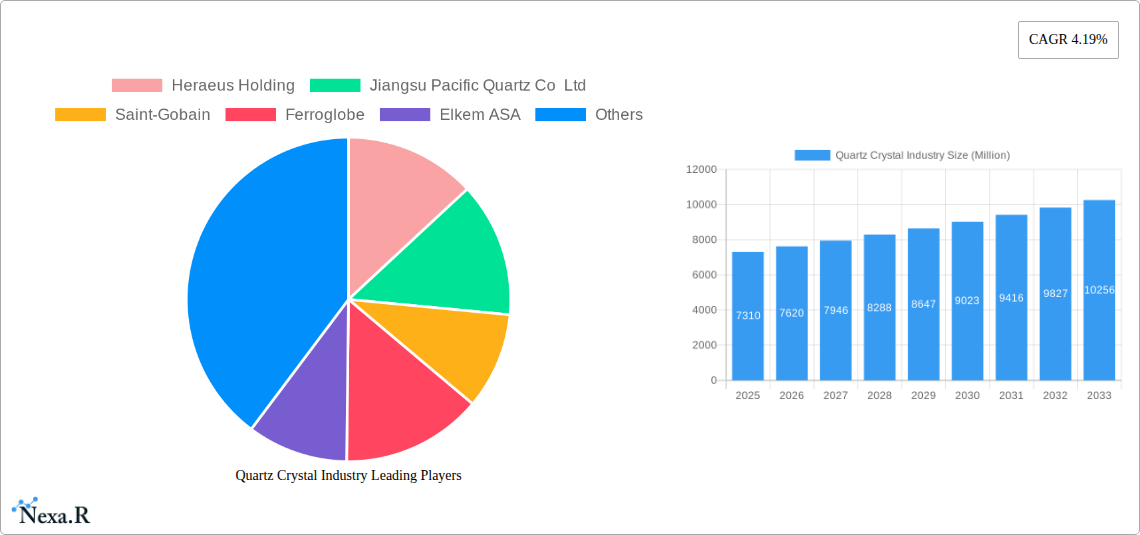
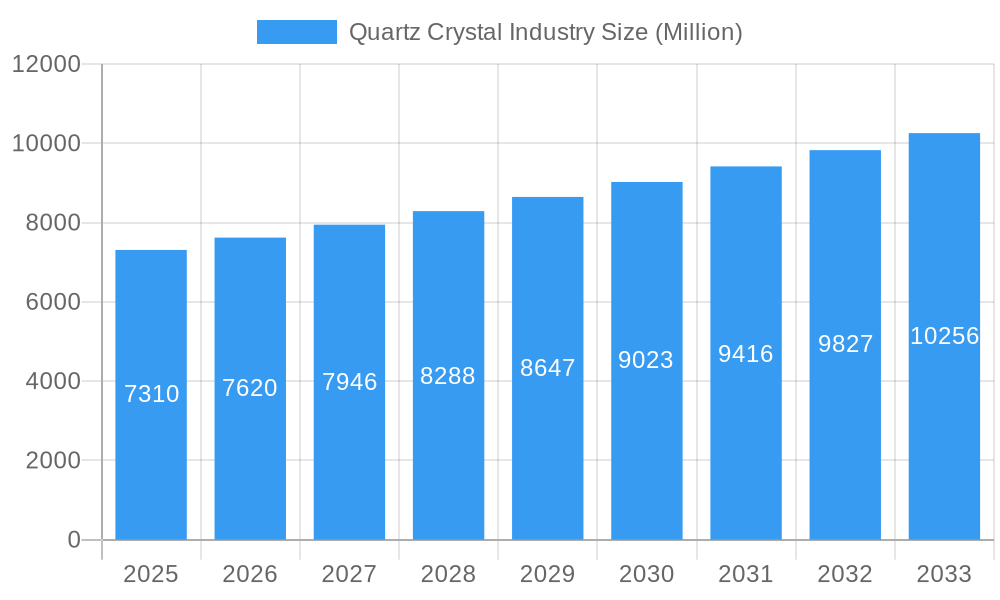
The quartz crystal market, valued at $7.31 billion in 2025, is projected to experience robust growth, driven by increasing demand across diverse sectors. A compound annual growth rate (CAGR) of 4.19% from 2025 to 2033 indicates a significant expansion, fueled primarily by the electronics and semiconductor industries, which rely heavily on quartz crystals for oscillators and resonators in various devices. The burgeoning solar energy sector also contributes significantly to market growth, with quartz glass utilized in solar cells and panels. Furthermore, the construction industry's adoption of quartz-based materials for its superior durability and aesthetic qualities fuels additional demand. Technological advancements leading to higher-purity quartz crystals, enhancing performance and efficiency in applications, further bolster market expansion. While supply chain disruptions and fluctuations in raw material prices pose potential restraints, the overall market outlook remains optimistic, with continued innovation and diversification across end-user industries promising sustained growth.
Quartz Crystal Industry Market Size (In Billion)
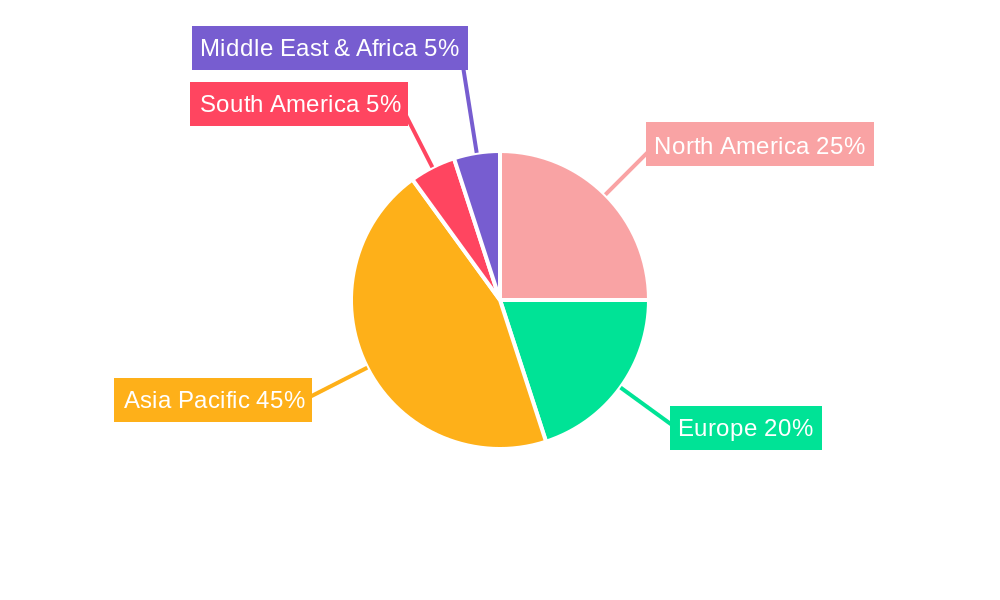
Growth within specific segments varies. High-purity quartz, crucial for advanced electronics, commands a premium price and is expected to exhibit faster growth than other types. Geographically, the Asia-Pacific region, particularly China and India, is anticipated to dominate the market, reflecting the region's robust manufacturing base and burgeoning electronics industry. North America and Europe also represent significant markets, driven by established electronics and automotive industries. However, emerging economies in South America and the Middle East are poised for considerable expansion in the coming years, presenting lucrative opportunities for market players. Key industry players, including Heraeus Holding, Jiangsu Pacific Quartz Co Ltd, and Saint-Gobain, are strategically investing in research and development, capacity expansion, and geographic diversification to capitalize on these emerging opportunities and maintain their competitive edge in this dynamic market.
Quartz Crystal Industry Company Market Share
Quartz Crystal Industry Market Report: 2019-2033
This comprehensive report provides an in-depth analysis of the quartz crystal industry, encompassing market dynamics, growth trends, regional landscapes, product innovation, key players, and future outlook. The study covers the period 2019-2033, with a focus on the 2025-2033 forecast period. The report segments the market by type (High-purity Quartz), end-user industry (Electronics & Semiconductor, Solar, Buildings & Construction, Optical Fiber & Telecommunication, Automotive, Other), and product (Quartz Glass, Quartz Crystal, Silicon Metal). Market values are presented in million units.
Quartz Crystal Industry Market Dynamics & Structure
This section analyzes the competitive landscape of the quartz crystal market, encompassing market concentration, technological advancements, regulatory frameworks, and M&A activities. The industry is characterized by a mix of large multinational corporations and specialized regional players. Market concentration is moderate, with several key players holding significant market share, while numerous smaller players cater to niche segments. Technological innovation is a crucial driver, particularly in the high-purity quartz segment, demanding significant R&D investments. Regulatory frameworks, varying across regions, influence production processes and environmental standards. The presence of substitute materials, such as synthetic sapphire, poses a competitive challenge. M&A activity has been observed, particularly in the acquisition of smaller players with specialized expertise or regional dominance.
- Market Concentration: Moderate, with top 5 players holding approximately xx% market share (2024).
- Technological Innovation: Significant advancements in crystal growth and purification technologies drive market growth.
- Regulatory Framework: Environmental regulations, particularly on silica dust emissions, impact production costs.
- Competitive Substitutes: Synthetic sapphire and other optical materials compete in specific niche applications.
- M&A Trends: Consolidation is expected, with larger players acquiring smaller regional companies to expand market reach and product portfolios. Recent deals include Sibelco's acquisition of the Bassanetti Group (December 2022). Total M&A deal value in 2024 was approximately xx million USD.
- End-User Demographics: Growth is primarily driven by the expanding electronics and semiconductor industries.
Quartz Crystal Industry Growth Trends & Insights
The quartz crystal market experienced significant growth between 2019 and 2024, driven by the increasing demand from various end-use sectors. The electronics and semiconductor industry remains the dominant driver, fueled by the proliferation of smartphones, computers, and other electronic devices. The solar energy sector is also contributing significantly, with the growth of photovoltaic technology boosting demand for high-purity quartz. Other applications like optical fibers and telecommunication and automotive also show substantial growth. The market is expected to continue its expansion, with a Compound Annual Growth Rate (CAGR) of xx% projected from 2025 to 2033. This growth is influenced by technological advancements in materials science, leading to improved performance and efficiency. Consumer behavior shifts toward sustainable and eco-friendly products indirectly benefit the quartz crystal industry given its presence in solar panels. Market penetration is expected to rise significantly in developing economies due to increasing infrastructure development and industrialization.
Dominant Regions, Countries, or Segments in Quartz Crystal Industry
The Asia-Pacific region dominates the global quartz crystal market, owing to its robust electronics and semiconductor manufacturing base, concentrated in countries like China, Japan, and South Korea. The region's strong economic growth and supportive government policies have fueled substantial demand for high-purity quartz. North America and Europe also hold significant market share, driven by established industries and high technological adoption rates. Within segments, the high-purity quartz segment commands the largest market share due to its critical applications in electronics and semiconductors. The electronics and semiconductor end-user industry exhibits the highest growth potential due to ongoing technological advancements and the increasing demand for advanced electronic devices.
- Key Drivers in Asia-Pacific: Strong electronics manufacturing, favorable government policies, substantial infrastructure investments.
- Key Drivers in North America: High technological adoption rates, robust R&D investment, well-established end-user industries.
- Key Drivers in Europe: Strong presence of major quartz crystal manufacturers, high demand in automotive and optical fiber segments.
- High-Purity Quartz Segment Dominance: Driven by its critical role in advanced electronic components and applications requiring high precision.
- Electronics & Semiconductor Industry Growth: Fueled by the exponential growth of the electronics and semiconductor sectors.
Quartz Crystal Industry Product Landscape
The quartz crystal industry offers a diverse range of products, including high-purity quartz, quartz glass, and silicon metal. Product innovations focus on enhancing purity levels, improving crystal growth techniques, and developing tailored properties for specific applications. Advancements in crystal growth techniques have resulted in larger and more defect-free crystals. Unique selling propositions emphasize high purity, precise dimensions, and consistent quality to ensure superior performance in demanding applications. Technological advancements focus on automation and improved efficiency of production processes.
Key Drivers, Barriers & Challenges in Quartz Crystal Industry
Key Drivers: The primary drivers include increasing demand from the electronics and semiconductor industries, growth of the renewable energy sector (solar energy), advancements in materials science, and supportive government policies promoting technological advancement.
Key Challenges & Restraints: Supply chain disruptions can affect production volumes and increase costs. Stringent environmental regulations and increasing raw material prices pose significant challenges. Intense competition among manufacturers and the presence of substitute materials necessitate continuous innovation and cost optimization. The geopolitical instability can also impact market dynamics due to trade limitations. Increased labor costs might constrain profit margins.
Emerging Opportunities in Quartz Crystal Industry
Emerging opportunities lie in the growing demand for high-purity quartz in specialized applications such as advanced sensors, high-power electronics, and quantum computing. The increasing adoption of 5G technology is expected to further drive market growth. Untapped markets in developing economies offer significant expansion potential. Innovative applications in aerospace, medical devices, and advanced optics are also emerging. The development of sustainable and environmentally friendly production processes presents an opportunity to enhance the industry’s sustainability profile.
Growth Accelerators in the Quartz Crystal Industry
Technological breakthroughs in crystal growth and purification techniques, strategic collaborations to improve production efficiency and access new markets, and the expansion into new geographic regions are key growth accelerators. Investing in R&D to develop advanced quartz crystal materials for emerging applications (e.g., quantum computing) will further drive market growth. Targeted marketing campaigns focused on the benefits of advanced quartz crystal materials in various end-use industries will also contribute to market expansion.
Key Players Shaping the Quartz Crystal Industry Market
- Heraeus Holding
- Jiangsu Pacific Quartz Co Ltd
- Saint-Gobain
- Ferroglobe
- Elkem ASA
- Wonic QnC Corporation
- The Quartz Corporation
- Nihon Dempa Kogyo Co Ltd
- Sibelco
- Nordic Mining ASA
- SUMCO Corporation
- Dow
- RUSNANO Group
- AGC Inc
- Beijing Kai de Quartz Co Ltd
Notable Milestones in Quartz Crystal Industry Sector
- December 2022: Sibelco acquired Bassanetti Group, strengthening its Southern European market position.
- March 2022: AGC Inc. terminated operations in Russia and Ukraine due to the ongoing war.
In-Depth Quartz Crystal Industry Market Outlook
The quartz crystal industry is poised for significant growth in the coming years, driven by technological advancements, increasing demand from key end-use sectors, and strategic expansions into new markets. The ongoing development of advanced materials and manufacturing processes will lead to higher efficiency, improved performance, and cost reductions. The market’s future success hinges on continuous innovation, strategic partnerships, and a focus on sustainability. The industry's long-term potential lies in its crucial role in several high-growth technologies, including 5G, renewable energy, and advanced electronics.
Quartz Crystal Industry Segmentation
-
1. Type
-
1.1. High-purity Quartz
- 1.1.1. Quartz Surface and Tile
- 1.1.2. Fused Quartz Crucible
- 1.1.3. Quartz Glass
- 1.2. Quartz Crystal
- 1.3. Silicon Metal
-
1.1. High-purity Quartz
-
2. End-user Industry
- 2.1. Electronics and Semiconductor
- 2.2. Solar
- 2.3. Buildings and Construction
- 2.4. Optical fiber and Telecommunication
- 2.5. Automotive
- 2.6. Other End-user Industries
Quartz Crystal Industry Segmentation By Geography
-
1. Asia Pacific
- 1.1. China
- 1.2. India
- 1.3. Japan
- 1.4. South Korea
- 1.5. Rest of Asia Pacific
-
2. North America
- 2.1. United States
- 2.2. Canada
- 2.3. Mexico
-
3. Europe
- 3.1. Germany
- 3.2. United Kingdom
- 3.3. Italy
- 3.4. France
- 3.5. Russia
- 3.6. Rest of Europe
-
4. South America
- 4.1. Brazil
- 4.2. Argentina
- 4.3. Rest of South America
- 5. Middle East
-
6. Saudi Arabia
- 6.1. South Africa
- 6.2. Rest of Middle East
Quartz Crystal Industry Regional Market Share
Geographic Coverage of Quartz Crystal Industry
Quartz Crystal Industry REPORT HIGHLIGHTS
| Aspects | Details |
|---|---|
| Study Period | 2020-2034 |
| Base Year | 2025 |
| Estimated Year | 2026 |
| Forecast Period | 2026-2034 |
| Historical Period | 2020-2025 |
| Growth Rate | CAGR of 4.19% from 2020-2034 |
| Segmentation |
|
Table of Contents
- 1. Introduction
- 1.1. Research Scope
- 1.2. Market Segmentation
- 1.3. Research Objective
- 1.4. Definitions and Assumptions
- 2. Executive Summary
- 2.1. Market Snapshot
- 3. Market Dynamics
- 3.1. Market Drivers
- 3.2. Market Restrains
- 3.3. Market Trends
- 3.4. Market Opportunities
- 4. Market Factor Analysis
- 4.1. Porters Five Forces
- 4.1.1. Bargaining Power of Suppliers
- 4.1.2. Bargaining Power of Buyers
- 4.1.3. Threat of New Entrants
- 4.1.4. Threat of Substitutes
- 4.1.5. Competitive Rivalry
- 4.2. PESTEL analysis
- 4.3. BCG Analysis
- 4.3.1. Stars (High Growth, High Market Share)
- 4.3.2. Cash Cows (Low Growth, High Market Share)
- 4.3.3. Question Mark (High Growth, Low Market Share)
- 4.3.4. Dogs (Low Growth, Low Market Share)
- 4.4. Ansoff Matrix Analysis
- 4.5. Supply Chain Analysis
- 4.6. Regulatory Landscape
- 4.7. Current Market Potential and Opportunity Assessment (TAM–SAM–SOM Framework)
- 4.8. NRP Analyst Note
- 4.1. Porters Five Forces
- 5. Market Analysis, Insights and Forecast 2021-2033
- 5.1. Market Analysis, Insights and Forecast - by Type
- 5.1.1. High-purity Quartz
- 5.1.1.1. Quartz Surface and Tile
- 5.1.1.2. Fused Quartz Crucible
- 5.1.1.3. Quartz Glass
- 5.1.2. Quartz Crystal
- 5.1.3. Silicon Metal
- 5.1.1. High-purity Quartz
- 5.2. Market Analysis, Insights and Forecast - by End-user Industry
- 5.2.1. Electronics and Semiconductor
- 5.2.2. Solar
- 5.2.3. Buildings and Construction
- 5.2.4. Optical fiber and Telecommunication
- 5.2.5. Automotive
- 5.2.6. Other End-user Industries
- 5.3. Market Analysis, Insights and Forecast - by Region
- 5.3.1. Asia Pacific
- 5.3.2. North America
- 5.3.3. Europe
- 5.3.4. South America
- 5.3.5. Middle East
- 5.3.6. Saudi Arabia
- 5.1. Market Analysis, Insights and Forecast - by Type
- 6. Global Quartz Crystal Industry Analysis, Insights and Forecast, 2021-2033
- 6.1. Market Analysis, Insights and Forecast - by Type
- 6.1.1. High-purity Quartz
- 6.1.1.1. Quartz Surface and Tile
- 6.1.1.2. Fused Quartz Crucible
- 6.1.1.3. Quartz Glass
- 6.1.2. Quartz Crystal
- 6.1.3. Silicon Metal
- 6.1.1. High-purity Quartz
- 6.2. Market Analysis, Insights and Forecast - by End-user Industry
- 6.2.1. Electronics and Semiconductor
- 6.2.2. Solar
- 6.2.3. Buildings and Construction
- 6.2.4. Optical fiber and Telecommunication
- 6.2.5. Automotive
- 6.2.6. Other End-user Industries
- 6.1. Market Analysis, Insights and Forecast - by Type
- 7. Asia Pacific Quartz Crystal Industry Analysis, Insights and Forecast, 2020-2032
- 7.1. Market Analysis, Insights and Forecast - by Type
- 7.1.1. High-purity Quartz
- 7.1.1.1. Quartz Surface and Tile
- 7.1.1.2. Fused Quartz Crucible
- 7.1.1.3. Quartz Glass
- 7.1.2. Quartz Crystal
- 7.1.3. Silicon Metal
- 7.1.1. High-purity Quartz
- 7.2. Market Analysis, Insights and Forecast - by End-user Industry
- 7.2.1. Electronics and Semiconductor
- 7.2.2. Solar
- 7.2.3. Buildings and Construction
- 7.2.4. Optical fiber and Telecommunication
- 7.2.5. Automotive
- 7.2.6. Other End-user Industries
- 7.1. Market Analysis, Insights and Forecast - by Type
- 8. North America Quartz Crystal Industry Analysis, Insights and Forecast, 2020-2032
- 8.1. Market Analysis, Insights and Forecast - by Type
- 8.1.1. High-purity Quartz
- 8.1.1.1. Quartz Surface and Tile
- 8.1.1.2. Fused Quartz Crucible
- 8.1.1.3. Quartz Glass
- 8.1.2. Quartz Crystal
- 8.1.3. Silicon Metal
- 8.1.1. High-purity Quartz
- 8.2. Market Analysis, Insights and Forecast - by End-user Industry
- 8.2.1. Electronics and Semiconductor
- 8.2.2. Solar
- 8.2.3. Buildings and Construction
- 8.2.4. Optical fiber and Telecommunication
- 8.2.5. Automotive
- 8.2.6. Other End-user Industries
- 8.1. Market Analysis, Insights and Forecast - by Type
- 9. Europe Quartz Crystal Industry Analysis, Insights and Forecast, 2020-2032
- 9.1. Market Analysis, Insights and Forecast - by Type
- 9.1.1. High-purity Quartz
- 9.1.1.1. Quartz Surface and Tile
- 9.1.1.2. Fused Quartz Crucible
- 9.1.1.3. Quartz Glass
- 9.1.2. Quartz Crystal
- 9.1.3. Silicon Metal
- 9.1.1. High-purity Quartz
- 9.2. Market Analysis, Insights and Forecast - by End-user Industry
- 9.2.1. Electronics and Semiconductor
- 9.2.2. Solar
- 9.2.3. Buildings and Construction
- 9.2.4. Optical fiber and Telecommunication
- 9.2.5. Automotive
- 9.2.6. Other End-user Industries
- 9.1. Market Analysis, Insights and Forecast - by Type
- 10. South America Quartz Crystal Industry Analysis, Insights and Forecast, 2020-2032
- 10.1. Market Analysis, Insights and Forecast - by Type
- 10.1.1. High-purity Quartz
- 10.1.1.1. Quartz Surface and Tile
- 10.1.1.2. Fused Quartz Crucible
- 10.1.1.3. Quartz Glass
- 10.1.2. Quartz Crystal
- 10.1.3. Silicon Metal
- 10.1.1. High-purity Quartz
- 10.2. Market Analysis, Insights and Forecast - by End-user Industry
- 10.2.1. Electronics and Semiconductor
- 10.2.2. Solar
- 10.2.3. Buildings and Construction
- 10.2.4. Optical fiber and Telecommunication
- 10.2.5. Automotive
- 10.2.6. Other End-user Industries
- 10.1. Market Analysis, Insights and Forecast - by Type
- 11. Middle East Quartz Crystal Industry Analysis, Insights and Forecast, 2020-2032
- 11.1. Market Analysis, Insights and Forecast - by Type
- 11.1.1. High-purity Quartz
- 11.1.1.1. Quartz Surface and Tile
- 11.1.1.2. Fused Quartz Crucible
- 11.1.1.3. Quartz Glass
- 11.1.2. Quartz Crystal
- 11.1.3. Silicon Metal
- 11.1.1. High-purity Quartz
- 11.2. Market Analysis, Insights and Forecast - by End-user Industry
- 11.2.1. Electronics and Semiconductor
- 11.2.2. Solar
- 11.2.3. Buildings and Construction
- 11.2.4. Optical fiber and Telecommunication
- 11.2.5. Automotive
- 11.2.6. Other End-user Industries
- 11.1. Market Analysis, Insights and Forecast - by Type
- 12. Saudi Arabia Quartz Crystal Industry Analysis, Insights and Forecast, 2020-2032
- 12.1. Market Analysis, Insights and Forecast - by Type
- 12.1.1. High-purity Quartz
- 12.1.1.1. Quartz Surface and Tile
- 12.1.1.2. Fused Quartz Crucible
- 12.1.1.3. Quartz Glass
- 12.1.2. Quartz Crystal
- 12.1.3. Silicon Metal
- 12.1.1. High-purity Quartz
- 12.2. Market Analysis, Insights and Forecast - by End-user Industry
- 12.2.1. Electronics and Semiconductor
- 12.2.2. Solar
- 12.2.3. Buildings and Construction
- 12.2.4. Optical fiber and Telecommunication
- 12.2.5. Automotive
- 12.2.6. Other End-user Industries
- 12.1. Market Analysis, Insights and Forecast - by Type
- 13. Competitive Analysis
- 13.1. Company Profiles
- 13.1.1 Heraeus Holding
- 13.1.1.1. Company Overview
- 13.1.1.2. Products
- 13.1.1.3. Company Financials
- 13.1.1.4. SWOT Analysis
- 13.1.2 Jiangsu Pacific Quartz Co Ltd
- 13.1.2.1. Company Overview
- 13.1.2.2. Products
- 13.1.2.3. Company Financials
- 13.1.2.4. SWOT Analysis
- 13.1.3 Saint-Gobain
- 13.1.3.1. Company Overview
- 13.1.3.2. Products
- 13.1.3.3. Company Financials
- 13.1.3.4. SWOT Analysis
- 13.1.4 Ferroglobe
- 13.1.4.1. Company Overview
- 13.1.4.2. Products
- 13.1.4.3. Company Financials
- 13.1.4.4. SWOT Analysis
- 13.1.5 Elkem ASA
- 13.1.5.1. Company Overview
- 13.1.5.2. Products
- 13.1.5.3. Company Financials
- 13.1.5.4. SWOT Analysis
- 13.1.6 Wonic QnC Corporation
- 13.1.6.1. Company Overview
- 13.1.6.2. Products
- 13.1.6.3. Company Financials
- 13.1.6.4. SWOT Analysis
- 13.1.7 The Quartz Corporation*List Not Exhaustive
- 13.1.7.1. Company Overview
- 13.1.7.2. Products
- 13.1.7.3. Company Financials
- 13.1.7.4. SWOT Analysis
- 13.1.8 Nihon Dempa Kogyo Co Ltd
- 13.1.8.1. Company Overview
- 13.1.8.2. Products
- 13.1.8.3. Company Financials
- 13.1.8.4. SWOT Analysis
- 13.1.9 Sibelco
- 13.1.9.1. Company Overview
- 13.1.9.2. Products
- 13.1.9.3. Company Financials
- 13.1.9.4. SWOT Analysis
- 13.1.10 Nordic Mining ASA
- 13.1.10.1. Company Overview
- 13.1.10.2. Products
- 13.1.10.3. Company Financials
- 13.1.10.4. SWOT Analysis
- 13.1.11 SUMCO Corporation
- 13.1.11.1. Company Overview
- 13.1.11.2. Products
- 13.1.11.3. Company Financials
- 13.1.11.4. SWOT Analysis
- 13.1.12 Dow
- 13.1.12.1. Company Overview
- 13.1.12.2. Products
- 13.1.12.3. Company Financials
- 13.1.12.4. SWOT Analysis
- 13.1.13 RUSNANO Group
- 13.1.13.1. Company Overview
- 13.1.13.2. Products
- 13.1.13.3. Company Financials
- 13.1.13.4. SWOT Analysis
- 13.1.14 AGC Inc
- 13.1.14.1. Company Overview
- 13.1.14.2. Products
- 13.1.14.3. Company Financials
- 13.1.14.4. SWOT Analysis
- 13.1.15 Beijing Kai de Quartz Co Ltd
- 13.1.15.1. Company Overview
- 13.1.15.2. Products
- 13.1.15.3. Company Financials
- 13.1.15.4. SWOT Analysis
- 13.1.1 Heraeus Holding
- 13.2. Market Entropy
- 13.2.1 Company's Key Areas Served
- 13.2.2 Recent Developments
- 13.3. Company Market Share Analysis 2025
- 13.3.1 Top 5 Companies Market Share Analysis
- 13.3.2 Top 3 Companies Market Share Analysis
- 13.4. List of Potential Customers
- 14. Research Methodology
List of Figures
- Figure 1: Global Quartz Crystal Industry Revenue Breakdown (Million, %) by Region 2025 & 2033
- Figure 2: Asia Pacific Quartz Crystal Industry Revenue (Million), by Type 2025 & 2033
- Figure 3: Asia Pacific Quartz Crystal Industry Revenue Share (%), by Type 2025 & 2033
- Figure 4: Asia Pacific Quartz Crystal Industry Revenue (Million), by End-user Industry 2025 & 2033
- Figure 5: Asia Pacific Quartz Crystal Industry Revenue Share (%), by End-user Industry 2025 & 2033
- Figure 6: Asia Pacific Quartz Crystal Industry Revenue (Million), by Country 2025 & 2033
- Figure 7: Asia Pacific Quartz Crystal Industry Revenue Share (%), by Country 2025 & 2033
- Figure 8: North America Quartz Crystal Industry Revenue (Million), by Type 2025 & 2033
- Figure 9: North America Quartz Crystal Industry Revenue Share (%), by Type 2025 & 2033
- Figure 10: North America Quartz Crystal Industry Revenue (Million), by End-user Industry 2025 & 2033
- Figure 11: North America Quartz Crystal Industry Revenue Share (%), by End-user Industry 2025 & 2033
- Figure 12: North America Quartz Crystal Industry Revenue (Million), by Country 2025 & 2033
- Figure 13: North America Quartz Crystal Industry Revenue Share (%), by Country 2025 & 2033
- Figure 14: Europe Quartz Crystal Industry Revenue (Million), by Type 2025 & 2033
- Figure 15: Europe Quartz Crystal Industry Revenue Share (%), by Type 2025 & 2033
- Figure 16: Europe Quartz Crystal Industry Revenue (Million), by End-user Industry 2025 & 2033
- Figure 17: Europe Quartz Crystal Industry Revenue Share (%), by End-user Industry 2025 & 2033
- Figure 18: Europe Quartz Crystal Industry Revenue (Million), by Country 2025 & 2033
- Figure 19: Europe Quartz Crystal Industry Revenue Share (%), by Country 2025 & 2033
- Figure 20: South America Quartz Crystal Industry Revenue (Million), by Type 2025 & 2033
- Figure 21: South America Quartz Crystal Industry Revenue Share (%), by Type 2025 & 2033
- Figure 22: South America Quartz Crystal Industry Revenue (Million), by End-user Industry 2025 & 2033
- Figure 23: South America Quartz Crystal Industry Revenue Share (%), by End-user Industry 2025 & 2033
- Figure 24: South America Quartz Crystal Industry Revenue (Million), by Country 2025 & 2033
- Figure 25: South America Quartz Crystal Industry Revenue Share (%), by Country 2025 & 2033
- Figure 26: Middle East Quartz Crystal Industry Revenue (Million), by Type 2025 & 2033
- Figure 27: Middle East Quartz Crystal Industry Revenue Share (%), by Type 2025 & 2033
- Figure 28: Middle East Quartz Crystal Industry Revenue (Million), by End-user Industry 2025 & 2033
- Figure 29: Middle East Quartz Crystal Industry Revenue Share (%), by End-user Industry 2025 & 2033
- Figure 30: Middle East Quartz Crystal Industry Revenue (Million), by Country 2025 & 2033
- Figure 31: Middle East Quartz Crystal Industry Revenue Share (%), by Country 2025 & 2033
- Figure 32: Saudi Arabia Quartz Crystal Industry Revenue (Million), by Type 2025 & 2033
- Figure 33: Saudi Arabia Quartz Crystal Industry Revenue Share (%), by Type 2025 & 2033
- Figure 34: Saudi Arabia Quartz Crystal Industry Revenue (Million), by End-user Industry 2025 & 2033
- Figure 35: Saudi Arabia Quartz Crystal Industry Revenue Share (%), by End-user Industry 2025 & 2033
- Figure 36: Saudi Arabia Quartz Crystal Industry Revenue (Million), by Country 2025 & 2033
- Figure 37: Saudi Arabia Quartz Crystal Industry Revenue Share (%), by Country 2025 & 2033
List of Tables
- Table 1: Global Quartz Crystal Industry Revenue Million Forecast, by Type 2020 & 2033
- Table 2: Global Quartz Crystal Industry Revenue Million Forecast, by End-user Industry 2020 & 2033
- Table 3: Global Quartz Crystal Industry Revenue Million Forecast, by Region 2020 & 2033
- Table 4: Global Quartz Crystal Industry Revenue Million Forecast, by Type 2020 & 2033
- Table 5: Global Quartz Crystal Industry Revenue Million Forecast, by End-user Industry 2020 & 2033
- Table 6: Global Quartz Crystal Industry Revenue Million Forecast, by Country 2020 & 2033
- Table 7: China Quartz Crystal Industry Revenue (Million) Forecast, by Application 2020 & 2033
- Table 8: India Quartz Crystal Industry Revenue (Million) Forecast, by Application 2020 & 2033
- Table 9: Japan Quartz Crystal Industry Revenue (Million) Forecast, by Application 2020 & 2033
- Table 10: South Korea Quartz Crystal Industry Revenue (Million) Forecast, by Application 2020 & 2033
- Table 11: Rest of Asia Pacific Quartz Crystal Industry Revenue (Million) Forecast, by Application 2020 & 2033
- Table 12: Global Quartz Crystal Industry Revenue Million Forecast, by Type 2020 & 2033
- Table 13: Global Quartz Crystal Industry Revenue Million Forecast, by End-user Industry 2020 & 2033
- Table 14: Global Quartz Crystal Industry Revenue Million Forecast, by Country 2020 & 2033
- Table 15: United States Quartz Crystal Industry Revenue (Million) Forecast, by Application 2020 & 2033
- Table 16: Canada Quartz Crystal Industry Revenue (Million) Forecast, by Application 2020 & 2033
- Table 17: Mexico Quartz Crystal Industry Revenue (Million) Forecast, by Application 2020 & 2033
- Table 18: Global Quartz Crystal Industry Revenue Million Forecast, by Type 2020 & 2033
- Table 19: Global Quartz Crystal Industry Revenue Million Forecast, by End-user Industry 2020 & 2033
- Table 20: Global Quartz Crystal Industry Revenue Million Forecast, by Country 2020 & 2033
- Table 21: Germany Quartz Crystal Industry Revenue (Million) Forecast, by Application 2020 & 2033
- Table 22: United Kingdom Quartz Crystal Industry Revenue (Million) Forecast, by Application 2020 & 2033
- Table 23: Italy Quartz Crystal Industry Revenue (Million) Forecast, by Application 2020 & 2033
- Table 24: France Quartz Crystal Industry Revenue (Million) Forecast, by Application 2020 & 2033
- Table 25: Russia Quartz Crystal Industry Revenue (Million) Forecast, by Application 2020 & 2033
- Table 26: Rest of Europe Quartz Crystal Industry Revenue (Million) Forecast, by Application 2020 & 2033
- Table 27: Global Quartz Crystal Industry Revenue Million Forecast, by Type 2020 & 2033
- Table 28: Global Quartz Crystal Industry Revenue Million Forecast, by End-user Industry 2020 & 2033
- Table 29: Global Quartz Crystal Industry Revenue Million Forecast, by Country 2020 & 2033
- Table 30: Brazil Quartz Crystal Industry Revenue (Million) Forecast, by Application 2020 & 2033
- Table 31: Argentina Quartz Crystal Industry Revenue (Million) Forecast, by Application 2020 & 2033
- Table 32: Rest of South America Quartz Crystal Industry Revenue (Million) Forecast, by Application 2020 & 2033
- Table 33: Global Quartz Crystal Industry Revenue Million Forecast, by Type 2020 & 2033
- Table 34: Global Quartz Crystal Industry Revenue Million Forecast, by End-user Industry 2020 & 2033
- Table 35: Global Quartz Crystal Industry Revenue Million Forecast, by Country 2020 & 2033
- Table 36: Global Quartz Crystal Industry Revenue Million Forecast, by Type 2020 & 2033
- Table 37: Global Quartz Crystal Industry Revenue Million Forecast, by End-user Industry 2020 & 2033
- Table 38: Global Quartz Crystal Industry Revenue Million Forecast, by Country 2020 & 2033
- Table 39: South Africa Quartz Crystal Industry Revenue (Million) Forecast, by Application 2020 & 2033
- Table 40: Rest of Middle East Quartz Crystal Industry Revenue (Million) Forecast, by Application 2020 & 2033
Frequently Asked Questions
1. What is the projected Compound Annual Growth Rate (CAGR) of the Quartz Crystal Industry?
The projected CAGR is approximately 4.19%.
2. Which companies are prominent players in the Quartz Crystal Industry?
Key companies in the market include Heraeus Holding, Jiangsu Pacific Quartz Co Ltd, Saint-Gobain, Ferroglobe, Elkem ASA, Wonic QnC Corporation, The Quartz Corporation*List Not Exhaustive, Nihon Dempa Kogyo Co Ltd, Sibelco, Nordic Mining ASA, SUMCO Corporation, Dow, RUSNANO Group, AGC Inc, Beijing Kai de Quartz Co Ltd.
3. What are the main segments of the Quartz Crystal Industry?
The market segments include Type, End-user Industry.
4. Can you provide details about the market size?
The market size is estimated to be USD 7.31 Million as of 2022.
5. What are some drivers contributing to market growth?
Growing Solar Industry; Demand for High-purity Quartz in the Semiconductor Industry.
6. What are the notable trends driving market growth?
Rising Demand from the Electronics and Semiconductor Industry.
7. Are there any restraints impacting market growth?
Ecological Impact of Quartz Mining; Discoloration in Quartz Tiles and Slabs.
8. Can you provide examples of recent developments in the market?
December 2022: Sibelco acquired Bassanetti Group of Italy, which is a local player in the extraction, processing, and marketing of sand products in Southern Europe. This move will strengthen the company's positioning in Southern Europe.
9. What pricing options are available for accessing the report?
Pricing options include single-user, multi-user, and enterprise licenses priced at USD 4750, USD 5250, and USD 8750 respectively.
10. Is the market size provided in terms of value or volume?
The market size is provided in terms of value, measured in Million.
11. Are there any specific market keywords associated with the report?
Yes, the market keyword associated with the report is "Quartz Crystal Industry," which aids in identifying and referencing the specific market segment covered.
12. How do I determine which pricing option suits my needs best?
The pricing options vary based on user requirements and access needs. Individual users may opt for single-user licenses, while businesses requiring broader access may choose multi-user or enterprise licenses for cost-effective access to the report.
13. Are there any additional resources or data provided in the Quartz Crystal Industry report?
While the report offers comprehensive insights, it's advisable to review the specific contents or supplementary materials provided to ascertain if additional resources or data are available.
14. How can I stay updated on further developments or reports in the Quartz Crystal Industry?
To stay informed about further developments, trends, and reports in the Quartz Crystal Industry, consider subscribing to industry newsletters, following relevant companies and organizations, or regularly checking reputable industry news sources and publications.
Methodology
Step 1 - Identification of Relevant Samples Size from Population Database


Step 2 - Approaches for Defining Global Market Size (Value, Volume* & Price*)

Note*: In applicable scenarios
Step 3 - Data Sources
Primary Research
- Web Analytics
- Survey Reports
- Research Institute
- Latest Research Reports
- Opinion Leaders
Secondary Research
- Annual Reports
- White Paper
- Latest Press Release
- Industry Association
- Paid Database
- Investor Presentations

Step 4 - Data Triangulation
Involves using different sources of information in order to increase the validity of a study
These sources are likely to be stakeholders in a program - participants, other researchers, program staff, other community members, and so on.
Then we put all data in single framework & apply various statistical tools to find out the dynamic on the market.
During the analysis stage, feedback from the stakeholder groups would be compared to determine areas of agreement as well as areas of divergence