

Key Insights
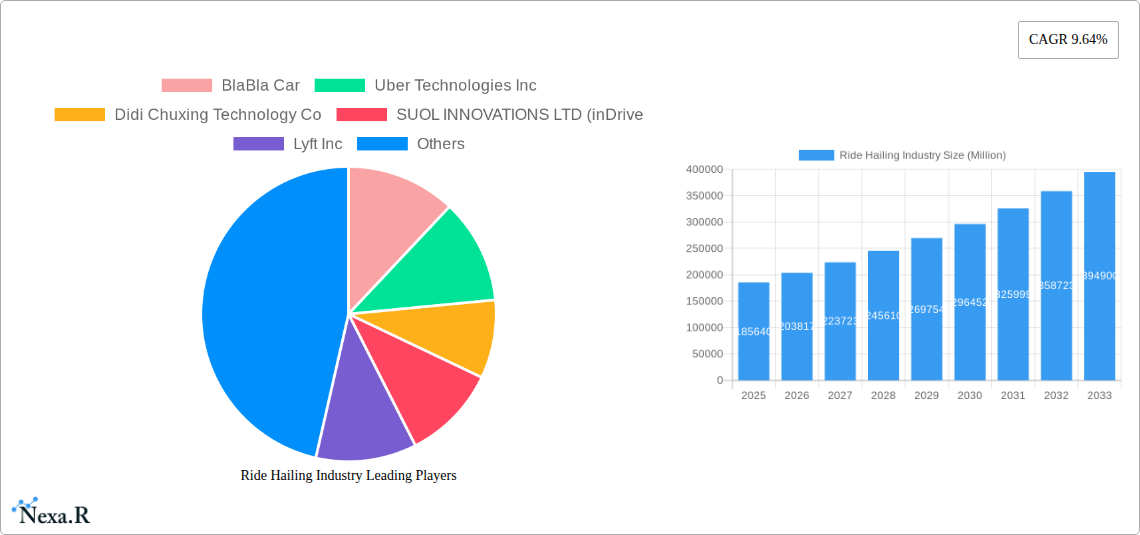
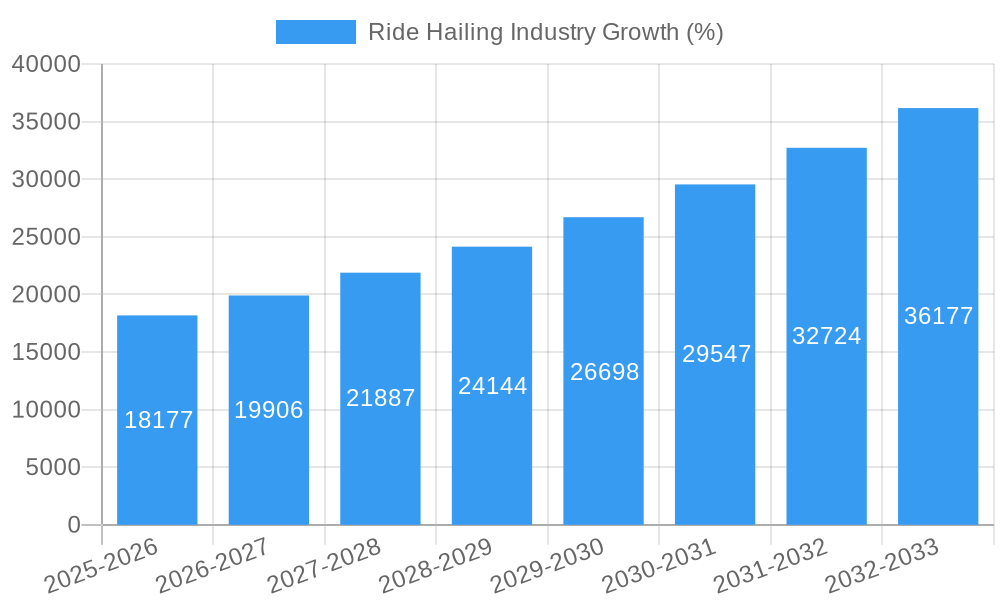
The ride-hailing industry, valued at $185.64 billion in 2025, is experiencing robust growth, projected to expand at a compound annual growth rate (CAGR) of 9.64% from 2025 to 2033. This expansion is fueled by several key factors. Increasing urbanization and the consequent rise in traffic congestion are driving demand for convenient and efficient transportation alternatives. The growing adoption of smartphones and readily available mobile internet access facilitates easy booking and payment processes, further boosting industry growth. Technological advancements, such as improved mapping and navigation systems, real-time pricing adjustments, and the integration of diverse payment gateways, enhance user experience and drive market expansion. Furthermore, the emergence of ride-sharing services catering to specific needs, such as airport transfers or deliveries, is diversifying the market and attracting a wider customer base. The industry also benefits from increasing disposable incomes in developing economies, where ride-hailing services provide affordable transportation options. However, regulatory hurdles, intense competition among established players and new entrants, and concerns regarding driver compensation and safety remain significant challenges that could impact future growth.
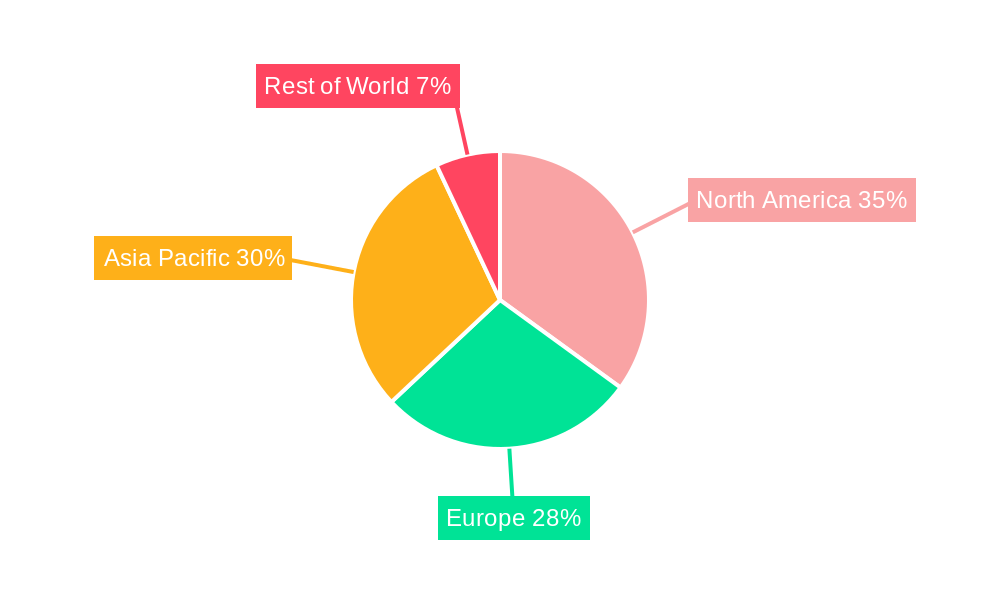
The industry segmentation reveals significant opportunities within specific vehicle types and propulsion systems. While Internal Combustion Engine (ICE) vehicles currently dominate, the increasing adoption of electric vehicles (EVs) is expected to gain traction, presenting significant growth potential for companies investing in sustainable ride-hailing solutions. The geographic distribution of the market shows strong performance in North America and Asia Pacific, driven primarily by high population density and technological advancement. Europe also represents a considerable market, though regulatory frameworks and differing market dynamics might influence regional growth rates differently. Competition among major players, including Uber, Didi, Ola, and Grab, is intense, necessitating strategic investments in technology, customer service, and geographic expansion to secure market share. The expansion into niche services like delivery and specialized transportation options is creating further avenues for differentiation and growth within this dynamic market.
Ride Hailing Industry Market Report: 2019-2033
This comprehensive report provides an in-depth analysis of the global ride-hailing industry, encompassing market dynamics, growth trends, competitive landscape, and future outlook. The study period covers 2019-2033, with 2025 as the base year and a forecast period extending to 2033. The report utilizes both qualitative and quantitative data to deliver actionable insights for industry professionals, investors, and strategic decision-makers. The report segments the market by vehicle type (motorcycles, cars, vans, buses) and propulsion type (ICE, electric), providing granular analysis of each segment's performance and growth trajectory. Key players like Uber, Didi, and Lyft are analyzed, along with emerging players reshaping the market. The parent market is Transportation and Logistics, while the child market is Ride Sharing services.
Ride Hailing Industry Market Dynamics & Structure
The ride-hailing market is characterized by high competition, rapid technological advancements, and evolving regulatory landscapes. Market concentration is moderate, with a few dominant players holding significant market share, but with many regional players and niche providers also active. The industry is driven by technological innovations such as AI-powered dispatch systems, autonomous driving technologies, and the integration of various payment methods. Regulatory frameworks vary significantly across countries and regions, influencing market access and operational costs. Substitutes like public transportation and personal vehicles exert competitive pressure, but ride-hailing's convenience often outweighs these alternatives.
- Market Concentration: Uber and Didi hold approximately xx% of the global market share (2025 estimate), with Lyft, Grab, and others competing for remaining shares.
- Technological Innovation: Autonomous vehicles, electric vehicle integration, and AI-driven route optimization are key innovation drivers. Barriers include high R&D costs, safety concerns, and regulatory approval processes.
- Regulatory Frameworks: Varying licensing requirements, insurance regulations, and data privacy laws impact operational costs and market entry for companies.
- Competitive Substitutes: Public transportation, personal vehicle ownership, and alternative mobility services (e.g., bike-sharing) create competitive pressure.
- End-User Demographics: Primarily young adults and urban populations, with increasing adoption in suburban and rural areas. Growth is driven by convenience, affordability, and availability.
- M&A Trends: Consolidation is occurring with strategic acquisitions and mergers, aiming for market expansion and technological integration (xx M&A deals recorded in 2024).
Ride Hailing Industry Growth Trends & Insights
The ride-hailing market experienced significant growth during the historical period (2019-2024), driven by increasing smartphone penetration, urbanization, and changing consumer preferences. The market size is estimated at xxx million units in 2025, with a projected Compound Annual Growth Rate (CAGR) of xx% from 2025 to 2033. Market penetration is increasing globally, particularly in emerging economies with expanding middle classes and limited public transportation infrastructure. Technological advancements are continuously reshaping the industry, increasing efficiency and expanding service offerings. Consumer behavior is shifting toward increased preference for on-demand mobility solutions, leading to higher adoption rates.
Dominant Regions, Countries, or Segments in Ride Hailing Industry
Asia, particularly China and India, are dominant regions, driven by large populations, rapid urbanization, and increasing smartphone penetration. The car segment constitutes the largest share of the market by vehicle type, with motorcycles holding a significant share in certain regions. The internal combustion engine (ICE) currently dominates the propulsion type segment, but electric vehicles (EVs) are rapidly gaining traction, supported by governmental incentives and growing environmental awareness.
- Key Drivers:
- Asia: High population density, rapid urbanization, growing middle class, and increasing smartphone adoption.
- North America: High disposable incomes, robust technological infrastructure, and early adoption of ride-hailing services.
- Europe: Growing urban populations, supportive regulatory environments in some regions, and increasing demand for efficient transportation.
- Dominant Segments:
- By Vehicle Type: Cars hold the largest market share (xx%), followed by motorcycles (xx%) and vans (xx%).
- By Propulsion Type: ICE vehicles currently dominate (xx%), but the electric vehicle segment is witnessing rapid growth (xx% CAGR).
Ride Hailing Industry Product Landscape
The ride-hailing industry offers various services, including point-to-point transportation, ride-sharing, carpooling, and premium services. Key features include real-time tracking, fare estimates, cashless payments, and various vehicle options. Recent innovations include the integration of AI-powered route optimization, autonomous driving capabilities, and enhanced safety features. Companies are constantly competing to differentiate their products, focusing on user experience, pricing strategies, and value-added services.
Key Drivers, Barriers & Challenges in Ride Hailing Industry
Key Drivers: Increasing smartphone penetration, urbanization, growing preference for convenience, government support for ride-hailing in some regions, and technological advancements.
Key Challenges: Intense competition, regulatory hurdles (licensing, insurance, data privacy), safety concerns, driver compensation and labor issues, and the high capital expenditure required for technological innovation and expansion. These challenges can significantly impact profitability and market expansion. For example, stringent regulations in certain regions could limit market penetration by increasing operational costs.
Emerging Opportunities in Ride Hailing Industry
Expanding into underserved markets (rural areas, developing countries), integrating with other transportation modes (public transport, bike-sharing), developing specialized services (e.g., delivery, freight), and exploring new business models (e.g., subscription services) present significant opportunities. Personalization, offering tailored experiences based on user preferences, and leveraging AI for smarter operations will be crucial for success.
Growth Accelerators in the Ride Hailing Industry
Technological advancements in areas like autonomous vehicles and AI-powered route optimization will significantly accelerate industry growth. Strategic partnerships with other businesses (e.g., hotels, tourism) and expansion into new geographic regions will also drive market growth. Furthermore, the increasing adoption of electric vehicles within the ride-hailing sector will enhance sustainability and appeal to environmentally conscious customers.
Key Players Shaping the Ride Hailing Industry Market
- BlaBla Car
- Uber Technologies Inc
- Didi Chuxing Technology Co
- SUOL INNOVATIONS LTD (inDrive)
- Lyft Inc
- Ani Technologies Pvt Ltd (OLA)
- Gett Group
- Bolt Technology OU
- Maxi Mobility SL (Cabify)
- GoTo Group (GoJek)
- Xanh SM (GSM)
- Grab Holdings Inc
Notable Milestones in Ride Hailing Industry Sector
- December 2023: TH International Limited partners with Didi Chuxing for a brand-building campaign.
- March 2024: Waymo launches its free Waymo One ride-hailing service in Los Angeles.
- April 2024: The Japanese government approves the use of private ride-hailing services via mobile apps like Uber and Go.
In-Depth Ride Hailing Industry Market Outlook
The ride-hailing market is poised for continued expansion, driven by technological innovation and evolving consumer preferences. The increasing adoption of EVs, expansion into new markets, and the development of innovative services will shape future growth. Strategic partnerships and mergers & acquisitions will continue to consolidate the market landscape, resulting in increased efficiency and a broader range of services for consumers. The long-term outlook is positive, with significant opportunities for growth and innovation.
Ride Hailing Industry Segmentation
-
1. Vehicle Type
- 1.1. Motorcycles
- 1.2. Cars
- 1.3. Vans
- 1.4. Buses
-
2. Propulsion Type
- 2.1. Internal Combustion Engine (ICE)
- 2.2. Electric
Ride Hailing Industry Segmentation By Geography
-
1. North America
- 1.1. United States
- 1.2. Canada
- 1.3. Rest of North America
-
2. Europe
- 2.1. Germany
- 2.2. United Kingdom
- 2.3. France
- 2.4. Italy
- 2.5. Rest of Europe
-
3. Asia Pacific
- 3.1. China
- 3.2. India
- 3.3. Japan
- 3.4. South Korea
- 3.5. Rest of Asia Pacific
-
4. Rest of the World
- 4.1. South America
- 4.2. Middle East and Africa
Ride Hailing Industry REPORT HIGHLIGHTS
| Aspects | Details |
|---|---|
| Study Period | 2019-2033 |
| Base Year | 2024 |
| Estimated Year | 2025 |
| Forecast Period | 2025-2033 |
| Historical Period | 2019-2024 |
| Growth Rate | CAGR of 9.64% from 2019-2033 |
| Segmentation |
|
Table of Contents
- 1. Introduction
- 1.1. Research Scope
- 1.2. Market Segmentation
- 1.3. Research Methodology
- 1.4. Definitions and Assumptions
- 2. Executive Summary
- 2.1. Introduction
- 3. Market Dynamics
- 3.1. Introduction
- 3.2. Market Drivers
- 3.2.1. Rising Traffic Congestion and Increasing Urban Population to Foster Market Growth
- 3.3. Market Restrains
- 3.3.1. Strict Government Regulations and Policies Toward Ride-hailing Services Impact the Market Growth
- 3.4. Market Trends
- 3.4.1. The Cars Segment is Expected to Gain Traction During the Forecast Period
- 4. Market Factor Analysis
- 4.1. Porters Five Forces
- 4.2. Supply/Value Chain
- 4.3. PESTEL analysis
- 4.4. Market Entropy
- 4.5. Patent/Trademark Analysis
- 5. Global Ride Hailing Industry Analysis, Insights and Forecast, 2019-2031
- 5.1. Market Analysis, Insights and Forecast - by Vehicle Type
- 5.1.1. Motorcycles
- 5.1.2. Cars
- 5.1.3. Vans
- 5.1.4. Buses
- 5.2. Market Analysis, Insights and Forecast - by Propulsion Type
- 5.2.1. Internal Combustion Engine (ICE)
- 5.2.2. Electric
- 5.3. Market Analysis, Insights and Forecast - by Region
- 5.3.1. North America
- 5.3.2. Europe
- 5.3.3. Asia Pacific
- 5.3.4. Rest of the World
- 5.1. Market Analysis, Insights and Forecast - by Vehicle Type
- 6. North America Ride Hailing Industry Analysis, Insights and Forecast, 2019-2031
- 6.1. Market Analysis, Insights and Forecast - by Vehicle Type
- 6.1.1. Motorcycles
- 6.1.2. Cars
- 6.1.3. Vans
- 6.1.4. Buses
- 6.2. Market Analysis, Insights and Forecast - by Propulsion Type
- 6.2.1. Internal Combustion Engine (ICE)
- 6.2.2. Electric
- 6.1. Market Analysis, Insights and Forecast - by Vehicle Type
- 7. Europe Ride Hailing Industry Analysis, Insights and Forecast, 2019-2031
- 7.1. Market Analysis, Insights and Forecast - by Vehicle Type
- 7.1.1. Motorcycles
- 7.1.2. Cars
- 7.1.3. Vans
- 7.1.4. Buses
- 7.2. Market Analysis, Insights and Forecast - by Propulsion Type
- 7.2.1. Internal Combustion Engine (ICE)
- 7.2.2. Electric
- 7.1. Market Analysis, Insights and Forecast - by Vehicle Type
- 8. Asia Pacific Ride Hailing Industry Analysis, Insights and Forecast, 2019-2031
- 8.1. Market Analysis, Insights and Forecast - by Vehicle Type
- 8.1.1. Motorcycles
- 8.1.2. Cars
- 8.1.3. Vans
- 8.1.4. Buses
- 8.2. Market Analysis, Insights and Forecast - by Propulsion Type
- 8.2.1. Internal Combustion Engine (ICE)
- 8.2.2. Electric
- 8.1. Market Analysis, Insights and Forecast - by Vehicle Type
- 9. Rest of the World Ride Hailing Industry Analysis, Insights and Forecast, 2019-2031
- 9.1. Market Analysis, Insights and Forecast - by Vehicle Type
- 9.1.1. Motorcycles
- 9.1.2. Cars
- 9.1.3. Vans
- 9.1.4. Buses
- 9.2. Market Analysis, Insights and Forecast - by Propulsion Type
- 9.2.1. Internal Combustion Engine (ICE)
- 9.2.2. Electric
- 9.1. Market Analysis, Insights and Forecast - by Vehicle Type
- 10. North America Ride Hailing Industry Analysis, Insights and Forecast, 2019-2031
- 10.1. Market Analysis, Insights and Forecast - By Country/Sub-region
- 10.1.1 United States
- 10.1.2 Canada
- 10.1.3 Rest of North America
- 11. Europe Ride Hailing Industry Analysis, Insights and Forecast, 2019-2031
- 11.1. Market Analysis, Insights and Forecast - By Country/Sub-region
- 11.1.1 Germany
- 11.1.2 United Kingdom
- 11.1.3 France
- 11.1.4 Italy
- 11.1.5 Rest of Europe
- 12. Asia Pacific Ride Hailing Industry Analysis, Insights and Forecast, 2019-2031
- 12.1. Market Analysis, Insights and Forecast - By Country/Sub-region
- 12.1.1 China
- 12.1.2 India
- 12.1.3 Japan
- 12.1.4 South Korea
- 12.1.5 Rest of Asia Pacific
- 13. Rest of the World Ride Hailing Industry Analysis, Insights and Forecast, 2019-2031
- 13.1. Market Analysis, Insights and Forecast - By Country/Sub-region
- 13.1.1 South America
- 13.1.2 Middle East and Africa
- 14. Competitive Analysis
- 14.1. Global Market Share Analysis 2024
- 14.2. Company Profiles
- 14.2.1 BlaBla Car
- 14.2.1.1. Overview
- 14.2.1.2. Products
- 14.2.1.3. SWOT Analysis
- 14.2.1.4. Recent Developments
- 14.2.1.5. Financials (Based on Availability)
- 14.2.2 Uber Technologies Inc
- 14.2.2.1. Overview
- 14.2.2.2. Products
- 14.2.2.3. SWOT Analysis
- 14.2.2.4. Recent Developments
- 14.2.2.5. Financials (Based on Availability)
- 14.2.3 Didi Chuxing Technology Co
- 14.2.3.1. Overview
- 14.2.3.2. Products
- 14.2.3.3. SWOT Analysis
- 14.2.3.4. Recent Developments
- 14.2.3.5. Financials (Based on Availability)
- 14.2.4 SUOL INNOVATIONS LTD (inDrive
- 14.2.4.1. Overview
- 14.2.4.2. Products
- 14.2.4.3. SWOT Analysis
- 14.2.4.4. Recent Developments
- 14.2.4.5. Financials (Based on Availability)
- 14.2.5 Lyft Inc
- 14.2.5.1. Overview
- 14.2.5.2. Products
- 14.2.5.3. SWOT Analysis
- 14.2.5.4. Recent Developments
- 14.2.5.5. Financials (Based on Availability)
- 14.2.6 Ani Technologies Pvt Ltd (OLA)
- 14.2.6.1. Overview
- 14.2.6.2. Products
- 14.2.6.3. SWOT Analysis
- 14.2.6.4. Recent Developments
- 14.2.6.5. Financials (Based on Availability)
- 14.2.7 Gett Group
- 14.2.7.1. Overview
- 14.2.7.2. Products
- 14.2.7.3. SWOT Analysis
- 14.2.7.4. Recent Developments
- 14.2.7.5. Financials (Based on Availability)
- 14.2.8 Bolt Technology OU
- 14.2.8.1. Overview
- 14.2.8.2. Products
- 14.2.8.3. SWOT Analysis
- 14.2.8.4. Recent Developments
- 14.2.8.5. Financials (Based on Availability)
- 14.2.9 Maxi Mobility SL (Cabify)
- 14.2.9.1. Overview
- 14.2.9.2. Products
- 14.2.9.3. SWOT Analysis
- 14.2.9.4. Recent Developments
- 14.2.9.5. Financials (Based on Availability)
- 14.2.10 GoTo Group (GoJek)
- 14.2.10.1. Overview
- 14.2.10.2. Products
- 14.2.10.3. SWOT Analysis
- 14.2.10.4. Recent Developments
- 14.2.10.5. Financials (Based on Availability)
- 14.2.11 Xanh SM (GSM)
- 14.2.11.1. Overview
- 14.2.11.2. Products
- 14.2.11.3. SWOT Analysis
- 14.2.11.4. Recent Developments
- 14.2.11.5. Financials (Based on Availability)
- 14.2.12 Grab Holdings Inc
- 14.2.12.1. Overview
- 14.2.12.2. Products
- 14.2.12.3. SWOT Analysis
- 14.2.12.4. Recent Developments
- 14.2.12.5. Financials (Based on Availability)
- 14.2.1 BlaBla Car
List of Figures
- Figure 1: Global Ride Hailing Industry Revenue Breakdown (Million, %) by Region 2024 & 2032
- Figure 2: North America Ride Hailing Industry Revenue (Million), by Country 2024 & 2032
- Figure 3: North America Ride Hailing Industry Revenue Share (%), by Country 2024 & 2032
- Figure 4: Europe Ride Hailing Industry Revenue (Million), by Country 2024 & 2032
- Figure 5: Europe Ride Hailing Industry Revenue Share (%), by Country 2024 & 2032
- Figure 6: Asia Pacific Ride Hailing Industry Revenue (Million), by Country 2024 & 2032
- Figure 7: Asia Pacific Ride Hailing Industry Revenue Share (%), by Country 2024 & 2032
- Figure 8: Rest of the World Ride Hailing Industry Revenue (Million), by Country 2024 & 2032
- Figure 9: Rest of the World Ride Hailing Industry Revenue Share (%), by Country 2024 & 2032
- Figure 10: North America Ride Hailing Industry Revenue (Million), by Vehicle Type 2024 & 2032
- Figure 11: North America Ride Hailing Industry Revenue Share (%), by Vehicle Type 2024 & 2032
- Figure 12: North America Ride Hailing Industry Revenue (Million), by Propulsion Type 2024 & 2032
- Figure 13: North America Ride Hailing Industry Revenue Share (%), by Propulsion Type 2024 & 2032
- Figure 14: North America Ride Hailing Industry Revenue (Million), by Country 2024 & 2032
- Figure 15: North America Ride Hailing Industry Revenue Share (%), by Country 2024 & 2032
- Figure 16: Europe Ride Hailing Industry Revenue (Million), by Vehicle Type 2024 & 2032
- Figure 17: Europe Ride Hailing Industry Revenue Share (%), by Vehicle Type 2024 & 2032
- Figure 18: Europe Ride Hailing Industry Revenue (Million), by Propulsion Type 2024 & 2032
- Figure 19: Europe Ride Hailing Industry Revenue Share (%), by Propulsion Type 2024 & 2032
- Figure 20: Europe Ride Hailing Industry Revenue (Million), by Country 2024 & 2032
- Figure 21: Europe Ride Hailing Industry Revenue Share (%), by Country 2024 & 2032
- Figure 22: Asia Pacific Ride Hailing Industry Revenue (Million), by Vehicle Type 2024 & 2032
- Figure 23: Asia Pacific Ride Hailing Industry Revenue Share (%), by Vehicle Type 2024 & 2032
- Figure 24: Asia Pacific Ride Hailing Industry Revenue (Million), by Propulsion Type 2024 & 2032
- Figure 25: Asia Pacific Ride Hailing Industry Revenue Share (%), by Propulsion Type 2024 & 2032
- Figure 26: Asia Pacific Ride Hailing Industry Revenue (Million), by Country 2024 & 2032
- Figure 27: Asia Pacific Ride Hailing Industry Revenue Share (%), by Country 2024 & 2032
- Figure 28: Rest of the World Ride Hailing Industry Revenue (Million), by Vehicle Type 2024 & 2032
- Figure 29: Rest of the World Ride Hailing Industry Revenue Share (%), by Vehicle Type 2024 & 2032
- Figure 30: Rest of the World Ride Hailing Industry Revenue (Million), by Propulsion Type 2024 & 2032
- Figure 31: Rest of the World Ride Hailing Industry Revenue Share (%), by Propulsion Type 2024 & 2032
- Figure 32: Rest of the World Ride Hailing Industry Revenue (Million), by Country 2024 & 2032
- Figure 33: Rest of the World Ride Hailing Industry Revenue Share (%), by Country 2024 & 2032
List of Tables
- Table 1: Global Ride Hailing Industry Revenue Million Forecast, by Region 2019 & 2032
- Table 2: Global Ride Hailing Industry Revenue Million Forecast, by Vehicle Type 2019 & 2032
- Table 3: Global Ride Hailing Industry Revenue Million Forecast, by Propulsion Type 2019 & 2032
- Table 4: Global Ride Hailing Industry Revenue Million Forecast, by Region 2019 & 2032
- Table 5: Global Ride Hailing Industry Revenue Million Forecast, by Country 2019 & 2032
- Table 6: United States Ride Hailing Industry Revenue (Million) Forecast, by Application 2019 & 2032
- Table 7: Canada Ride Hailing Industry Revenue (Million) Forecast, by Application 2019 & 2032
- Table 8: Rest of North America Ride Hailing Industry Revenue (Million) Forecast, by Application 2019 & 2032
- Table 9: Global Ride Hailing Industry Revenue Million Forecast, by Country 2019 & 2032
- Table 10: Germany Ride Hailing Industry Revenue (Million) Forecast, by Application 2019 & 2032
- Table 11: United Kingdom Ride Hailing Industry Revenue (Million) Forecast, by Application 2019 & 2032
- Table 12: France Ride Hailing Industry Revenue (Million) Forecast, by Application 2019 & 2032
- Table 13: Italy Ride Hailing Industry Revenue (Million) Forecast, by Application 2019 & 2032
- Table 14: Rest of Europe Ride Hailing Industry Revenue (Million) Forecast, by Application 2019 & 2032
- Table 15: Global Ride Hailing Industry Revenue Million Forecast, by Country 2019 & 2032
- Table 16: China Ride Hailing Industry Revenue (Million) Forecast, by Application 2019 & 2032
- Table 17: India Ride Hailing Industry Revenue (Million) Forecast, by Application 2019 & 2032
- Table 18: Japan Ride Hailing Industry Revenue (Million) Forecast, by Application 2019 & 2032
- Table 19: South Korea Ride Hailing Industry Revenue (Million) Forecast, by Application 2019 & 2032
- Table 20: Rest of Asia Pacific Ride Hailing Industry Revenue (Million) Forecast, by Application 2019 & 2032
- Table 21: Global Ride Hailing Industry Revenue Million Forecast, by Country 2019 & 2032
- Table 22: South America Ride Hailing Industry Revenue (Million) Forecast, by Application 2019 & 2032
- Table 23: Middle East and Africa Ride Hailing Industry Revenue (Million) Forecast, by Application 2019 & 2032
- Table 24: Global Ride Hailing Industry Revenue Million Forecast, by Vehicle Type 2019 & 2032
- Table 25: Global Ride Hailing Industry Revenue Million Forecast, by Propulsion Type 2019 & 2032
- Table 26: Global Ride Hailing Industry Revenue Million Forecast, by Country 2019 & 2032
- Table 27: United States Ride Hailing Industry Revenue (Million) Forecast, by Application 2019 & 2032
- Table 28: Canada Ride Hailing Industry Revenue (Million) Forecast, by Application 2019 & 2032
- Table 29: Rest of North America Ride Hailing Industry Revenue (Million) Forecast, by Application 2019 & 2032
- Table 30: Global Ride Hailing Industry Revenue Million Forecast, by Vehicle Type 2019 & 2032
- Table 31: Global Ride Hailing Industry Revenue Million Forecast, by Propulsion Type 2019 & 2032
- Table 32: Global Ride Hailing Industry Revenue Million Forecast, by Country 2019 & 2032
- Table 33: Germany Ride Hailing Industry Revenue (Million) Forecast, by Application 2019 & 2032
- Table 34: United Kingdom Ride Hailing Industry Revenue (Million) Forecast, by Application 2019 & 2032
- Table 35: France Ride Hailing Industry Revenue (Million) Forecast, by Application 2019 & 2032
- Table 36: Italy Ride Hailing Industry Revenue (Million) Forecast, by Application 2019 & 2032
- Table 37: Rest of Europe Ride Hailing Industry Revenue (Million) Forecast, by Application 2019 & 2032
- Table 38: Global Ride Hailing Industry Revenue Million Forecast, by Vehicle Type 2019 & 2032
- Table 39: Global Ride Hailing Industry Revenue Million Forecast, by Propulsion Type 2019 & 2032
- Table 40: Global Ride Hailing Industry Revenue Million Forecast, by Country 2019 & 2032
- Table 41: China Ride Hailing Industry Revenue (Million) Forecast, by Application 2019 & 2032
- Table 42: India Ride Hailing Industry Revenue (Million) Forecast, by Application 2019 & 2032
- Table 43: Japan Ride Hailing Industry Revenue (Million) Forecast, by Application 2019 & 2032
- Table 44: South Korea Ride Hailing Industry Revenue (Million) Forecast, by Application 2019 & 2032
- Table 45: Rest of Asia Pacific Ride Hailing Industry Revenue (Million) Forecast, by Application 2019 & 2032
- Table 46: Global Ride Hailing Industry Revenue Million Forecast, by Vehicle Type 2019 & 2032
- Table 47: Global Ride Hailing Industry Revenue Million Forecast, by Propulsion Type 2019 & 2032
- Table 48: Global Ride Hailing Industry Revenue Million Forecast, by Country 2019 & 2032
- Table 49: South America Ride Hailing Industry Revenue (Million) Forecast, by Application 2019 & 2032
- Table 50: Middle East and Africa Ride Hailing Industry Revenue (Million) Forecast, by Application 2019 & 2032
Frequently Asked Questions
1. What is the projected Compound Annual Growth Rate (CAGR) of the Ride Hailing Industry?
The projected CAGR is approximately 9.64%.
2. Which companies are prominent players in the Ride Hailing Industry?
Key companies in the market include BlaBla Car, Uber Technologies Inc, Didi Chuxing Technology Co, SUOL INNOVATIONS LTD (inDrive, Lyft Inc, Ani Technologies Pvt Ltd (OLA), Gett Group, Bolt Technology OU, Maxi Mobility SL (Cabify), GoTo Group (GoJek), Xanh SM (GSM), Grab Holdings Inc.
3. What are the main segments of the Ride Hailing Industry?
The market segments include Vehicle Type, Propulsion Type.
4. Can you provide details about the market size?
The market size is estimated to be USD 185.64 Million as of 2022.
5. What are some drivers contributing to market growth?
Rising Traffic Congestion and Increasing Urban Population to Foster Market Growth.
6. What are the notable trends driving market growth?
The Cars Segment is Expected to Gain Traction During the Forecast Period.
7. Are there any restraints impacting market growth?
Strict Government Regulations and Policies Toward Ride-hailing Services Impact the Market Growth.
8. Can you provide examples of recent developments in the market?
April 2024: The Japanese government implemented the use of private ride-hailing services, which are accessible through mobile applications such as Uber and Go.
9. What pricing options are available for accessing the report?
Pricing options include single-user, multi-user, and enterprise licenses priced at USD 4750, USD 5250, and USD 8750 respectively.
10. Is the market size provided in terms of value or volume?
The market size is provided in terms of value, measured in Million.
11. Are there any specific market keywords associated with the report?
Yes, the market keyword associated with the report is "Ride Hailing Industry," which aids in identifying and referencing the specific market segment covered.
12. How do I determine which pricing option suits my needs best?
The pricing options vary based on user requirements and access needs. Individual users may opt for single-user licenses, while businesses requiring broader access may choose multi-user or enterprise licenses for cost-effective access to the report.
13. Are there any additional resources or data provided in the Ride Hailing Industry report?
While the report offers comprehensive insights, it's advisable to review the specific contents or supplementary materials provided to ascertain if additional resources or data are available.
14. How can I stay updated on further developments or reports in the Ride Hailing Industry?
To stay informed about further developments, trends, and reports in the Ride Hailing Industry, consider subscribing to industry newsletters, following relevant companies and organizations, or regularly checking reputable industry news sources and publications.
Methodology
Step 1 - Identification of Relevant Samples Size from Population Database


Step 2 - Approaches for Defining Global Market Size (Value, Volume* & Price*)

Note*: In applicable scenarios
Step 3 - Data Sources
Primary Research
- Web Analytics
- Survey Reports
- Research Institute
- Latest Research Reports
- Opinion Leaders
Secondary Research
- Annual Reports
- White Paper
- Latest Press Release
- Industry Association
- Paid Database
- Investor Presentations

Step 4 - Data Triangulation
Involves using different sources of information in order to increase the validity of a study
These sources are likely to be stakeholders in a program - participants, other researchers, program staff, other community members, and so on.
Then we put all data in single framework & apply various statistical tools to find out the dynamic on the market.
During the analysis stage, feedback from the stakeholder groups would be compared to determine areas of agreement as well as areas of divergence
