

Key Insights
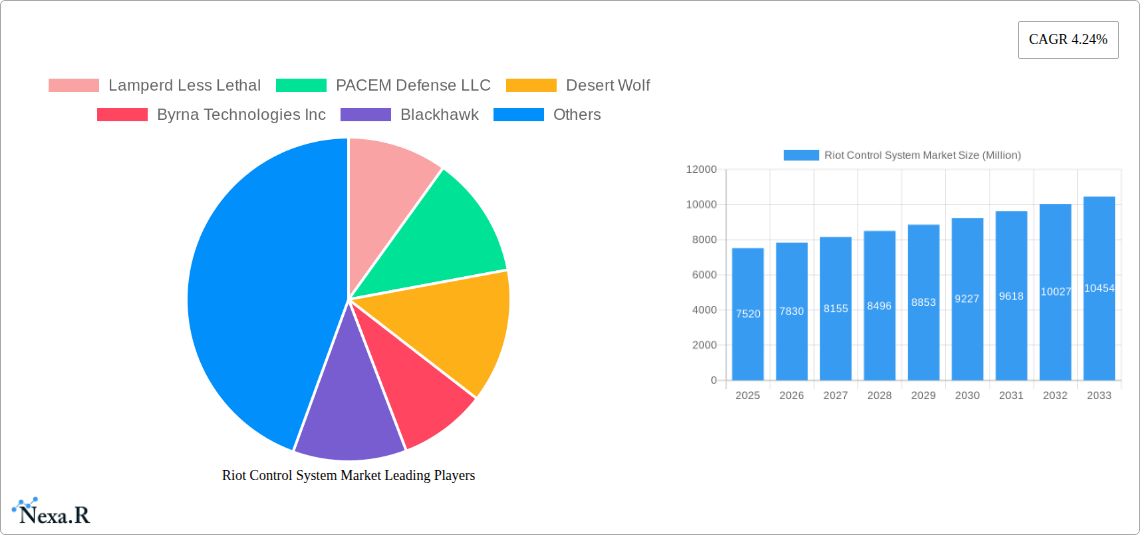
The global riot control systems market, valued at $7.52 billion in 2025, is projected to experience steady growth, exhibiting a compound annual growth rate (CAGR) of 4.24% from 2025 to 2033. This growth is fueled by several key factors. Increasing instances of civil unrest and social protests globally necessitate the deployment of effective and less-lethal riot control technologies. Law enforcement agencies and military special forces are continuously seeking advanced equipment to manage crowd control situations while minimizing casualties. Technological advancements in non-lethal weaponry, such as improved accuracy and reduced collateral damage potential in devices like pepper spray, rubber bullets and acoustic devices, are further driving market expansion. The rising adoption of body cameras and data analytics for improved situational awareness and accountability in riot control operations also contributes to market growth. The market is segmented by product type (personal protective equipment, shields, area denial systems, ammunition, explosives, gases and sprays), and end-user (law enforcement and special forces). North America currently holds a significant market share due to high defense spending and the prevalence of civil disturbances. However, the Asia-Pacific region is expected to witness significant growth due to increasing urbanization and potential for social unrest. The market faces challenges such as stringent regulations surrounding the use of less-lethal weapons and concerns regarding potential human rights violations. However, the focus on developing more sophisticated and ethically sound riot control technologies is anticipated to mitigate these concerns.
The competitive landscape is characterized by both established players and emerging companies. Major players, including Axon Enterprise Inc., Safariland LLC, and others are investing heavily in research and development to enhance product offerings and expand market reach. Strategic partnerships and collaborations are also becoming common as companies seek to leverage each other's strengths. The market's future growth will depend on factors such as government spending on security, technological innovations, and evolving regulations concerning less-lethal weapons. The demand for advanced training programs for law enforcement personnel on the safe and effective use of these systems will also influence market growth. A focus on ethical considerations and the development of less-harmful, but still effective, crowd control technologies will become increasingly important in shaping the future of the market.
Riot Control System Market: A Comprehensive Market Report (2019-2033)
This in-depth report provides a comprehensive analysis of the Riot Control System Market, covering market dynamics, growth trends, regional dominance, product landscape, key players, and future outlook. The study period spans from 2019 to 2033, with 2025 serving as the base and estimated year. The report segments the market by product type (Personal Protective Equipment, Shields, Area Denial systems, Ammunition, Explosives, Gases and Sprays) and end-user (Law Enforcement, Special Forces), offering granular insights into this critical sector. The total market size is projected to reach xx Million units by 2033.
Riot Control System Market Dynamics & Structure
The Riot Control System market is characterized by moderate concentration, with several key players holding significant market share. Technological innovation, particularly in non-lethal weaponry and drone technology, is a key driver. Stringent regulatory frameworks governing the use and sale of riot control equipment significantly impact market growth and product development. The market also faces pressure from the development of alternative crowd control methods and increasing scrutiny surrounding the ethical implications of riot control technologies. M&A activity has been relatively modest in recent years, with xx deals recorded between 2019 and 2024, indicating a stable but not rapidly consolidating market.
- Market Concentration: Moderately concentrated, with top 5 players holding approximately xx% market share in 2024.
- Technological Innovation: Focus on less-lethal options, improved accuracy, and integration with surveillance technologies.
- Regulatory Frameworks: Stringent regulations vary across geographies, impacting market access and product development.
- Competitive Substitutes: Alternative crowd control methods (e.g., communication strategies, de-escalation training) pose some competitive pressure.
- End-User Demographics: Primarily driven by government agencies (law enforcement and special forces) with varying budgetary constraints.
- M&A Trends: Relatively low M&A activity, suggesting a stable competitive landscape.
Riot Control System Market Growth Trends & Insights
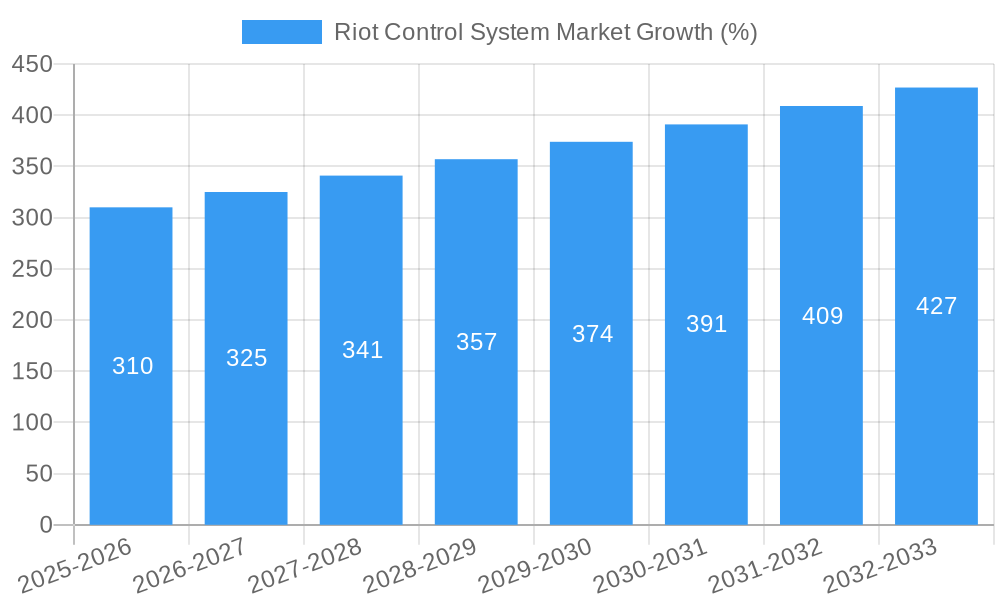
The Riot Control System market experienced steady growth between 2019 and 2024, primarily driven by increasing civil unrest globally and heightened security concerns. The market size grew from xx Million units in 2019 to xx Million units in 2024, registering a CAGR of xx%. Technological advancements, such as the integration of AI and drone technology, are expected to further accelerate market growth during the forecast period (2025-2033). Increased adoption of non-lethal weapons and sophisticated surveillance systems is also driving market expansion. Consumer behavior, reflecting a growing demand for safer and more effective crowd control solutions, is a significant factor. The market is projected to reach xx Million units by 2033, exhibiting a CAGR of xx% during the forecast period. Market penetration remains relatively low in certain regions, suggesting significant untapped potential.
Dominant Regions, Countries, or Segments in Riot Control System Market
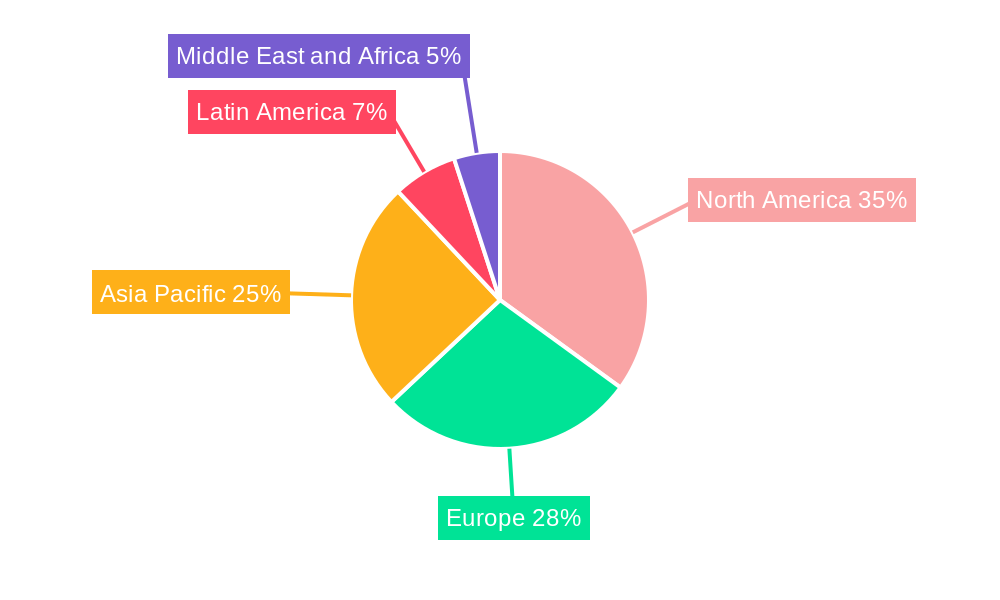
North America currently dominates the Riot Control System market, holding approximately xx% of the global market share in 2024, followed by Europe with xx%. This dominance is attributed to higher government spending on security and law enforcement, advanced technological infrastructure, and a strong presence of key market players. Within product types, Personal Protective Equipment and Ammunition (particularly less-lethal options like rubber bullets and bean bag rounds) represent the largest segments, accounting for approximately xx% and xx% of the market, respectively. The Law Enforcement sector is the primary end-user, driving the majority of market demand.
- Key Drivers (North America): High government spending on defense and security, technological advancements, and robust law enforcement infrastructure.
- Key Drivers (Europe): Growing concerns about terrorism and civil unrest, coupled with government investments in advanced security technologies.
- Dominant Segments: Personal Protective Equipment and Ammunition.
- Dominant End-User: Law Enforcement agencies.
Riot Control System Market Product Landscape
The Riot Control System market offers a diverse range of products, from personal protective equipment (PPE) such as helmets and shields to advanced non-lethal weapons like water cannons, tear gas, and sting grenades. Recent innovations include the development of less-lethal projectiles with improved accuracy and reduced potential for serious injury, as well as the integration of drones for delivering tear gas or other riot control agents. These advancements are driven by a growing focus on minimizing collateral damage and enhancing the safety of both law enforcement personnel and civilians. The unique selling propositions often center around enhanced safety features, improved effectiveness, and reduced long-term health consequences for those impacted by the equipment.
Key Drivers, Barriers & Challenges in Riot Control System Market
Key Drivers:
- Growing global instances of civil unrest and social protests.
- Increasing government spending on security and law enforcement.
- Technological advancements in non-lethal weapons and surveillance technologies.
Key Challenges:
- Ethical concerns surrounding the use of riot control equipment.
- Stringent regulations and licensing requirements.
- Supply chain disruptions affecting the availability of raw materials. This resulted in a xx% increase in production costs in 2022.
Emerging Opportunities in Riot Control System Market
- Expansion into developing markets with increasing security needs.
- Development of more sophisticated and less-lethal crowd control technologies.
- Integration of AI and big data analytics for improved situational awareness and response strategies.
Growth Accelerators in the Riot Control System Market Industry
Long-term growth will be fueled by continuous technological innovation leading to more effective and less-lethal solutions. Strategic partnerships between technology providers and government agencies will streamline procurement and deployment. Expanding into emerging markets with increasing security challenges presents significant opportunities for growth.
Key Players Shaping the Riot Control System Market Market
- Lamperd Less Lethal
- PACEM Defense LLC
- Desert Wolf
- Byrna Technologies Inc
- Blackhawk
- NonLethal Technologies Inc
- Axon Enterprise Inc
- Genasys Inc
- Etienne Lacroix Group
- Condor Non-lethal Technologies
- Combined Systems Inc
- Safariland LLC
Notable Milestones in Riot Control System Market Sector
- September 2022: BSF launched a tear gas shell-dropping drone system, demonstrating the integration of UAV technology in riot control.
- June 2022: Iranian police invested nearly USD 10 million in new anti-riot equipment, highlighting the growing demand in regions experiencing civil unrest.
In-Depth Riot Control System Market Market Outlook
The future of the Riot Control System market is bright, driven by sustained demand for effective yet less-lethal crowd control solutions and ongoing technological advancements. Strategic investments in R&D, coupled with expanding collaborations between technology providers and end-users, will further enhance market growth. The market's long-term potential is substantial, particularly in emerging markets and as technology continues to evolve to address both safety and ethical considerations.
Riot Control System Market Segmentation
-
1. Product Type
-
1.1. Personal Protective Equipment
- 1.1.1. Vests
- 1.1.2. Helmets
- 1.1.3. Gas Masks
- 1.1.4. Shields
-
1.2. Offensive Equipment
-
1.2.1. Area Denial
- 1.2.1.1. Anti-vehicle
- 1.2.1.2. Anti-personnel
-
1.2.2. Ammunition
- 1.2.2.1. Rubber Bullets
- 1.2.2.2. Wax Bullets
- 1.2.2.3. Plastic Bullets
- 1.2.2.4. Bean Bag Rounds
- 1.2.2.5. Sponge Grenade
-
1.2.3. Explosives
- 1.2.3.1. Flash Bang Grenades
- 1.2.3.2. Sting Grenades
-
1.2.4. Gases and Sprays
- 1.2.4.1. Water Canons
- 1.2.4.2. Scent-based Weapons
- 1.2.4.3. Tear Gas
- 1.2.4.4. Pepper Spray
- 1.2.5. Directed Energy Weapons
- 1.2.6. Electroshock Weapons
- 1.2.7. Other Offensive Equipment
-
1.2.1. Area Denial
-
1.1. Personal Protective Equipment
-
2. End-User
- 2.1. Law Enforcement
- 2.2. Special Forces
Riot Control System Market Segmentation By Geography
-
1. North America
- 1.1. United States
- 1.2. Canada
-
2. Europe
- 2.1. United Kingdom
- 2.2. France
- 2.3. Germany
- 2.4. Russia
- 2.5. Rest of Europe
-
3. Asia Pacific
- 3.1. China
- 3.2. India
- 3.3. Japan
- 3.4. South Korea
- 3.5. Rest of Asia Pacific
-
4. Latin America
- 4.1. Brazil
- 4.2. Rest of Latin America
-
5. Middle East and Africa
- 5.1. Saudi Arabia
- 5.2. United Arab Emirates
- 5.3. Israel
- 5.4. Rest of Middle East and Africa
Riot Control System Market REPORT HIGHLIGHTS
| Aspects | Details |
|---|---|
| Study Period | 2019-2033 |
| Base Year | 2024 |
| Estimated Year | 2025 |
| Forecast Period | 2025-2033 |
| Historical Period | 2019-2024 |
| Growth Rate | CAGR of 4.24% from 2019-2033 |
| Segmentation |
|
Table of Contents
- 1. Introduction
- 1.1. Research Scope
- 1.2. Market Segmentation
- 1.3. Research Methodology
- 1.4. Definitions and Assumptions
- 2. Executive Summary
- 2.1. Introduction
- 3. Market Dynamics
- 3.1. Introduction
- 3.2. Market Drivers
- 3.3. Market Restrains
- 3.4. Market Trends
- 3.4.1. The Offensive Equipment Segment is Expected to Experience the Highest Growth During the Forecast Period
- 4. Market Factor Analysis
- 4.1. Porters Five Forces
- 4.2. Supply/Value Chain
- 4.3. PESTEL analysis
- 4.4. Market Entropy
- 4.5. Patent/Trademark Analysis
- 5. Global Riot Control System Market Analysis, Insights and Forecast, 2019-2031
- 5.1. Market Analysis, Insights and Forecast - by Product Type
- 5.1.1. Personal Protective Equipment
- 5.1.1.1. Vests
- 5.1.1.2. Helmets
- 5.1.1.3. Gas Masks
- 5.1.1.4. Shields
- 5.1.2. Offensive Equipment
- 5.1.2.1. Area Denial
- 5.1.2.1.1. Anti-vehicle
- 5.1.2.1.2. Anti-personnel
- 5.1.2.2. Ammunition
- 5.1.2.2.1. Rubber Bullets
- 5.1.2.2.2. Wax Bullets
- 5.1.2.2.3. Plastic Bullets
- 5.1.2.2.4. Bean Bag Rounds
- 5.1.2.2.5. Sponge Grenade
- 5.1.2.3. Explosives
- 5.1.2.3.1. Flash Bang Grenades
- 5.1.2.3.2. Sting Grenades
- 5.1.2.4. Gases and Sprays
- 5.1.2.4.1. Water Canons
- 5.1.2.4.2. Scent-based Weapons
- 5.1.2.4.3. Tear Gas
- 5.1.2.4.4. Pepper Spray
- 5.1.2.5. Directed Energy Weapons
- 5.1.2.6. Electroshock Weapons
- 5.1.2.7. Other Offensive Equipment
- 5.1.2.1. Area Denial
- 5.1.1. Personal Protective Equipment
- 5.2. Market Analysis, Insights and Forecast - by End-User
- 5.2.1. Law Enforcement
- 5.2.2. Special Forces
- 5.3. Market Analysis, Insights and Forecast - by Region
- 5.3.1. North America
- 5.3.2. Europe
- 5.3.3. Asia Pacific
- 5.3.4. Latin America
- 5.3.5. Middle East and Africa
- 5.1. Market Analysis, Insights and Forecast - by Product Type
- 6. North America Riot Control System Market Analysis, Insights and Forecast, 2019-2031
- 6.1. Market Analysis, Insights and Forecast - by Product Type
- 6.1.1. Personal Protective Equipment
- 6.1.1.1. Vests
- 6.1.1.2. Helmets
- 6.1.1.3. Gas Masks
- 6.1.1.4. Shields
- 6.1.2. Offensive Equipment
- 6.1.2.1. Area Denial
- 6.1.2.1.1. Anti-vehicle
- 6.1.2.1.2. Anti-personnel
- 6.1.2.2. Ammunition
- 6.1.2.2.1. Rubber Bullets
- 6.1.2.2.2. Wax Bullets
- 6.1.2.2.3. Plastic Bullets
- 6.1.2.2.4. Bean Bag Rounds
- 6.1.2.2.5. Sponge Grenade
- 6.1.2.3. Explosives
- 6.1.2.3.1. Flash Bang Grenades
- 6.1.2.3.2. Sting Grenades
- 6.1.2.4. Gases and Sprays
- 6.1.2.4.1. Water Canons
- 6.1.2.4.2. Scent-based Weapons
- 6.1.2.4.3. Tear Gas
- 6.1.2.4.4. Pepper Spray
- 6.1.2.5. Directed Energy Weapons
- 6.1.2.6. Electroshock Weapons
- 6.1.2.7. Other Offensive Equipment
- 6.1.2.1. Area Denial
- 6.1.1. Personal Protective Equipment
- 6.2. Market Analysis, Insights and Forecast - by End-User
- 6.2.1. Law Enforcement
- 6.2.2. Special Forces
- 6.1. Market Analysis, Insights and Forecast - by Product Type
- 7. Europe Riot Control System Market Analysis, Insights and Forecast, 2019-2031
- 7.1. Market Analysis, Insights and Forecast - by Product Type
- 7.1.1. Personal Protective Equipment
- 7.1.1.1. Vests
- 7.1.1.2. Helmets
- 7.1.1.3. Gas Masks
- 7.1.1.4. Shields
- 7.1.2. Offensive Equipment
- 7.1.2.1. Area Denial
- 7.1.2.1.1. Anti-vehicle
- 7.1.2.1.2. Anti-personnel
- 7.1.2.2. Ammunition
- 7.1.2.2.1. Rubber Bullets
- 7.1.2.2.2. Wax Bullets
- 7.1.2.2.3. Plastic Bullets
- 7.1.2.2.4. Bean Bag Rounds
- 7.1.2.2.5. Sponge Grenade
- 7.1.2.3. Explosives
- 7.1.2.3.1. Flash Bang Grenades
- 7.1.2.3.2. Sting Grenades
- 7.1.2.4. Gases and Sprays
- 7.1.2.4.1. Water Canons
- 7.1.2.4.2. Scent-based Weapons
- 7.1.2.4.3. Tear Gas
- 7.1.2.4.4. Pepper Spray
- 7.1.2.5. Directed Energy Weapons
- 7.1.2.6. Electroshock Weapons
- 7.1.2.7. Other Offensive Equipment
- 7.1.2.1. Area Denial
- 7.1.1. Personal Protective Equipment
- 7.2. Market Analysis, Insights and Forecast - by End-User
- 7.2.1. Law Enforcement
- 7.2.2. Special Forces
- 7.1. Market Analysis, Insights and Forecast - by Product Type
- 8. Asia Pacific Riot Control System Market Analysis, Insights and Forecast, 2019-2031
- 8.1. Market Analysis, Insights and Forecast - by Product Type
- 8.1.1. Personal Protective Equipment
- 8.1.1.1. Vests
- 8.1.1.2. Helmets
- 8.1.1.3. Gas Masks
- 8.1.1.4. Shields
- 8.1.2. Offensive Equipment
- 8.1.2.1. Area Denial
- 8.1.2.1.1. Anti-vehicle
- 8.1.2.1.2. Anti-personnel
- 8.1.2.2. Ammunition
- 8.1.2.2.1. Rubber Bullets
- 8.1.2.2.2. Wax Bullets
- 8.1.2.2.3. Plastic Bullets
- 8.1.2.2.4. Bean Bag Rounds
- 8.1.2.2.5. Sponge Grenade
- 8.1.2.3. Explosives
- 8.1.2.3.1. Flash Bang Grenades
- 8.1.2.3.2. Sting Grenades
- 8.1.2.4. Gases and Sprays
- 8.1.2.4.1. Water Canons
- 8.1.2.4.2. Scent-based Weapons
- 8.1.2.4.3. Tear Gas
- 8.1.2.4.4. Pepper Spray
- 8.1.2.5. Directed Energy Weapons
- 8.1.2.6. Electroshock Weapons
- 8.1.2.7. Other Offensive Equipment
- 8.1.2.1. Area Denial
- 8.1.1. Personal Protective Equipment
- 8.2. Market Analysis, Insights and Forecast - by End-User
- 8.2.1. Law Enforcement
- 8.2.2. Special Forces
- 8.1. Market Analysis, Insights and Forecast - by Product Type
- 9. Latin America Riot Control System Market Analysis, Insights and Forecast, 2019-2031
- 9.1. Market Analysis, Insights and Forecast - by Product Type
- 9.1.1. Personal Protective Equipment
- 9.1.1.1. Vests
- 9.1.1.2. Helmets
- 9.1.1.3. Gas Masks
- 9.1.1.4. Shields
- 9.1.2. Offensive Equipment
- 9.1.2.1. Area Denial
- 9.1.2.1.1. Anti-vehicle
- 9.1.2.1.2. Anti-personnel
- 9.1.2.2. Ammunition
- 9.1.2.2.1. Rubber Bullets
- 9.1.2.2.2. Wax Bullets
- 9.1.2.2.3. Plastic Bullets
- 9.1.2.2.4. Bean Bag Rounds
- 9.1.2.2.5. Sponge Grenade
- 9.1.2.3. Explosives
- 9.1.2.3.1. Flash Bang Grenades
- 9.1.2.3.2. Sting Grenades
- 9.1.2.4. Gases and Sprays
- 9.1.2.4.1. Water Canons
- 9.1.2.4.2. Scent-based Weapons
- 9.1.2.4.3. Tear Gas
- 9.1.2.4.4. Pepper Spray
- 9.1.2.5. Directed Energy Weapons
- 9.1.2.6. Electroshock Weapons
- 9.1.2.7. Other Offensive Equipment
- 9.1.2.1. Area Denial
- 9.1.1. Personal Protective Equipment
- 9.2. Market Analysis, Insights and Forecast - by End-User
- 9.2.1. Law Enforcement
- 9.2.2. Special Forces
- 9.1. Market Analysis, Insights and Forecast - by Product Type
- 10. Middle East and Africa Riot Control System Market Analysis, Insights and Forecast, 2019-2031
- 10.1. Market Analysis, Insights and Forecast - by Product Type
- 10.1.1. Personal Protective Equipment
- 10.1.1.1. Vests
- 10.1.1.2. Helmets
- 10.1.1.3. Gas Masks
- 10.1.1.4. Shields
- 10.1.2. Offensive Equipment
- 10.1.2.1. Area Denial
- 10.1.2.1.1. Anti-vehicle
- 10.1.2.1.2. Anti-personnel
- 10.1.2.2. Ammunition
- 10.1.2.2.1. Rubber Bullets
- 10.1.2.2.2. Wax Bullets
- 10.1.2.2.3. Plastic Bullets
- 10.1.2.2.4. Bean Bag Rounds
- 10.1.2.2.5. Sponge Grenade
- 10.1.2.3. Explosives
- 10.1.2.3.1. Flash Bang Grenades
- 10.1.2.3.2. Sting Grenades
- 10.1.2.4. Gases and Sprays
- 10.1.2.4.1. Water Canons
- 10.1.2.4.2. Scent-based Weapons
- 10.1.2.4.3. Tear Gas
- 10.1.2.4.4. Pepper Spray
- 10.1.2.5. Directed Energy Weapons
- 10.1.2.6. Electroshock Weapons
- 10.1.2.7. Other Offensive Equipment
- 10.1.2.1. Area Denial
- 10.1.1. Personal Protective Equipment
- 10.2. Market Analysis, Insights and Forecast - by End-User
- 10.2.1. Law Enforcement
- 10.2.2. Special Forces
- 10.1. Market Analysis, Insights and Forecast - by Product Type
- 11. North America Riot Control System Market Analysis, Insights and Forecast, 2019-2031
- 11.1. Market Analysis, Insights and Forecast - By Country/Sub-region
- 11.1.1 United States
- 11.1.2 Canada
- 12. Europe Riot Control System Market Analysis, Insights and Forecast, 2019-2031
- 12.1. Market Analysis, Insights and Forecast - By Country/Sub-region
- 12.1.1 United Kingdom
- 12.1.2 France
- 12.1.3 Germany
- 12.1.4 Italy
- 12.1.5 Rest of Europe
- 13. Asia Pacific Riot Control System Market Analysis, Insights and Forecast, 2019-2031
- 13.1. Market Analysis, Insights and Forecast - By Country/Sub-region
- 13.1.1 China
- 13.1.2 India
- 13.1.3 Japan
- 13.1.4 South Korea
- 13.1.5 Rest of Asia Pacific
- 14. Latin America Riot Control System Market Analysis, Insights and Forecast, 2019-2031
- 14.1. Market Analysis, Insights and Forecast - By Country/Sub-region
- 14.1.1 Brazil
- 14.1.2 Mexico
- 14.1.3 Rest of Latin America
- 15. Middle East and Africa Riot Control System Market Analysis, Insights and Forecast, 2019-2031
- 15.1. Market Analysis, Insights and Forecast - By Country/Sub-region
- 15.1.1 Saudi Arabia
- 15.1.2 United Arab Emirates
- 15.1.3 South Africa
- 15.1.4 Qatar
- 15.1.5 Rest of Middle East and Africa
- 16. Competitive Analysis
- 16.1. Global Market Share Analysis 2024
- 16.2. Company Profiles
- 16.2.1 Lamperd Less Lethal
- 16.2.1.1. Overview
- 16.2.1.2. Products
- 16.2.1.3. SWOT Analysis
- 16.2.1.4. Recent Developments
- 16.2.1.5. Financials (Based on Availability)
- 16.2.2 PACEM Defense LLC
- 16.2.2.1. Overview
- 16.2.2.2. Products
- 16.2.2.3. SWOT Analysis
- 16.2.2.4. Recent Developments
- 16.2.2.5. Financials (Based on Availability)
- 16.2.3 Desert Wolf
- 16.2.3.1. Overview
- 16.2.3.2. Products
- 16.2.3.3. SWOT Analysis
- 16.2.3.4. Recent Developments
- 16.2.3.5. Financials (Based on Availability)
- 16.2.4 Byrna Technologies Inc
- 16.2.4.1. Overview
- 16.2.4.2. Products
- 16.2.4.3. SWOT Analysis
- 16.2.4.4. Recent Developments
- 16.2.4.5. Financials (Based on Availability)
- 16.2.5 Blackhawk
- 16.2.5.1. Overview
- 16.2.5.2. Products
- 16.2.5.3. SWOT Analysis
- 16.2.5.4. Recent Developments
- 16.2.5.5. Financials (Based on Availability)
- 16.2.6 NonLethal Technologies Inc
- 16.2.6.1. Overview
- 16.2.6.2. Products
- 16.2.6.3. SWOT Analysis
- 16.2.6.4. Recent Developments
- 16.2.6.5. Financials (Based on Availability)
- 16.2.7 Axon Enterprise Inc
- 16.2.7.1. Overview
- 16.2.7.2. Products
- 16.2.7.3. SWOT Analysis
- 16.2.7.4. Recent Developments
- 16.2.7.5. Financials (Based on Availability)
- 16.2.8 Genasys Inc
- 16.2.8.1. Overview
- 16.2.8.2. Products
- 16.2.8.3. SWOT Analysis
- 16.2.8.4. Recent Developments
- 16.2.8.5. Financials (Based on Availability)
- 16.2.9 Etienne Lacroix Group
- 16.2.9.1. Overview
- 16.2.9.2. Products
- 16.2.9.3. SWOT Analysis
- 16.2.9.4. Recent Developments
- 16.2.9.5. Financials (Based on Availability)
- 16.2.10 Condor Non-lethal Technologies
- 16.2.10.1. Overview
- 16.2.10.2. Products
- 16.2.10.3. SWOT Analysis
- 16.2.10.4. Recent Developments
- 16.2.10.5. Financials (Based on Availability)
- 16.2.11 Combined Systems Inc
- 16.2.11.1. Overview
- 16.2.11.2. Products
- 16.2.11.3. SWOT Analysis
- 16.2.11.4. Recent Developments
- 16.2.11.5. Financials (Based on Availability)
- 16.2.12 Safariland LLC
- 16.2.12.1. Overview
- 16.2.12.2. Products
- 16.2.12.3. SWOT Analysis
- 16.2.12.4. Recent Developments
- 16.2.12.5. Financials (Based on Availability)
- 16.2.1 Lamperd Less Lethal
List of Figures
- Figure 1: Global Riot Control System Market Revenue Breakdown (Million, %) by Region 2024 & 2032
- Figure 2: North America Riot Control System Market Revenue (Million), by Country 2024 & 2032
- Figure 3: North America Riot Control System Market Revenue Share (%), by Country 2024 & 2032
- Figure 4: Europe Riot Control System Market Revenue (Million), by Country 2024 & 2032
- Figure 5: Europe Riot Control System Market Revenue Share (%), by Country 2024 & 2032
- Figure 6: Asia Pacific Riot Control System Market Revenue (Million), by Country 2024 & 2032
- Figure 7: Asia Pacific Riot Control System Market Revenue Share (%), by Country 2024 & 2032
- Figure 8: Latin America Riot Control System Market Revenue (Million), by Country 2024 & 2032
- Figure 9: Latin America Riot Control System Market Revenue Share (%), by Country 2024 & 2032
- Figure 10: Middle East and Africa Riot Control System Market Revenue (Million), by Country 2024 & 2032
- Figure 11: Middle East and Africa Riot Control System Market Revenue Share (%), by Country 2024 & 2032
- Figure 12: North America Riot Control System Market Revenue (Million), by Product Type 2024 & 2032
- Figure 13: North America Riot Control System Market Revenue Share (%), by Product Type 2024 & 2032
- Figure 14: North America Riot Control System Market Revenue (Million), by End-User 2024 & 2032
- Figure 15: North America Riot Control System Market Revenue Share (%), by End-User 2024 & 2032
- Figure 16: North America Riot Control System Market Revenue (Million), by Country 2024 & 2032
- Figure 17: North America Riot Control System Market Revenue Share (%), by Country 2024 & 2032
- Figure 18: Europe Riot Control System Market Revenue (Million), by Product Type 2024 & 2032
- Figure 19: Europe Riot Control System Market Revenue Share (%), by Product Type 2024 & 2032
- Figure 20: Europe Riot Control System Market Revenue (Million), by End-User 2024 & 2032
- Figure 21: Europe Riot Control System Market Revenue Share (%), by End-User 2024 & 2032
- Figure 22: Europe Riot Control System Market Revenue (Million), by Country 2024 & 2032
- Figure 23: Europe Riot Control System Market Revenue Share (%), by Country 2024 & 2032
- Figure 24: Asia Pacific Riot Control System Market Revenue (Million), by Product Type 2024 & 2032
- Figure 25: Asia Pacific Riot Control System Market Revenue Share (%), by Product Type 2024 & 2032
- Figure 26: Asia Pacific Riot Control System Market Revenue (Million), by End-User 2024 & 2032
- Figure 27: Asia Pacific Riot Control System Market Revenue Share (%), by End-User 2024 & 2032
- Figure 28: Asia Pacific Riot Control System Market Revenue (Million), by Country 2024 & 2032
- Figure 29: Asia Pacific Riot Control System Market Revenue Share (%), by Country 2024 & 2032
- Figure 30: Latin America Riot Control System Market Revenue (Million), by Product Type 2024 & 2032
- Figure 31: Latin America Riot Control System Market Revenue Share (%), by Product Type 2024 & 2032
- Figure 32: Latin America Riot Control System Market Revenue (Million), by End-User 2024 & 2032
- Figure 33: Latin America Riot Control System Market Revenue Share (%), by End-User 2024 & 2032
- Figure 34: Latin America Riot Control System Market Revenue (Million), by Country 2024 & 2032
- Figure 35: Latin America Riot Control System Market Revenue Share (%), by Country 2024 & 2032
- Figure 36: Middle East and Africa Riot Control System Market Revenue (Million), by Product Type 2024 & 2032
- Figure 37: Middle East and Africa Riot Control System Market Revenue Share (%), by Product Type 2024 & 2032
- Figure 38: Middle East and Africa Riot Control System Market Revenue (Million), by End-User 2024 & 2032
- Figure 39: Middle East and Africa Riot Control System Market Revenue Share (%), by End-User 2024 & 2032
- Figure 40: Middle East and Africa Riot Control System Market Revenue (Million), by Country 2024 & 2032
- Figure 41: Middle East and Africa Riot Control System Market Revenue Share (%), by Country 2024 & 2032
List of Tables
- Table 1: Global Riot Control System Market Revenue Million Forecast, by Region 2019 & 2032
- Table 2: Global Riot Control System Market Revenue Million Forecast, by Product Type 2019 & 2032
- Table 3: Global Riot Control System Market Revenue Million Forecast, by End-User 2019 & 2032
- Table 4: Global Riot Control System Market Revenue Million Forecast, by Region 2019 & 2032
- Table 5: Global Riot Control System Market Revenue Million Forecast, by Country 2019 & 2032
- Table 6: United States Riot Control System Market Revenue (Million) Forecast, by Application 2019 & 2032
- Table 7: Canada Riot Control System Market Revenue (Million) Forecast, by Application 2019 & 2032
- Table 8: Global Riot Control System Market Revenue Million Forecast, by Country 2019 & 2032
- Table 9: United Kingdom Riot Control System Market Revenue (Million) Forecast, by Application 2019 & 2032
- Table 10: France Riot Control System Market Revenue (Million) Forecast, by Application 2019 & 2032
- Table 11: Germany Riot Control System Market Revenue (Million) Forecast, by Application 2019 & 2032
- Table 12: Italy Riot Control System Market Revenue (Million) Forecast, by Application 2019 & 2032
- Table 13: Rest of Europe Riot Control System Market Revenue (Million) Forecast, by Application 2019 & 2032
- Table 14: Global Riot Control System Market Revenue Million Forecast, by Country 2019 & 2032
- Table 15: China Riot Control System Market Revenue (Million) Forecast, by Application 2019 & 2032
- Table 16: India Riot Control System Market Revenue (Million) Forecast, by Application 2019 & 2032
- Table 17: Japan Riot Control System Market Revenue (Million) Forecast, by Application 2019 & 2032
- Table 18: South Korea Riot Control System Market Revenue (Million) Forecast, by Application 2019 & 2032
- Table 19: Rest of Asia Pacific Riot Control System Market Revenue (Million) Forecast, by Application 2019 & 2032
- Table 20: Global Riot Control System Market Revenue Million Forecast, by Country 2019 & 2032
- Table 21: Brazil Riot Control System Market Revenue (Million) Forecast, by Application 2019 & 2032
- Table 22: Mexico Riot Control System Market Revenue (Million) Forecast, by Application 2019 & 2032
- Table 23: Rest of Latin America Riot Control System Market Revenue (Million) Forecast, by Application 2019 & 2032
- Table 24: Global Riot Control System Market Revenue Million Forecast, by Country 2019 & 2032
- Table 25: Saudi Arabia Riot Control System Market Revenue (Million) Forecast, by Application 2019 & 2032
- Table 26: United Arab Emirates Riot Control System Market Revenue (Million) Forecast, by Application 2019 & 2032
- Table 27: South Africa Riot Control System Market Revenue (Million) Forecast, by Application 2019 & 2032
- Table 28: Qatar Riot Control System Market Revenue (Million) Forecast, by Application 2019 & 2032
- Table 29: Rest of Middle East and Africa Riot Control System Market Revenue (Million) Forecast, by Application 2019 & 2032
- Table 30: Global Riot Control System Market Revenue Million Forecast, by Product Type 2019 & 2032
- Table 31: Global Riot Control System Market Revenue Million Forecast, by End-User 2019 & 2032
- Table 32: Global Riot Control System Market Revenue Million Forecast, by Country 2019 & 2032
- Table 33: United States Riot Control System Market Revenue (Million) Forecast, by Application 2019 & 2032
- Table 34: Canada Riot Control System Market Revenue (Million) Forecast, by Application 2019 & 2032
- Table 35: Global Riot Control System Market Revenue Million Forecast, by Product Type 2019 & 2032
- Table 36: Global Riot Control System Market Revenue Million Forecast, by End-User 2019 & 2032
- Table 37: Global Riot Control System Market Revenue Million Forecast, by Country 2019 & 2032
- Table 38: United Kingdom Riot Control System Market Revenue (Million) Forecast, by Application 2019 & 2032
- Table 39: France Riot Control System Market Revenue (Million) Forecast, by Application 2019 & 2032
- Table 40: Germany Riot Control System Market Revenue (Million) Forecast, by Application 2019 & 2032
- Table 41: Russia Riot Control System Market Revenue (Million) Forecast, by Application 2019 & 2032
- Table 42: Rest of Europe Riot Control System Market Revenue (Million) Forecast, by Application 2019 & 2032
- Table 43: Global Riot Control System Market Revenue Million Forecast, by Product Type 2019 & 2032
- Table 44: Global Riot Control System Market Revenue Million Forecast, by End-User 2019 & 2032
- Table 45: Global Riot Control System Market Revenue Million Forecast, by Country 2019 & 2032
- Table 46: China Riot Control System Market Revenue (Million) Forecast, by Application 2019 & 2032
- Table 47: India Riot Control System Market Revenue (Million) Forecast, by Application 2019 & 2032
- Table 48: Japan Riot Control System Market Revenue (Million) Forecast, by Application 2019 & 2032
- Table 49: South Korea Riot Control System Market Revenue (Million) Forecast, by Application 2019 & 2032
- Table 50: Rest of Asia Pacific Riot Control System Market Revenue (Million) Forecast, by Application 2019 & 2032
- Table 51: Global Riot Control System Market Revenue Million Forecast, by Product Type 2019 & 2032
- Table 52: Global Riot Control System Market Revenue Million Forecast, by End-User 2019 & 2032
- Table 53: Global Riot Control System Market Revenue Million Forecast, by Country 2019 & 2032
- Table 54: Brazil Riot Control System Market Revenue (Million) Forecast, by Application 2019 & 2032
- Table 55: Rest of Latin America Riot Control System Market Revenue (Million) Forecast, by Application 2019 & 2032
- Table 56: Global Riot Control System Market Revenue Million Forecast, by Product Type 2019 & 2032
- Table 57: Global Riot Control System Market Revenue Million Forecast, by End-User 2019 & 2032
- Table 58: Global Riot Control System Market Revenue Million Forecast, by Country 2019 & 2032
- Table 59: Saudi Arabia Riot Control System Market Revenue (Million) Forecast, by Application 2019 & 2032
- Table 60: United Arab Emirates Riot Control System Market Revenue (Million) Forecast, by Application 2019 & 2032
- Table 61: Israel Riot Control System Market Revenue (Million) Forecast, by Application 2019 & 2032
- Table 62: Rest of Middle East and Africa Riot Control System Market Revenue (Million) Forecast, by Application 2019 & 2032
Frequently Asked Questions
1. What is the projected Compound Annual Growth Rate (CAGR) of the Riot Control System Market?
The projected CAGR is approximately 4.24%.
2. Which companies are prominent players in the Riot Control System Market?
Key companies in the market include Lamperd Less Lethal, PACEM Defense LLC, Desert Wolf, Byrna Technologies Inc, Blackhawk, NonLethal Technologies Inc, Axon Enterprise Inc, Genasys Inc, Etienne Lacroix Group, Condor Non-lethal Technologies, Combined Systems Inc, Safariland LLC.
3. What are the main segments of the Riot Control System Market?
The market segments include Product Type, End-User.
4. Can you provide details about the market size?
The market size is estimated to be USD 7.52 Million as of 2022.
5. What are some drivers contributing to market growth?
N/A
6. What are the notable trends driving market growth?
The Offensive Equipment Segment is Expected to Experience the Highest Growth During the Forecast Period.
7. Are there any restraints impacting market growth?
N/A
8. Can you provide examples of recent developments in the market?
September 2022: BSF launched a tear gas shell-dropping drone system that will be useful for security forces to control protesters and rioters. It can be used for launching shells from an unmanned aerial vehicle (UAV).
9. What pricing options are available for accessing the report?
Pricing options include single-user, multi-user, and enterprise licenses priced at USD 4750, USD 5250, and USD 8750 respectively.
10. Is the market size provided in terms of value or volume?
The market size is provided in terms of value, measured in Million.
11. Are there any specific market keywords associated with the report?
Yes, the market keyword associated with the report is "Riot Control System Market," which aids in identifying and referencing the specific market segment covered.
12. How do I determine which pricing option suits my needs best?
The pricing options vary based on user requirements and access needs. Individual users may opt for single-user licenses, while businesses requiring broader access may choose multi-user or enterprise licenses for cost-effective access to the report.
13. Are there any additional resources or data provided in the Riot Control System Market report?
While the report offers comprehensive insights, it's advisable to review the specific contents or supplementary materials provided to ascertain if additional resources or data are available.
14. How can I stay updated on further developments or reports in the Riot Control System Market?
To stay informed about further developments, trends, and reports in the Riot Control System Market, consider subscribing to industry newsletters, following relevant companies and organizations, or regularly checking reputable industry news sources and publications.
Methodology
Step 1 - Identification of Relevant Samples Size from Population Database


Step 2 - Approaches for Defining Global Market Size (Value, Volume* & Price*)

Note*: In applicable scenarios
Step 3 - Data Sources
Primary Research
- Web Analytics
- Survey Reports
- Research Institute
- Latest Research Reports
- Opinion Leaders
Secondary Research
- Annual Reports
- White Paper
- Latest Press Release
- Industry Association
- Paid Database
- Investor Presentations

Step 4 - Data Triangulation
Involves using different sources of information in order to increase the validity of a study
These sources are likely to be stakeholders in a program - participants, other researchers, program staff, other community members, and so on.
Then we put all data in single framework & apply various statistical tools to find out the dynamic on the market.
During the analysis stage, feedback from the stakeholder groups would be compared to determine areas of agreement as well as areas of divergence
