

Key Insights
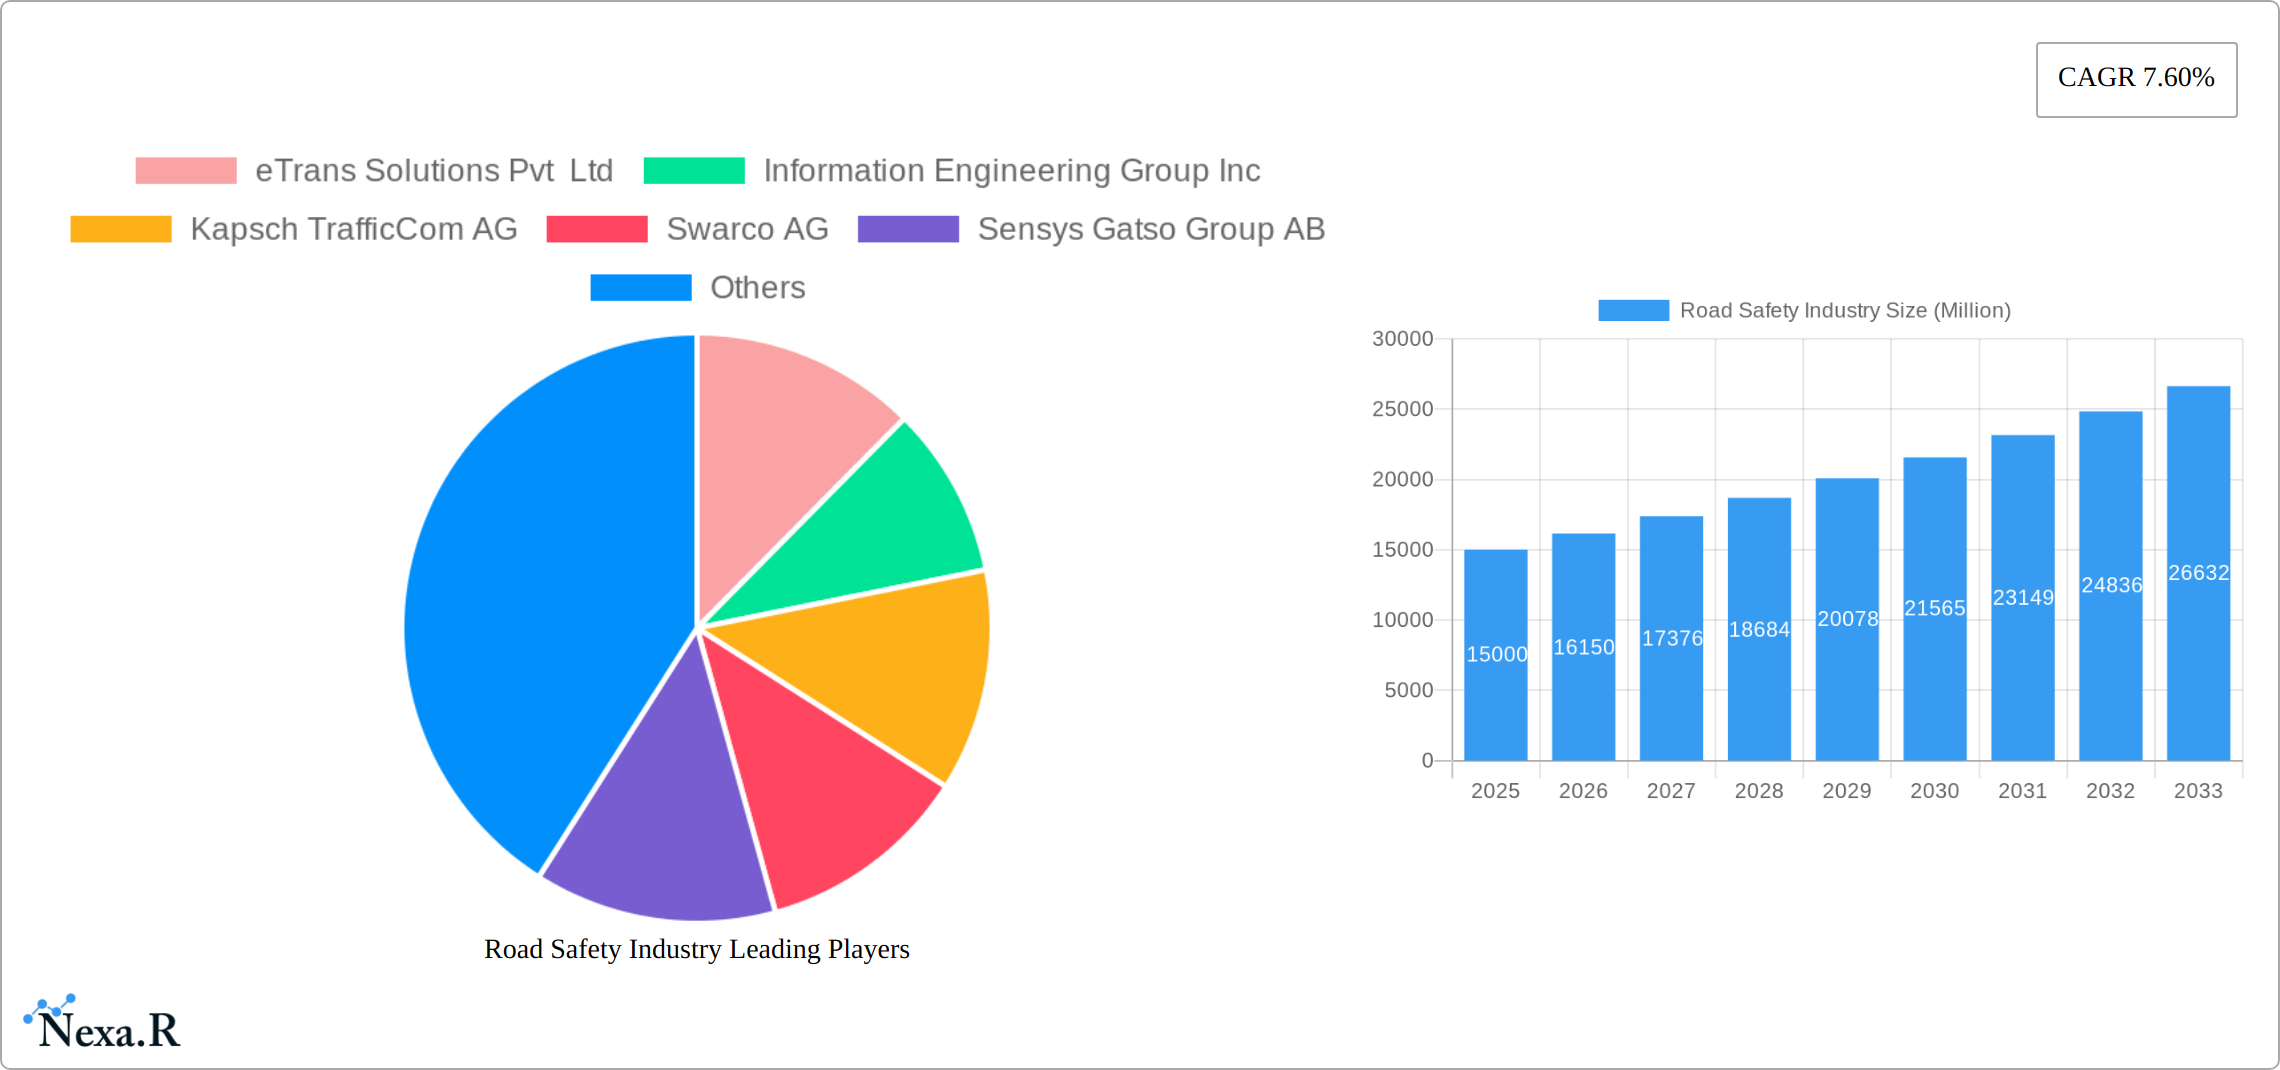
The global road safety market is experiencing robust growth, driven by increasing government initiatives to improve road infrastructure and reduce traffic accidents. A compound annual growth rate (CAGR) of 7.60% from 2019 to 2033 indicates a significant expansion, with the market value projected to reach substantial figures by 2033. This growth is fueled by several key factors. Technological advancements in intelligent transportation systems (ITS), including advanced driver-assistance systems (ADAS) and connected vehicle technology, are enhancing road safety significantly. The rising adoption of red light, speed, and bus lane enforcement systems, alongside incident detection and response technologies, contributes to improved traffic management and accident prevention. Furthermore, increasing urbanization and the resulting rise in traffic congestion necessitate more sophisticated safety measures, boosting market demand. The market is segmented by solution (red light, speed, bus lane, and section enforcement; incident detection and response) and services (consulting, support and maintenance, integration and deployment). The North American and European markets currently hold significant shares, but the Asia-Pacific region is projected to witness substantial growth due to rapid infrastructure development and rising vehicle ownership. Competitive players such as eTrans Solutions, Kapsch TrafficCom, and Sensys Gatso are actively contributing to innovation and market expansion.
While the market enjoys strong growth prospects, challenges remain. High initial investment costs associated with implementing advanced road safety technologies can act as a restraint, particularly in developing countries. Furthermore, data privacy concerns and the need for robust cybersecurity measures are crucial considerations for the industry. The integration of various technologies within existing infrastructure can also present complexities. Despite these challenges, the increasing awareness of road safety and the rising demand for effective solutions will continue to drive market growth, with a considerable focus on innovative technologies and sustainable solutions. The market is expected to be shaped by factors such as government regulations, technological innovation, and rising public awareness of road safety.
Road Safety Industry Market Report: 2019-2033
This comprehensive report provides an in-depth analysis of the global Road Safety Industry market, encompassing market dynamics, growth trends, regional insights, competitive landscape, and future outlook. The report covers the period 2019-2033, with a focus on the forecast period 2025-2033 and a base year of 2025. The study segments the market by solution (Red Light Enforcement, Speed Enforcement, Bus Lane Enforcement & Section Enforcement, Incident Detection & Response) and services (Consulting, Support & Maintenance, Integration & Deployment). This detailed analysis is crucial for industry professionals, investors, and stakeholders seeking to understand and capitalize on the opportunities within this vital sector. The market size is expected to reach xx Million by 2033.
Road Safety Industry Market Dynamics & Structure
The global road safety industry is characterized by a moderately concentrated market structure, with several key players vying for market share. Technological innovation, driven by advancements in AI, machine learning, and sensor technology, plays a crucial role in shaping market dynamics. Stringent regulatory frameworks and evolving safety standards across different regions influence product development and adoption rates. Furthermore, the industry is experiencing increased M&A activity, reflecting consolidation trends and efforts to expand product portfolios.
- Market Concentration: Moderately concentrated, with top 10 players holding approximately xx% market share in 2024.
- Technological Innovation: AI, machine learning, and advanced sensor technologies are key drivers of innovation, leading to smarter, more effective safety solutions.
- Regulatory Frameworks: Varying regulations across countries create diverse market opportunities and challenges, impacting product compliance and market entry strategies.
- Competitive Substitutes: Limited direct substitutes, but alternative approaches to traffic management (e.g., improved road design) can indirectly impact market growth.
- End-User Demographics: Primarily government agencies, municipalities, and transportation authorities, with growing adoption by private sector companies.
- M&A Trends: Significant M&A activity observed in recent years, with an estimated xx deals between 2019 and 2024. Deal values are expected to reach xx Million during the forecast period.
Road Safety Industry Growth Trends & Insights
The global road safety market is experiencing robust growth, driven by increasing government initiatives to improve road safety, rising urbanization leading to increased traffic congestion, and technological advancements. The market is witnessing significant adoption rates for advanced solutions, particularly in developed regions. Technological disruptions, such as the integration of AI and IoT in traffic management systems, are reshaping industry dynamics and creating new growth avenues. Consumer behavior shifts toward greater awareness of road safety and demand for safer infrastructure are also contributing factors.
The market exhibited a CAGR of xx% during the historical period (2019-2024) and is projected to maintain a CAGR of xx% during the forecast period (2025-2033). Market penetration is expected to reach xx% by 2033, driven by increasing investments in intelligent transportation systems. Specific details regarding XXX will be included in the full report.

Dominant Regions, Countries, or Segments in Road Safety Industry
North America and Europe currently dominate the road safety market, driven by robust infrastructure development, stringent regulations, and high levels of technological adoption. However, Asia-Pacific is anticipated to witness the fastest growth rate during the forecast period, fueled by rapid urbanization and increasing government spending on road infrastructure improvements.
By Solution:
- Speed Enforcement: Largest segment, driven by widespread adoption across regions.
- Red Light Enforcement: Significant growth potential, with increasing adoption of automated enforcement systems.
- Incident Detection & Response: Rapidly expanding segment, with the integration of intelligent transportation systems.
By Services:
- Consulting: Steady demand, driven by the need for expert guidance on implementing road safety solutions.
- Integration & Deployment: High growth potential, as more complex systems require specialized services.
Road Safety Industry Product Landscape
The road safety industry offers a diverse range of products, from traditional speed cameras to advanced AI-powered traffic management systems. Recent innovations focus on enhancing system accuracy, integrating real-time data analysis, and improving overall efficiency. Unique selling propositions (USPs) often include improved accuracy, ease of use, reduced maintenance costs, and advanced features such as automated incident detection and response. Technological advancements are driving the transition towards more intelligent and integrated systems.
Key Drivers, Barriers & Challenges in Road Safety Industry
Key Drivers:
- Increasing government investments in road safety infrastructure.
- Growing awareness of road safety risks and the need for improved solutions.
- Technological advancements enabling more sophisticated and effective safety systems.
- Stringent regulations and standards pushing for improved safety measures.
Challenges:
- High initial investment costs associated with implementing advanced safety solutions.
- Data privacy concerns related to the collection and use of traffic data.
- Integration complexities and interoperability issues between different systems.
- Competition from established players and new entrants in the market. This competition is estimated to suppress growth by approximately xx% in the coming years.
Emerging Opportunities in Road Safety Industry
Emerging opportunities are concentrated in several key areas:
- Expanding market penetration in developing economies.
- Integration of AI and machine learning for predictive safety analysis.
- Development of new applications for improved pedestrian and cyclist safety.
- Increased focus on proactive safety measures, beyond reactive enforcement.
Growth Accelerators in the Road Safety Industry
Technological breakthroughs, such as advancements in sensor technology and AI, are major growth catalysts. Strategic partnerships between technology providers and government agencies are accelerating market penetration. Aggressive expansion strategies, focusing on emerging markets, are crucial for long-term growth and market share.
Key Players Shaping the Road Safety Industry Market
- eTrans Solutions Pvt Ltd
- Information Engineering Group Inc
- Kapsch TrafficCom AG
- Swarco AG
- Sensys Gatso Group AB
- Motorola
- Jenoptik AG
- VITRONIC
- Redflex Holdings Limited
- Conduent Business Services LLC
- FRED Engineering
- Clearview Intelligence Limited
- FLIR Systems Inc
- Connected Wise LLC
Notable Milestones in Road Safety Industry Sector
- March 2022: The world's smartest traffic management system debuts in Melbourne, showcasing advanced AI and sensor technology to improve traffic flow and road safety.
- March 2022: Sensys Gatso Group wins a SEK 6 million contract (USD 575,000) from the Belgian Walloon government, highlighting the growing demand for its traffic enforcement solutions.
In-Depth Road Safety Industry Market Outlook
The road safety industry is poised for substantial growth, driven by technological innovation, increasing government initiatives, and growing awareness of road safety concerns. Strategic opportunities exist in expanding into untapped markets, developing innovative applications, and leveraging strategic partnerships to enhance market penetration. The market's future potential is significant, presenting attractive opportunities for both established players and new entrants.
Road Safety Industry Segmentation
-
1. Solution
- 1.1. Red Light Enforcement
- 1.2. Speed Enforcement
- 1.3. Bus Lane Enforcement and Section Enforcement
- 1.4. Incident Detection and Response
-
2. Services
- 2.1. Consulting
- 2.2. Support and Maintenance
- 2.3. Integration and Deployment
Road Safety Industry Segmentation By Geography
-
1. North America
- 1.1. United States
- 1.2. Canada
-
2. Europe
- 2.1. United Kingdom
- 2.2. France
- 2.3. Germany
- 2.4. Rest of Europe
-
3. Asia Pacific
- 3.1. China
- 3.2. India
- 3.3. Japan
- 3.4. Rest of Asia Pacific
- 4. Latin America
- 5. Middle East and Africa

Road Safety Industry REPORT HIGHLIGHTS
| Aspects | Details |
|---|---|
| Study Period | 2019-2033 |
| Base Year | 2024 |
| Estimated Year | 2025 |
| Forecast Period | 2025-2033 |
| Historical Period | 2019-2024 |
| Growth Rate | CAGR of 7.60% from 2019-2033 |
| Segmentation |
|
Table of Contents
- 1. Introduction
- 1.1. Research Scope
- 1.2. Market Segmentation
- 1.3. Research Methodology
- 1.4. Definitions and Assumptions
- 2. Executive Summary
- 2.1. Introduction
- 3. Market Dynamics
- 3.1. Introduction
- 3.2. Market Drivers
- 3.2.1. Increasing Number of Road Accidents and Fatalities; Increasing Need for Public Security and Improvement; Government Initiatives to Enhance Road Safety
- 3.3. Market Restrains
- 3.3.1. High Capital Investment due to Implementation of New Technologies; Risk and Congestion Associated with Trade Routes
- 3.4. Market Trends
- 3.4.1. The surge in the Number of Road Accidents and Fatalities Gain Momentum in the Market.
- 4. Market Factor Analysis
- 4.1. Porters Five Forces
- 4.2. Supply/Value Chain
- 4.3. PESTEL analysis
- 4.4. Market Entropy
- 4.5. Patent/Trademark Analysis
- 5. Global Road Safety Industry Analysis, Insights and Forecast, 2019-2031
- 5.1. Market Analysis, Insights and Forecast - by Solution
- 5.1.1. Red Light Enforcement
- 5.1.2. Speed Enforcement
- 5.1.3. Bus Lane Enforcement and Section Enforcement
- 5.1.4. Incident Detection and Response
- 5.2. Market Analysis, Insights and Forecast - by Services
- 5.2.1. Consulting
- 5.2.2. Support and Maintenance
- 5.2.3. Integration and Deployment
- 5.3. Market Analysis, Insights and Forecast - by Region
- 5.3.1. North America
- 5.3.2. Europe
- 5.3.3. Asia Pacific
- 5.3.4. Latin America
- 5.3.5. Middle East and Africa
- 5.1. Market Analysis, Insights and Forecast - by Solution
- 6. North America Road Safety Industry Analysis, Insights and Forecast, 2019-2031
- 6.1. Market Analysis, Insights and Forecast - by Solution
- 6.1.1. Red Light Enforcement
- 6.1.2. Speed Enforcement
- 6.1.3. Bus Lane Enforcement and Section Enforcement
- 6.1.4. Incident Detection and Response
- 6.2. Market Analysis, Insights and Forecast - by Services
- 6.2.1. Consulting
- 6.2.2. Support and Maintenance
- 6.2.3. Integration and Deployment
- 6.1. Market Analysis, Insights and Forecast - by Solution
- 7. Europe Road Safety Industry Analysis, Insights and Forecast, 2019-2031
- 7.1. Market Analysis, Insights and Forecast - by Solution
- 7.1.1. Red Light Enforcement
- 7.1.2. Speed Enforcement
- 7.1.3. Bus Lane Enforcement and Section Enforcement
- 7.1.4. Incident Detection and Response
- 7.2. Market Analysis, Insights and Forecast - by Services
- 7.2.1. Consulting
- 7.2.2. Support and Maintenance
- 7.2.3. Integration and Deployment
- 7.1. Market Analysis, Insights and Forecast - by Solution
- 8. Asia Pacific Road Safety Industry Analysis, Insights and Forecast, 2019-2031
- 8.1. Market Analysis, Insights and Forecast - by Solution
- 8.1.1. Red Light Enforcement
- 8.1.2. Speed Enforcement
- 8.1.3. Bus Lane Enforcement and Section Enforcement
- 8.1.4. Incident Detection and Response
- 8.2. Market Analysis, Insights and Forecast - by Services
- 8.2.1. Consulting
- 8.2.2. Support and Maintenance
- 8.2.3. Integration and Deployment
- 8.1. Market Analysis, Insights and Forecast - by Solution
- 9. Latin America Road Safety Industry Analysis, Insights and Forecast, 2019-2031
- 9.1. Market Analysis, Insights and Forecast - by Solution
- 9.1.1. Red Light Enforcement
- 9.1.2. Speed Enforcement
- 9.1.3. Bus Lane Enforcement and Section Enforcement
- 9.1.4. Incident Detection and Response
- 9.2. Market Analysis, Insights and Forecast - by Services
- 9.2.1. Consulting
- 9.2.2. Support and Maintenance
- 9.2.3. Integration and Deployment
- 9.1. Market Analysis, Insights and Forecast - by Solution
- 10. Middle East and Africa Road Safety Industry Analysis, Insights and Forecast, 2019-2031
- 10.1. Market Analysis, Insights and Forecast - by Solution
- 10.1.1. Red Light Enforcement
- 10.1.2. Speed Enforcement
- 10.1.3. Bus Lane Enforcement and Section Enforcement
- 10.1.4. Incident Detection and Response
- 10.2. Market Analysis, Insights and Forecast - by Services
- 10.2.1. Consulting
- 10.2.2. Support and Maintenance
- 10.2.3. Integration and Deployment
- 10.1. Market Analysis, Insights and Forecast - by Solution
- 11. North America Road Safety Industry Analysis, Insights and Forecast, 2019-2031
- 11.1. Market Analysis, Insights and Forecast - By Country/Sub-region
- 11.1.1 United States
- 11.1.2 Canada
- 12. Europe Road Safety Industry Analysis, Insights and Forecast, 2019-2031
- 12.1. Market Analysis, Insights and Forecast - By Country/Sub-region
- 12.1.1 United Kingdom
- 12.1.2 France
- 12.1.3 Germany
- 12.1.4 Rest of Europe
- 13. Asia Pacific Road Safety Industry Analysis, Insights and Forecast, 2019-2031
- 13.1. Market Analysis, Insights and Forecast - By Country/Sub-region
- 13.1.1 China
- 13.1.2 India
- 13.1.3 Japan
- 13.1.4 Rest of Asia Pacific
- 14. Latin America Road Safety Industry Analysis, Insights and Forecast, 2019-2031
- 14.1. Market Analysis, Insights and Forecast - By Country/Sub-region
- 14.1.1.
- 15. Middle East and Africa Road Safety Industry Analysis, Insights and Forecast, 2019-2031
- 15.1. Market Analysis, Insights and Forecast - By Country/Sub-region
- 15.1.1.
- 16. Competitive Analysis
- 16.1. Global Market Share Analysis 2024
- 16.2. Company Profiles
- 16.2.1 eTrans Solutions Pvt Ltd
- 16.2.1.1. Overview
- 16.2.1.2. Products
- 16.2.1.3. SWOT Analysis
- 16.2.1.4. Recent Developments
- 16.2.1.5. Financials (Based on Availability)
- 16.2.2 Information Engineering Group Inc
- 16.2.2.1. Overview
- 16.2.2.2. Products
- 16.2.2.3. SWOT Analysis
- 16.2.2.4. Recent Developments
- 16.2.2.5. Financials (Based on Availability)
- 16.2.3 Kapsch TrafficCom AG
- 16.2.3.1. Overview
- 16.2.3.2. Products
- 16.2.3.3. SWOT Analysis
- 16.2.3.4. Recent Developments
- 16.2.3.5. Financials (Based on Availability)
- 16.2.4 Swarco AG
- 16.2.4.1. Overview
- 16.2.4.2. Products
- 16.2.4.3. SWOT Analysis
- 16.2.4.4. Recent Developments
- 16.2.4.5. Financials (Based on Availability)
- 16.2.5 Sensys Gatso Group AB
- 16.2.5.1. Overview
- 16.2.5.2. Products
- 16.2.5.3. SWOT Analysis
- 16.2.5.4. Recent Developments
- 16.2.5.5. Financials (Based on Availability)
- 16.2.6 Motorola
- 16.2.6.1. Overview
- 16.2.6.2. Products
- 16.2.6.3. SWOT Analysis
- 16.2.6.4. Recent Developments
- 16.2.6.5. Financials (Based on Availability)
- 16.2.7 Jenoptik AG
- 16.2.7.1. Overview
- 16.2.7.2. Products
- 16.2.7.3. SWOT Analysis
- 16.2.7.4. Recent Developments
- 16.2.7.5. Financials (Based on Availability)
- 16.2.8 VITRONIC
- 16.2.8.1. Overview
- 16.2.8.2. Products
- 16.2.8.3. SWOT Analysis
- 16.2.8.4. Recent Developments
- 16.2.8.5. Financials (Based on Availability)
- 16.2.9 Redflex Holdings Limited
- 16.2.9.1. Overview
- 16.2.9.2. Products
- 16.2.9.3. SWOT Analysis
- 16.2.9.4. Recent Developments
- 16.2.9.5. Financials (Based on Availability)
- 16.2.10 Conduent Business Services LLC
- 16.2.10.1. Overview
- 16.2.10.2. Products
- 16.2.10.3. SWOT Analysis
- 16.2.10.4. Recent Developments
- 16.2.10.5. Financials (Based on Availability)
- 16.2.11 FRED Engineering
- 16.2.11.1. Overview
- 16.2.11.2. Products
- 16.2.11.3. SWOT Analysis
- 16.2.11.4. Recent Developments
- 16.2.11.5. Financials (Based on Availability)
- 16.2.12 Clearview Intelligence Limited*List Not Exhaustive
- 16.2.12.1. Overview
- 16.2.12.2. Products
- 16.2.12.3. SWOT Analysis
- 16.2.12.4. Recent Developments
- 16.2.12.5. Financials (Based on Availability)
- 16.2.13 FLIR Systems Inc
- 16.2.13.1. Overview
- 16.2.13.2. Products
- 16.2.13.3. SWOT Analysis
- 16.2.13.4. Recent Developments
- 16.2.13.5. Financials (Based on Availability)
- 16.2.14 Connected Wise LLC
- 16.2.14.1. Overview
- 16.2.14.2. Products
- 16.2.14.3. SWOT Analysis
- 16.2.14.4. Recent Developments
- 16.2.14.5. Financials (Based on Availability)
- 16.2.1 eTrans Solutions Pvt Ltd
List of Figures
- Figure 1: Global Road Safety Industry Revenue Breakdown (Million, %) by Region 2024 & 2032
- Figure 2: North America Road Safety Industry Revenue (Million), by Country 2024 & 2032
- Figure 3: North America Road Safety Industry Revenue Share (%), by Country 2024 & 2032
- Figure 4: Europe Road Safety Industry Revenue (Million), by Country 2024 & 2032
- Figure 5: Europe Road Safety Industry Revenue Share (%), by Country 2024 & 2032
- Figure 6: Asia Pacific Road Safety Industry Revenue (Million), by Country 2024 & 2032
- Figure 7: Asia Pacific Road Safety Industry Revenue Share (%), by Country 2024 & 2032
- Figure 8: Latin America Road Safety Industry Revenue (Million), by Country 2024 & 2032
- Figure 9: Latin America Road Safety Industry Revenue Share (%), by Country 2024 & 2032
- Figure 10: Middle East and Africa Road Safety Industry Revenue (Million), by Country 2024 & 2032
- Figure 11: Middle East and Africa Road Safety Industry Revenue Share (%), by Country 2024 & 2032
- Figure 12: North America Road Safety Industry Revenue (Million), by Solution 2024 & 2032
- Figure 13: North America Road Safety Industry Revenue Share (%), by Solution 2024 & 2032
- Figure 14: North America Road Safety Industry Revenue (Million), by Services 2024 & 2032
- Figure 15: North America Road Safety Industry Revenue Share (%), by Services 2024 & 2032
- Figure 16: North America Road Safety Industry Revenue (Million), by Country 2024 & 2032
- Figure 17: North America Road Safety Industry Revenue Share (%), by Country 2024 & 2032
- Figure 18: Europe Road Safety Industry Revenue (Million), by Solution 2024 & 2032
- Figure 19: Europe Road Safety Industry Revenue Share (%), by Solution 2024 & 2032
- Figure 20: Europe Road Safety Industry Revenue (Million), by Services 2024 & 2032
- Figure 21: Europe Road Safety Industry Revenue Share (%), by Services 2024 & 2032
- Figure 22: Europe Road Safety Industry Revenue (Million), by Country 2024 & 2032
- Figure 23: Europe Road Safety Industry Revenue Share (%), by Country 2024 & 2032
- Figure 24: Asia Pacific Road Safety Industry Revenue (Million), by Solution 2024 & 2032
- Figure 25: Asia Pacific Road Safety Industry Revenue Share (%), by Solution 2024 & 2032
- Figure 26: Asia Pacific Road Safety Industry Revenue (Million), by Services 2024 & 2032
- Figure 27: Asia Pacific Road Safety Industry Revenue Share (%), by Services 2024 & 2032
- Figure 28: Asia Pacific Road Safety Industry Revenue (Million), by Country 2024 & 2032
- Figure 29: Asia Pacific Road Safety Industry Revenue Share (%), by Country 2024 & 2032
- Figure 30: Latin America Road Safety Industry Revenue (Million), by Solution 2024 & 2032
- Figure 31: Latin America Road Safety Industry Revenue Share (%), by Solution 2024 & 2032
- Figure 32: Latin America Road Safety Industry Revenue (Million), by Services 2024 & 2032
- Figure 33: Latin America Road Safety Industry Revenue Share (%), by Services 2024 & 2032
- Figure 34: Latin America Road Safety Industry Revenue (Million), by Country 2024 & 2032
- Figure 35: Latin America Road Safety Industry Revenue Share (%), by Country 2024 & 2032
- Figure 36: Middle East and Africa Road Safety Industry Revenue (Million), by Solution 2024 & 2032
- Figure 37: Middle East and Africa Road Safety Industry Revenue Share (%), by Solution 2024 & 2032
- Figure 38: Middle East and Africa Road Safety Industry Revenue (Million), by Services 2024 & 2032
- Figure 39: Middle East and Africa Road Safety Industry Revenue Share (%), by Services 2024 & 2032
- Figure 40: Middle East and Africa Road Safety Industry Revenue (Million), by Country 2024 & 2032
- Figure 41: Middle East and Africa Road Safety Industry Revenue Share (%), by Country 2024 & 2032
List of Tables
- Table 1: Global Road Safety Industry Revenue Million Forecast, by Region 2019 & 2032
- Table 2: Global Road Safety Industry Revenue Million Forecast, by Solution 2019 & 2032
- Table 3: Global Road Safety Industry Revenue Million Forecast, by Services 2019 & 2032
- Table 4: Global Road Safety Industry Revenue Million Forecast, by Region 2019 & 2032
- Table 5: Global Road Safety Industry Revenue Million Forecast, by Country 2019 & 2032
- Table 6: United States Road Safety Industry Revenue (Million) Forecast, by Application 2019 & 2032
- Table 7: Canada Road Safety Industry Revenue (Million) Forecast, by Application 2019 & 2032
- Table 8: Global Road Safety Industry Revenue Million Forecast, by Country 2019 & 2032
- Table 9: United Kingdom Road Safety Industry Revenue (Million) Forecast, by Application 2019 & 2032
- Table 10: France Road Safety Industry Revenue (Million) Forecast, by Application 2019 & 2032
- Table 11: Germany Road Safety Industry Revenue (Million) Forecast, by Application 2019 & 2032
- Table 12: Rest of Europe Road Safety Industry Revenue (Million) Forecast, by Application 2019 & 2032
- Table 13: Global Road Safety Industry Revenue Million Forecast, by Country 2019 & 2032
- Table 14: China Road Safety Industry Revenue (Million) Forecast, by Application 2019 & 2032
- Table 15: India Road Safety Industry Revenue (Million) Forecast, by Application 2019 & 2032
- Table 16: Japan Road Safety Industry Revenue (Million) Forecast, by Application 2019 & 2032
- Table 17: Rest of Asia Pacific Road Safety Industry Revenue (Million) Forecast, by Application 2019 & 2032
- Table 18: Global Road Safety Industry Revenue Million Forecast, by Country 2019 & 2032
- Table 19: Road Safety Industry Revenue (Million) Forecast, by Application 2019 & 2032
- Table 20: Global Road Safety Industry Revenue Million Forecast, by Country 2019 & 2032
- Table 21: Road Safety Industry Revenue (Million) Forecast, by Application 2019 & 2032
- Table 22: Global Road Safety Industry Revenue Million Forecast, by Solution 2019 & 2032
- Table 23: Global Road Safety Industry Revenue Million Forecast, by Services 2019 & 2032
- Table 24: Global Road Safety Industry Revenue Million Forecast, by Country 2019 & 2032
- Table 25: United States Road Safety Industry Revenue (Million) Forecast, by Application 2019 & 2032
- Table 26: Canada Road Safety Industry Revenue (Million) Forecast, by Application 2019 & 2032
- Table 27: Global Road Safety Industry Revenue Million Forecast, by Solution 2019 & 2032
- Table 28: Global Road Safety Industry Revenue Million Forecast, by Services 2019 & 2032
- Table 29: Global Road Safety Industry Revenue Million Forecast, by Country 2019 & 2032
- Table 30: United Kingdom Road Safety Industry Revenue (Million) Forecast, by Application 2019 & 2032
- Table 31: France Road Safety Industry Revenue (Million) Forecast, by Application 2019 & 2032
- Table 32: Germany Road Safety Industry Revenue (Million) Forecast, by Application 2019 & 2032
- Table 33: Rest of Europe Road Safety Industry Revenue (Million) Forecast, by Application 2019 & 2032
- Table 34: Global Road Safety Industry Revenue Million Forecast, by Solution 2019 & 2032
- Table 35: Global Road Safety Industry Revenue Million Forecast, by Services 2019 & 2032
- Table 36: Global Road Safety Industry Revenue Million Forecast, by Country 2019 & 2032
- Table 37: China Road Safety Industry Revenue (Million) Forecast, by Application 2019 & 2032
- Table 38: India Road Safety Industry Revenue (Million) Forecast, by Application 2019 & 2032
- Table 39: Japan Road Safety Industry Revenue (Million) Forecast, by Application 2019 & 2032
- Table 40: Rest of Asia Pacific Road Safety Industry Revenue (Million) Forecast, by Application 2019 & 2032
- Table 41: Global Road Safety Industry Revenue Million Forecast, by Solution 2019 & 2032
- Table 42: Global Road Safety Industry Revenue Million Forecast, by Services 2019 & 2032
- Table 43: Global Road Safety Industry Revenue Million Forecast, by Country 2019 & 2032
- Table 44: Global Road Safety Industry Revenue Million Forecast, by Solution 2019 & 2032
- Table 45: Global Road Safety Industry Revenue Million Forecast, by Services 2019 & 2032
- Table 46: Global Road Safety Industry Revenue Million Forecast, by Country 2019 & 2032
Frequently Asked Questions
1. What is the projected Compound Annual Growth Rate (CAGR) of the Road Safety Industry?
The projected CAGR is approximately 7.60%.
2. Which companies are prominent players in the Road Safety Industry?
Key companies in the market include eTrans Solutions Pvt Ltd, Information Engineering Group Inc, Kapsch TrafficCom AG, Swarco AG, Sensys Gatso Group AB, Motorola, Jenoptik AG, VITRONIC, Redflex Holdings Limited, Conduent Business Services LLC, FRED Engineering, Clearview Intelligence Limited*List Not Exhaustive, FLIR Systems Inc, Connected Wise LLC.
3. What are the main segments of the Road Safety Industry?
The market segments include Solution, Services.
4. Can you provide details about the market size?
The market size is estimated to be USD XX Million as of 2022.
5. What are some drivers contributing to market growth?
Increasing Number of Road Accidents and Fatalities; Increasing Need for Public Security and Improvement; Government Initiatives to Enhance Road Safety.
6. What are the notable trends driving market growth?
The surge in the Number of Road Accidents and Fatalities Gain Momentum in the Market..
7. Are there any restraints impacting market growth?
High Capital Investment due to Implementation of New Technologies; Risk and Congestion Associated with Trade Routes.
8. Can you provide examples of recent developments in the market?
March 2022 - The world's smartest traffic management system debuts in Melbourne, equipped with cutting-edge technology to minimize traffic congestion and increase road safety. The Intelligent Corridor, which will run for 2.5 kilometers along Nicholson Street between Alexandra and Victoria Parades, will use sensors, cloud-based AI, machine learning algorithms, predictive models, and real-time data capture to improve traffic management, ease congestion, improve road safety for cars, pedestrians, and cyclists, and to lower emissions from congested traffic.
9. What pricing options are available for accessing the report?
Pricing options include single-user, multi-user, and enterprise licenses priced at USD 4750, USD 5250, and USD 8750 respectively.
10. Is the market size provided in terms of value or volume?
The market size is provided in terms of value, measured in Million.
11. Are there any specific market keywords associated with the report?
Yes, the market keyword associated with the report is "Road Safety Industry," which aids in identifying and referencing the specific market segment covered.
12. How do I determine which pricing option suits my needs best?
The pricing options vary based on user requirements and access needs. Individual users may opt for single-user licenses, while businesses requiring broader access may choose multi-user or enterprise licenses for cost-effective access to the report.
13. Are there any additional resources or data provided in the Road Safety Industry report?
While the report offers comprehensive insights, it's advisable to review the specific contents or supplementary materials provided to ascertain if additional resources or data are available.
14. How can I stay updated on further developments or reports in the Road Safety Industry?
To stay informed about further developments, trends, and reports in the Road Safety Industry, consider subscribing to industry newsletters, following relevant companies and organizations, or regularly checking reputable industry news sources and publications.
Methodology
Step 1 - Identification of Relevant Samples Size from Population Database


Step 2 - Approaches for Defining Global Market Size (Value, Volume* & Price*)

Note*: In applicable scenarios
Step 3 - Data Sources
Primary Research
- Web Analytics
- Survey Reports
- Research Institute
- Latest Research Reports
- Opinion Leaders
Secondary Research
- Annual Reports
- White Paper
- Latest Press Release
- Industry Association
- Paid Database
- Investor Presentations

Step 4 - Data Triangulation
Involves using different sources of information in order to increase the validity of a study
These sources are likely to be stakeholders in a program - participants, other researchers, program staff, other community members, and so on.
Then we put all data in single framework & apply various statistical tools to find out the dynamic on the market.
During the analysis stage, feedback from the stakeholder groups would be compared to determine areas of agreement as well as areas of divergence
