

Key Insights
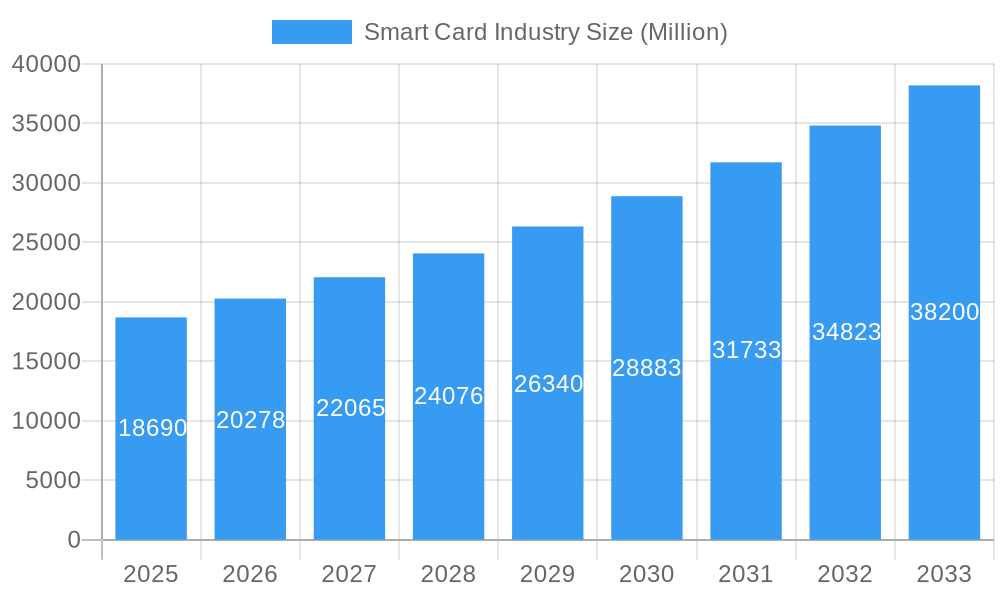
The global smart card market, valued at $18.69 billion in 2025, is projected to experience robust growth, exhibiting a compound annual growth rate (CAGR) of 8.59% from 2025 to 2033. This expansion is driven by several key factors. Firstly, the increasing adoption of contactless payment technologies fueled by the convenience and security they offer is significantly boosting demand. The rise of digital wallets and mobile payment systems further accelerates this trend. Secondly, the growing need for secure identification and authentication across various sectors, including banking, finance, services (BFSI), IT, telecommunications, and government, is a major driver. Governments worldwide are increasingly implementing smart card-based national identification programs and electronic voting systems, while the private sector leverages them for access control and employee identification. Furthermore, the expansion of the internet of things (IoT) and the increasing use of smart cards in various IoT applications, such as transportation ticketing and healthcare management systems, contributes significantly to market growth.
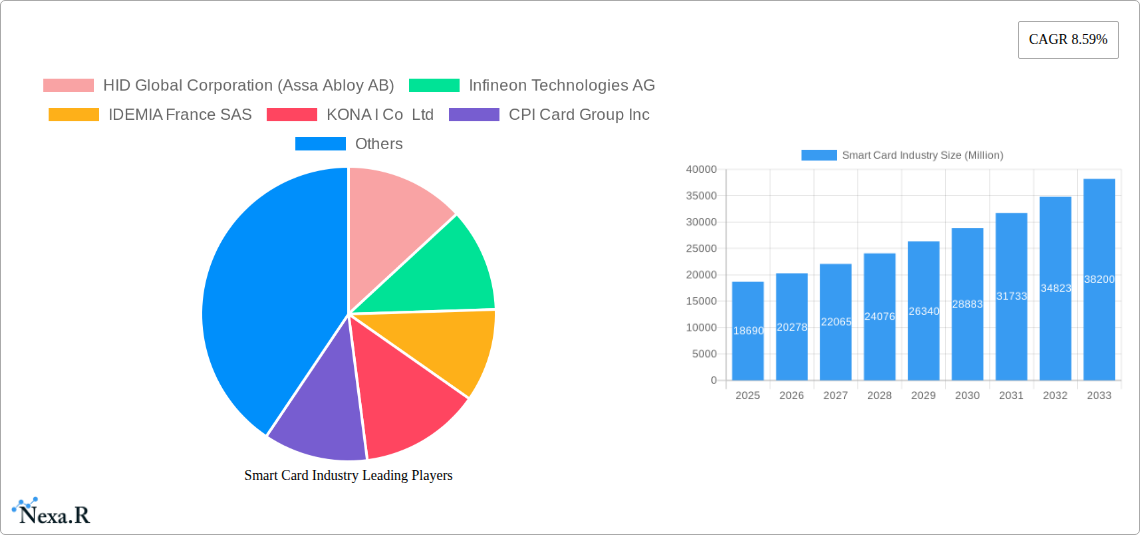
Smart Card Industry Market Size (In Billion)
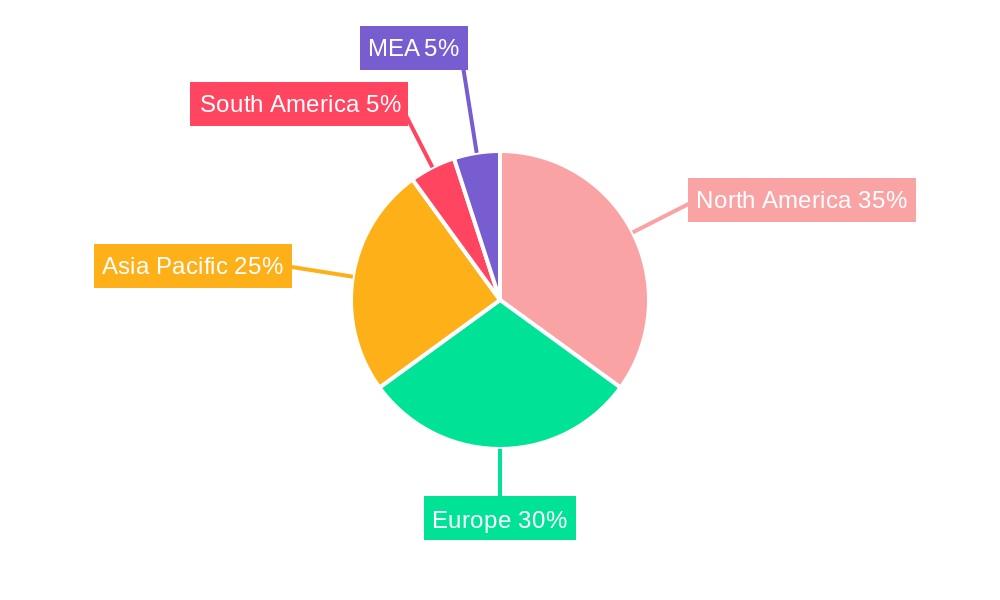
Market segmentation reveals a significant share for contactless smart cards, reflecting the prevailing consumer preference for touchless transactions. Among end-user verticals, the BFSI sector dominates due to the widespread use of smart cards in credit/debit cards, ATM cards, and other financial transactions. However, substantial growth is anticipated in the IT and telecommunications sectors, driven by the adoption of SIM cards and other secure identification technologies. Geographical analysis indicates strong growth in regions like Asia-Pacific, propelled by rapid economic expansion and rising disposable incomes in developing economies such as India and China. North America and Europe, while maintaining significant market shares, are expected to witness a more moderate growth rate. While competitive pressures from numerous established players exist, the continuous innovation in smart card technology, encompassing improved security features and enhanced functionalities, will ensure sustained market expansion throughout the forecast period.
Smart Card Industry Company Market Share
Smart Card Industry Market Report: 2019-2033
This comprehensive report provides a detailed analysis of the global smart card market, encompassing market dynamics, growth trends, regional dominance, product landscape, key players, and future outlook. With a study period spanning 2019-2033, a base year of 2025, and a forecast period of 2025-2033, this report offers invaluable insights for industry professionals, investors, and strategists. The market is segmented by type (contact-based, contactless) and end-user vertical (BFSI, IT & Telecommunication, Government, Transportation, Other End-User Industries). The report projects xx million units in total market value by 2033.
Smart Card Industry Market Dynamics & Structure
The smart card market is characterized by moderate concentration, with key players holding significant market share, yet experiencing dynamic competition. Technological innovation, driven by advancements in contactless technology, biometrics, and secure element integration, fuels market expansion. Stringent regulatory frameworks, particularly concerning data security and privacy, influence market practices. Competitive substitutes, such as mobile payments and digital wallets, pose a challenge, but the robust security and offline functionality of smart cards maintain their relevance. End-user demographics, with a growing preference for contactless and secure payment methods, significantly impact market growth. M&A activity in the sector reflects consolidation efforts and expansion into new technologies.
- Market Concentration: Moderately concentrated, with top 5 players holding approximately xx% market share in 2024.
- Technological Innovation: Focus on NFC, biometrics, and embedded security chips.
- Regulatory Frameworks: Emphasis on data protection and compliance (e.g., GDPR, PCI DSS).
- Competitive Substitutes: Mobile payments, digital wallets, and near-field communication (NFC) technology.
- End-User Demographics: Shift towards contactless transactions and digital identities.
- M&A Trends: Consolidation among key players to expand product portfolios and geographical reach; xx major M&A deals recorded between 2019-2024.
Smart Card Industry Growth Trends & Insights
The smart card market exhibits robust growth, driven by the increasing adoption of contactless payment solutions, government initiatives promoting digital identity, and expansion into diverse applications. The market size experienced significant growth from xx million units in 2019 to xx million units in 2024, registering a CAGR of xx%. This growth trajectory is projected to continue, with an anticipated CAGR of xx% during the forecast period (2025-2033), reaching xx million units by 2033. Technological disruptions, such as the integration of advanced security features and biometric authentication, are key catalysts. Shifting consumer behavior, marked by a preference for convenience and security, further fuels market expansion. Market penetration is also steadily increasing across various sectors.
Dominant Regions, Countries, or Segments in Smart Card Industry
North America and Europe currently dominate the smart card market, driven by robust adoption in BFSI and government sectors. However, Asia-Pacific is projected to experience the fastest growth, fueled by increasing smartphone penetration, expanding digital infrastructure, and government initiatives promoting digital payments. Contactless smart cards are witnessing significantly higher growth than contact-based cards due to convenience and hygiene concerns. The BFSI segment remains the largest end-user vertical, driven by the widespread adoption of debit and credit cards. However, the government and transportation sectors are witnessing significant growth due to initiatives related to digital identity and national mobility programs.
- Key Drivers:
- North America & Europe: Established digital infrastructure, high adoption rates in BFSI and government.
- Asia-Pacific: Rapid smartphone penetration, increasing digitalization, government support for digital payments.
- Dominant Segments:
- By Type: Contactless cards exhibit faster growth due to convenience and hygiene.
- By End-user Vertical: BFSI remains largest, but government & transportation are high-growth segments.
Smart Card Industry Product Landscape
Smart card technology continues to evolve, integrating advanced features such as enhanced security protocols (e.g., EMVCo standards), biometric authentication, and near-field communication (NFC) capabilities. These innovations enhance data security, improve user experience, and enable a wider range of applications. Unique selling propositions often center on superior security features, customized personalization options, and seamless integration with existing payment systems. The industry focuses on developing solutions that address diverse user needs and cater to specific industry requirements, such as specialized smart cards for healthcare, transportation, and access control.
Key Drivers, Barriers & Challenges in Smart Card Industry
Key Drivers: The rising adoption of digital payment methods, the increasing need for secure digital identity solutions, and government initiatives promoting cashless transactions are major drivers. The integration of advanced technologies like biometric authentication and NFC further accelerates market growth.
Key Challenges: Supply chain disruptions, especially concerning semiconductor availability, pose a significant challenge. Stringent regulatory compliance requirements increase operational costs. Intense competition and the emergence of alternative technologies such as mobile payments create pricing pressures and impact market share. Estimated impact of supply chain issues on market growth in 2024: xx%.
Emerging Opportunities in Smart Card Industry
Untapped markets in developing economies, coupled with the growing adoption of digital services in healthcare, education, and entertainment, presents significant opportunities. Innovative applications, such as loyalty programs integrated with smart cards and the integration of smart card technology with Internet of Things (IoT) devices, offer further growth potential. Evolving consumer preferences towards convenience and enhanced security drive demand for more sophisticated smart card solutions.
Growth Accelerators in the Smart Card Industry
Technological breakthroughs, particularly in secure element technology, biometric authentication, and NFC capabilities, continue to fuel market expansion. Strategic partnerships between smart card manufacturers and technology providers accelerate innovation and market penetration. Expanding into new geographical markets and identifying innovative applications in diverse sectors, such as healthcare and IoT, provide significant growth avenues.
Key Players Shaping the Smart Card Industry Market
- HID Global Corporation (Assa Abloy AB)
- Infineon Technologies AG
- IDEMIA France SAS
- KONA I Co Ltd
- CPI Card Group Inc
- Samsung Electronics Co Ltd
- Gemalto NV (Thales Group)
- Watchdata Technologies
- Secura Key
- Fingerprint Cards AB
- Alioth LLC
- CardLogix Corporation
- Giesecke & Devrient GmbH (MC Familiengesellschaft mbH)
- Bundesdruckerei GmbH
- IntelCav
Notable Milestones in Smart Card Industry Sector
- April 2023: Launch of GoSmart National Common Mobility Card (NCMC) in Kanpur, India, expanding interoperable transportation and retail services nationwide.
- January 2023: dzcard inaugurates a new innovation center in Bangkok, Thailand, focusing on next-generation sustainable smart card technologies.
In-Depth Smart Card Industry Market Outlook
The smart card market is poised for sustained growth, driven by technological advancements, increasing digitalization, and expansion into new applications. Strategic partnerships, market diversification, and the development of innovative solutions will shape future market dynamics. The focus on enhanced security, improved user experience, and the integration with emerging technologies like IoT presents significant opportunities for market expansion and the creation of new revenue streams in the years to come. The market is expected to experience a significant increase in adoption rate across diverse verticals, thus increasing its potential considerably.
Smart Card Industry Segmentation
-
1. Type
- 1.1. Contact-based
- 1.2. Contact-Less
-
2. End-user Vertical
- 2.1. BFSI
- 2.2. IT & Telecommunication
- 2.3. Government
- 2.4. Transportation
- 2.5. Other
Smart Card Industry Segmentation By Geography
-
1. North America
- 1.1. United States
- 1.2. Canada
-
2. Europe
- 2.1. United Kingdom
- 2.2. Germany
- 2.3. France
- 2.4. Rest of Europe
-
3. Asia Pacific
- 3.1. China
- 3.2. Japan
- 3.3. India
- 3.4. Rest of Asia Pacific
- 4. Rest of the World
Smart Card Industry Regional Market Share
Geographic Coverage of Smart Card Industry
Smart Card Industry REPORT HIGHLIGHTS
| Aspects | Details |
|---|---|
| Study Period | 2020-2034 |
| Base Year | 2025 |
| Estimated Year | 2026 |
| Forecast Period | 2026-2034 |
| Historical Period | 2020-2025 |
| Growth Rate | CAGR of 8.59% from 2020-2034 |
| Segmentation |
|
Table of Contents
- 1. Introduction
- 1.1. Research Scope
- 1.2. Market Segmentation
- 1.3. Research Objective
- 1.4. Definitions and Assumptions
- 2. Executive Summary
- 2.1. Market Snapshot
- 3. Market Dynamics
- 3.1. Market Drivers
- 3.2. Market Restrains
- 3.3. Market Trends
- 3.4. Market Opportunities
- 4. Market Factor Analysis
- 4.1. Porters Five Forces
- 4.1.1. Bargaining Power of Suppliers
- 4.1.2. Bargaining Power of Buyers
- 4.1.3. Threat of New Entrants
- 4.1.4. Threat of Substitutes
- 4.1.5. Competitive Rivalry
- 4.2. PESTEL analysis
- 4.3. BCG Analysis
- 4.3.1. Stars (High Growth, High Market Share)
- 4.3.2. Cash Cows (Low Growth, High Market Share)
- 4.3.3. Question Mark (High Growth, Low Market Share)
- 4.3.4. Dogs (Low Growth, Low Market Share)
- 4.4. Ansoff Matrix Analysis
- 4.5. Supply Chain Analysis
- 4.6. Regulatory Landscape
- 4.7. Current Market Potential and Opportunity Assessment (TAM–SAM–SOM Framework)
- 4.8. NRP Analyst Note
- 4.1. Porters Five Forces
- 5. Market Analysis, Insights and Forecast 2021-2033
- 5.1. Market Analysis, Insights and Forecast - by Type
- 5.1.1. Contact-based
- 5.1.2. Contact-Less
- 5.2. Market Analysis, Insights and Forecast - by End-user Vertical
- 5.2.1. BFSI
- 5.2.2. IT & Telecommunication
- 5.2.3. Government
- 5.2.4. Transportation
- 5.2.5. Other
- 5.3. Market Analysis, Insights and Forecast - by Region
- 5.3.1. North America
- 5.3.2. Europe
- 5.3.3. Asia Pacific
- 5.3.4. Rest of the World
- 5.1. Market Analysis, Insights and Forecast - by Type
- 6. Global Smart Card Industry Analysis, Insights and Forecast, 2021-2033
- 6.1. Market Analysis, Insights and Forecast - by Type
- 6.1.1. Contact-based
- 6.1.2. Contact-Less
- 6.2. Market Analysis, Insights and Forecast - by End-user Vertical
- 6.2.1. BFSI
- 6.2.2. IT & Telecommunication
- 6.2.3. Government
- 6.2.4. Transportation
- 6.2.5. Other
- 6.1. Market Analysis, Insights and Forecast - by Type
- 7. North America Smart Card Industry Analysis, Insights and Forecast, 2020-2032
- 7.1. Market Analysis, Insights and Forecast - by Type
- 7.1.1. Contact-based
- 7.1.2. Contact-Less
- 7.2. Market Analysis, Insights and Forecast - by End-user Vertical
- 7.2.1. BFSI
- 7.2.2. IT & Telecommunication
- 7.2.3. Government
- 7.2.4. Transportation
- 7.2.5. Other
- 7.1. Market Analysis, Insights and Forecast - by Type
- 8. Europe Smart Card Industry Analysis, Insights and Forecast, 2020-2032
- 8.1. Market Analysis, Insights and Forecast - by Type
- 8.1.1. Contact-based
- 8.1.2. Contact-Less
- 8.2. Market Analysis, Insights and Forecast - by End-user Vertical
- 8.2.1. BFSI
- 8.2.2. IT & Telecommunication
- 8.2.3. Government
- 8.2.4. Transportation
- 8.2.5. Other
- 8.1. Market Analysis, Insights and Forecast - by Type
- 9. Asia Pacific Smart Card Industry Analysis, Insights and Forecast, 2020-2032
- 9.1. Market Analysis, Insights and Forecast - by Type
- 9.1.1. Contact-based
- 9.1.2. Contact-Less
- 9.2. Market Analysis, Insights and Forecast - by End-user Vertical
- 9.2.1. BFSI
- 9.2.2. IT & Telecommunication
- 9.2.3. Government
- 9.2.4. Transportation
- 9.2.5. Other
- 9.1. Market Analysis, Insights and Forecast - by Type
- 10. Rest of the World Smart Card Industry Analysis, Insights and Forecast, 2020-2032
- 10.1. Market Analysis, Insights and Forecast - by Type
- 10.1.1. Contact-based
- 10.1.2. Contact-Less
- 10.2. Market Analysis, Insights and Forecast - by End-user Vertical
- 10.2.1. BFSI
- 10.2.2. IT & Telecommunication
- 10.2.3. Government
- 10.2.4. Transportation
- 10.2.5. Other
- 10.1. Market Analysis, Insights and Forecast - by Type
- 11. Competitive Analysis
- 11.1. Company Profiles
- 11.1.1 HID Global Corporation (Assa Abloy AB)
- 11.1.1.1. Company Overview
- 11.1.1.2. Products
- 11.1.1.3. Company Financials
- 11.1.1.4. SWOT Analysis
- 11.1.2 Infineon Technologies AG
- 11.1.2.1. Company Overview
- 11.1.2.2. Products
- 11.1.2.3. Company Financials
- 11.1.2.4. SWOT Analysis
- 11.1.3 IDEMIA France SAS
- 11.1.3.1. Company Overview
- 11.1.3.2. Products
- 11.1.3.3. Company Financials
- 11.1.3.4. SWOT Analysis
- 11.1.4 KONA I Co Ltd
- 11.1.4.1. Company Overview
- 11.1.4.2. Products
- 11.1.4.3. Company Financials
- 11.1.4.4. SWOT Analysis
- 11.1.5 CPI Card Group Inc
- 11.1.5.1. Company Overview
- 11.1.5.2. Products
- 11.1.5.3. Company Financials
- 11.1.5.4. SWOT Analysis
- 11.1.6 Samsung Electronics Co Ltd
- 11.1.6.1. Company Overview
- 11.1.6.2. Products
- 11.1.6.3. Company Financials
- 11.1.6.4. SWOT Analysis
- 11.1.7 Gemalto NV (Thales Group)
- 11.1.7.1. Company Overview
- 11.1.7.2. Products
- 11.1.7.3. Company Financials
- 11.1.7.4. SWOT Analysis
- 11.1.8 Watchdata Technologies
- 11.1.8.1. Company Overview
- 11.1.8.2. Products
- 11.1.8.3. Company Financials
- 11.1.8.4. SWOT Analysis
- 11.1.9 Secura Key
- 11.1.9.1. Company Overview
- 11.1.9.2. Products
- 11.1.9.3. Company Financials
- 11.1.9.4. SWOT Analysis
- 11.1.10 Fingerprint Cards AB
- 11.1.10.1. Company Overview
- 11.1.10.2. Products
- 11.1.10.3. Company Financials
- 11.1.10.4. SWOT Analysis
- 11.1.11 Alioth LLC
- 11.1.11.1. Company Overview
- 11.1.11.2. Products
- 11.1.11.3. Company Financials
- 11.1.11.4. SWOT Analysis
- 11.1.12 CardLogix Corporation
- 11.1.12.1. Company Overview
- 11.1.12.2. Products
- 11.1.12.3. Company Financials
- 11.1.12.4. SWOT Analysis
- 11.1.13 Giesecke & Devrient GmbH (MC Familiengesellschaft mbH)
- 11.1.13.1. Company Overview
- 11.1.13.2. Products
- 11.1.13.3. Company Financials
- 11.1.13.4. SWOT Analysis
- 11.1.14 Bundesdruckerei GmbH
- 11.1.14.1. Company Overview
- 11.1.14.2. Products
- 11.1.14.3. Company Financials
- 11.1.14.4. SWOT Analysis
- 11.1.15 IntelCav
- 11.1.15.1. Company Overview
- 11.1.15.2. Products
- 11.1.15.3. Company Financials
- 11.1.15.4. SWOT Analysis
- 11.1.1 HID Global Corporation (Assa Abloy AB)
- 11.2. Market Entropy
- 11.2.1 Company's Key Areas Served
- 11.2.2 Recent Developments
- 11.3. Company Market Share Analysis 2025
- 11.3.1 Top 5 Companies Market Share Analysis
- 11.3.2 Top 3 Companies Market Share Analysis
- 11.4. List of Potential Customers
- 12. Research Methodology
List of Figures
- Figure 1: Global Smart Card Industry Revenue Breakdown (Million, %) by Region 2025 & 2033
- Figure 2: Global Smart Card Industry Volume Breakdown (K Unit, %) by Region 2025 & 2033
- Figure 3: North America Smart Card Industry Revenue (Million), by Type 2025 & 2033
- Figure 4: North America Smart Card Industry Volume (K Unit), by Type 2025 & 2033
- Figure 5: North America Smart Card Industry Revenue Share (%), by Type 2025 & 2033
- Figure 6: North America Smart Card Industry Volume Share (%), by Type 2025 & 2033
- Figure 7: North America Smart Card Industry Revenue (Million), by End-user Vertical 2025 & 2033
- Figure 8: North America Smart Card Industry Volume (K Unit), by End-user Vertical 2025 & 2033
- Figure 9: North America Smart Card Industry Revenue Share (%), by End-user Vertical 2025 & 2033
- Figure 10: North America Smart Card Industry Volume Share (%), by End-user Vertical 2025 & 2033
- Figure 11: North America Smart Card Industry Revenue (Million), by Country 2025 & 2033
- Figure 12: North America Smart Card Industry Volume (K Unit), by Country 2025 & 2033
- Figure 13: North America Smart Card Industry Revenue Share (%), by Country 2025 & 2033
- Figure 14: North America Smart Card Industry Volume Share (%), by Country 2025 & 2033
- Figure 15: Europe Smart Card Industry Revenue (Million), by Type 2025 & 2033
- Figure 16: Europe Smart Card Industry Volume (K Unit), by Type 2025 & 2033
- Figure 17: Europe Smart Card Industry Revenue Share (%), by Type 2025 & 2033
- Figure 18: Europe Smart Card Industry Volume Share (%), by Type 2025 & 2033
- Figure 19: Europe Smart Card Industry Revenue (Million), by End-user Vertical 2025 & 2033
- Figure 20: Europe Smart Card Industry Volume (K Unit), by End-user Vertical 2025 & 2033
- Figure 21: Europe Smart Card Industry Revenue Share (%), by End-user Vertical 2025 & 2033
- Figure 22: Europe Smart Card Industry Volume Share (%), by End-user Vertical 2025 & 2033
- Figure 23: Europe Smart Card Industry Revenue (Million), by Country 2025 & 2033
- Figure 24: Europe Smart Card Industry Volume (K Unit), by Country 2025 & 2033
- Figure 25: Europe Smart Card Industry Revenue Share (%), by Country 2025 & 2033
- Figure 26: Europe Smart Card Industry Volume Share (%), by Country 2025 & 2033
- Figure 27: Asia Pacific Smart Card Industry Revenue (Million), by Type 2025 & 2033
- Figure 28: Asia Pacific Smart Card Industry Volume (K Unit), by Type 2025 & 2033
- Figure 29: Asia Pacific Smart Card Industry Revenue Share (%), by Type 2025 & 2033
- Figure 30: Asia Pacific Smart Card Industry Volume Share (%), by Type 2025 & 2033
- Figure 31: Asia Pacific Smart Card Industry Revenue (Million), by End-user Vertical 2025 & 2033
- Figure 32: Asia Pacific Smart Card Industry Volume (K Unit), by End-user Vertical 2025 & 2033
- Figure 33: Asia Pacific Smart Card Industry Revenue Share (%), by End-user Vertical 2025 & 2033
- Figure 34: Asia Pacific Smart Card Industry Volume Share (%), by End-user Vertical 2025 & 2033
- Figure 35: Asia Pacific Smart Card Industry Revenue (Million), by Country 2025 & 2033
- Figure 36: Asia Pacific Smart Card Industry Volume (K Unit), by Country 2025 & 2033
- Figure 37: Asia Pacific Smart Card Industry Revenue Share (%), by Country 2025 & 2033
- Figure 38: Asia Pacific Smart Card Industry Volume Share (%), by Country 2025 & 2033
- Figure 39: Rest of the World Smart Card Industry Revenue (Million), by Type 2025 & 2033
- Figure 40: Rest of the World Smart Card Industry Volume (K Unit), by Type 2025 & 2033
- Figure 41: Rest of the World Smart Card Industry Revenue Share (%), by Type 2025 & 2033
- Figure 42: Rest of the World Smart Card Industry Volume Share (%), by Type 2025 & 2033
- Figure 43: Rest of the World Smart Card Industry Revenue (Million), by End-user Vertical 2025 & 2033
- Figure 44: Rest of the World Smart Card Industry Volume (K Unit), by End-user Vertical 2025 & 2033
- Figure 45: Rest of the World Smart Card Industry Revenue Share (%), by End-user Vertical 2025 & 2033
- Figure 46: Rest of the World Smart Card Industry Volume Share (%), by End-user Vertical 2025 & 2033
- Figure 47: Rest of the World Smart Card Industry Revenue (Million), by Country 2025 & 2033
- Figure 48: Rest of the World Smart Card Industry Volume (K Unit), by Country 2025 & 2033
- Figure 49: Rest of the World Smart Card Industry Revenue Share (%), by Country 2025 & 2033
- Figure 50: Rest of the World Smart Card Industry Volume Share (%), by Country 2025 & 2033
List of Tables
- Table 1: Global Smart Card Industry Revenue Million Forecast, by Type 2020 & 2033
- Table 2: Global Smart Card Industry Volume K Unit Forecast, by Type 2020 & 2033
- Table 3: Global Smart Card Industry Revenue Million Forecast, by End-user Vertical 2020 & 2033
- Table 4: Global Smart Card Industry Volume K Unit Forecast, by End-user Vertical 2020 & 2033
- Table 5: Global Smart Card Industry Revenue Million Forecast, by Region 2020 & 2033
- Table 6: Global Smart Card Industry Volume K Unit Forecast, by Region 2020 & 2033
- Table 7: Global Smart Card Industry Revenue Million Forecast, by Type 2020 & 2033
- Table 8: Global Smart Card Industry Volume K Unit Forecast, by Type 2020 & 2033
- Table 9: Global Smart Card Industry Revenue Million Forecast, by End-user Vertical 2020 & 2033
- Table 10: Global Smart Card Industry Volume K Unit Forecast, by End-user Vertical 2020 & 2033
- Table 11: Global Smart Card Industry Revenue Million Forecast, by Country 2020 & 2033
- Table 12: Global Smart Card Industry Volume K Unit Forecast, by Country 2020 & 2033
- Table 13: United States Smart Card Industry Revenue (Million) Forecast, by Application 2020 & 2033
- Table 14: United States Smart Card Industry Volume (K Unit) Forecast, by Application 2020 & 2033
- Table 15: Canada Smart Card Industry Revenue (Million) Forecast, by Application 2020 & 2033
- Table 16: Canada Smart Card Industry Volume (K Unit) Forecast, by Application 2020 & 2033
- Table 17: Global Smart Card Industry Revenue Million Forecast, by Type 2020 & 2033
- Table 18: Global Smart Card Industry Volume K Unit Forecast, by Type 2020 & 2033
- Table 19: Global Smart Card Industry Revenue Million Forecast, by End-user Vertical 2020 & 2033
- Table 20: Global Smart Card Industry Volume K Unit Forecast, by End-user Vertical 2020 & 2033
- Table 21: Global Smart Card Industry Revenue Million Forecast, by Country 2020 & 2033
- Table 22: Global Smart Card Industry Volume K Unit Forecast, by Country 2020 & 2033
- Table 23: United Kingdom Smart Card Industry Revenue (Million) Forecast, by Application 2020 & 2033
- Table 24: United Kingdom Smart Card Industry Volume (K Unit) Forecast, by Application 2020 & 2033
- Table 25: Germany Smart Card Industry Revenue (Million) Forecast, by Application 2020 & 2033
- Table 26: Germany Smart Card Industry Volume (K Unit) Forecast, by Application 2020 & 2033
- Table 27: France Smart Card Industry Revenue (Million) Forecast, by Application 2020 & 2033
- Table 28: France Smart Card Industry Volume (K Unit) Forecast, by Application 2020 & 2033
- Table 29: Rest of Europe Smart Card Industry Revenue (Million) Forecast, by Application 2020 & 2033
- Table 30: Rest of Europe Smart Card Industry Volume (K Unit) Forecast, by Application 2020 & 2033
- Table 31: Global Smart Card Industry Revenue Million Forecast, by Type 2020 & 2033
- Table 32: Global Smart Card Industry Volume K Unit Forecast, by Type 2020 & 2033
- Table 33: Global Smart Card Industry Revenue Million Forecast, by End-user Vertical 2020 & 2033
- Table 34: Global Smart Card Industry Volume K Unit Forecast, by End-user Vertical 2020 & 2033
- Table 35: Global Smart Card Industry Revenue Million Forecast, by Country 2020 & 2033
- Table 36: Global Smart Card Industry Volume K Unit Forecast, by Country 2020 & 2033
- Table 37: China Smart Card Industry Revenue (Million) Forecast, by Application 2020 & 2033
- Table 38: China Smart Card Industry Volume (K Unit) Forecast, by Application 2020 & 2033
- Table 39: Japan Smart Card Industry Revenue (Million) Forecast, by Application 2020 & 2033
- Table 40: Japan Smart Card Industry Volume (K Unit) Forecast, by Application 2020 & 2033
- Table 41: India Smart Card Industry Revenue (Million) Forecast, by Application 2020 & 2033
- Table 42: India Smart Card Industry Volume (K Unit) Forecast, by Application 2020 & 2033
- Table 43: Rest of Asia Pacific Smart Card Industry Revenue (Million) Forecast, by Application 2020 & 2033
- Table 44: Rest of Asia Pacific Smart Card Industry Volume (K Unit) Forecast, by Application 2020 & 2033
- Table 45: Global Smart Card Industry Revenue Million Forecast, by Type 2020 & 2033
- Table 46: Global Smart Card Industry Volume K Unit Forecast, by Type 2020 & 2033
- Table 47: Global Smart Card Industry Revenue Million Forecast, by End-user Vertical 2020 & 2033
- Table 48: Global Smart Card Industry Volume K Unit Forecast, by End-user Vertical 2020 & 2033
- Table 49: Global Smart Card Industry Revenue Million Forecast, by Country 2020 & 2033
- Table 50: Global Smart Card Industry Volume K Unit Forecast, by Country 2020 & 2033
Frequently Asked Questions
1. What is the projected Compound Annual Growth Rate (CAGR) of the Smart Card Industry?
The projected CAGR is approximately 8.59%.
2. Which companies are prominent players in the Smart Card Industry?
Key companies in the market include HID Global Corporation (Assa Abloy AB), Infineon Technologies AG, IDEMIA France SAS, KONA I Co Ltd, CPI Card Group Inc, Samsung Electronics Co Ltd, Gemalto NV (Thales Group), Watchdata Technologies, Secura Key, Fingerprint Cards AB, Alioth LLC, CardLogix Corporation, Giesecke & Devrient GmbH (MC Familiengesellschaft mbH), Bundesdruckerei GmbH, IntelCav.
3. What are the main segments of the Smart Card Industry?
The market segments include Type, End-user Vertical.
4. Can you provide details about the market size?
The market size is estimated to be USD 18.69 Million as of 2022.
5. What are some drivers contributing to market growth?
Growing Deployment in Personal Identification and Access Control Applications; Extensive Use in Travel Identity and Transportation; Growing Demand for Contactless Payments.
6. What are the notable trends driving market growth?
Growing Deployment in Personal Identification and Access Control Applications to Drive the Market Growth.
7. Are there any restraints impacting market growth?
Privacy and Security Issues and Standardization concerns.
8. Can you provide examples of recent developments in the market?
April 2023: The GoSmart National Common Mobility Card was launched for passengers using the Kanpur metro in India. The NCMC card was initially introduced in Uttar Pradesh by the Kanpur Metro. The primary advantage of this card is that it is an interchangeable transport card, meaning that it may be used for other NCMC-compliant retail, parking, metro, bus, and other transportation services throughout the nation. Travelers can easily traverse the entire nation with the NCMC card. Along with facilitating smooth mobility, this also helps travelers save time and energy.
9. What pricing options are available for accessing the report?
Pricing options include single-user, multi-user, and enterprise licenses priced at USD 4750, USD 5250, and USD 8750 respectively.
10. Is the market size provided in terms of value or volume?
The market size is provided in terms of value, measured in Million and volume, measured in K Unit.
11. Are there any specific market keywords associated with the report?
Yes, the market keyword associated with the report is "Smart Card Industry," which aids in identifying and referencing the specific market segment covered.
12. How do I determine which pricing option suits my needs best?
The pricing options vary based on user requirements and access needs. Individual users may opt for single-user licenses, while businesses requiring broader access may choose multi-user or enterprise licenses for cost-effective access to the report.
13. Are there any additional resources or data provided in the Smart Card Industry report?
While the report offers comprehensive insights, it's advisable to review the specific contents or supplementary materials provided to ascertain if additional resources or data are available.
14. How can I stay updated on further developments or reports in the Smart Card Industry?
To stay informed about further developments, trends, and reports in the Smart Card Industry, consider subscribing to industry newsletters, following relevant companies and organizations, or regularly checking reputable industry news sources and publications.
Methodology
Step 1 - Identification of Relevant Samples Size from Population Database


Step 2 - Approaches for Defining Global Market Size (Value, Volume* & Price*)

Note*: In applicable scenarios
Step 3 - Data Sources
Primary Research
- Web Analytics
- Survey Reports
- Research Institute
- Latest Research Reports
- Opinion Leaders
Secondary Research
- Annual Reports
- White Paper
- Latest Press Release
- Industry Association
- Paid Database
- Investor Presentations

Step 4 - Data Triangulation
Involves using different sources of information in order to increase the validity of a study
These sources are likely to be stakeholders in a program - participants, other researchers, program staff, other community members, and so on.
Then we put all data in single framework & apply various statistical tools to find out the dynamic on the market.
During the analysis stage, feedback from the stakeholder groups would be compared to determine areas of agreement as well as areas of divergence