

Key Insights
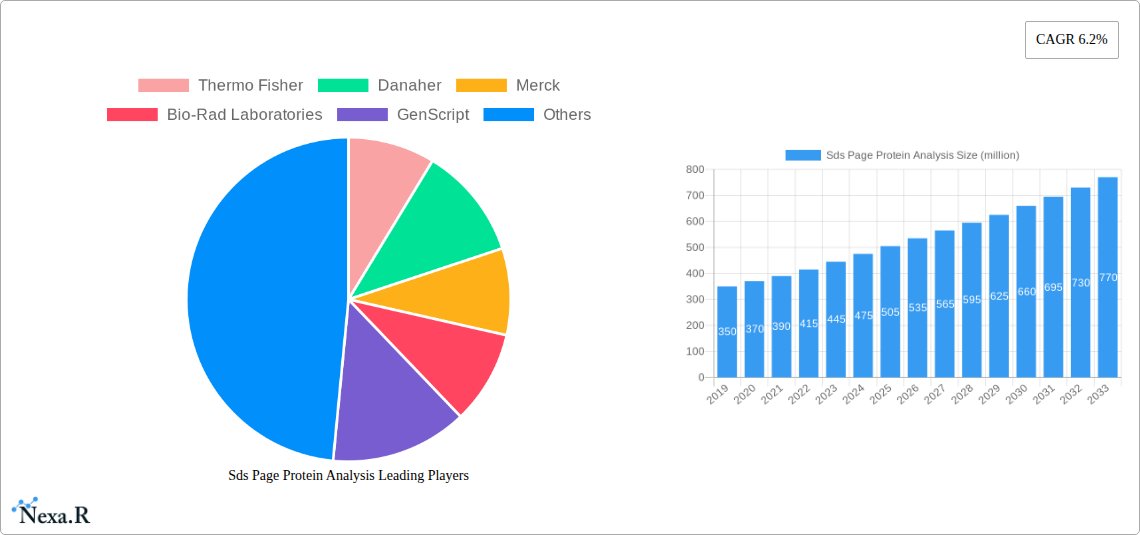
The SDS-PAGE protein analysis market is poised for significant expansion, projected to reach a substantial valuation with a robust Compound Annual Growth Rate (CAGR) of 6.2%. This upward trajectory is fueled by escalating demand across the biotechnology and pharmaceutical sectors, where SDS-PAGE remains an indispensable technique for protein separation, purification, and identification. The growing emphasis on drug discovery, development of novel therapeutics, and the expanding landscape of biopharmaceuticals are primary drivers. Furthermore, the burgeoning field of clinical research, driven by advancements in diagnostic tools and personalized medicine, contributes significantly to market growth. Academic institutions also play a vital role, leveraging SDS-PAGE for fundamental research and the training of future scientists. The market is segmented into key product types, including essential reagents, specialized gels, and advanced instrumentation, all of which are experiencing concurrent growth. Reagents and gels are consumed continuously in laboratory settings, while investments in sophisticated SDS-PAGE instruments are increasing with technological innovations offering enhanced resolution and throughput.
The market's expansion is further propelled by increasing investments in life sciences R&D globally, particularly in emerging economies. Advancements in protein-based therapeutics and the growing need for accurate protein quantification and characterization in various research applications underscore the market’s potential. The competitive landscape features key players like Thermo Fisher, Danaher, and Merck, alongside emerging regional manufacturers, all striving to innovate and capture market share through product development and strategic partnerships. While the market benefits from strong fundamental demand, challenges such as the development of alternative protein analysis techniques and the cost of high-end instrumentation could temper growth in certain segments. However, the inherent versatility and established protocols of SDS-PAGE ensure its continued relevance and dominance in protein analysis for the foreseeable future, with significant opportunities expected in regions like Asia Pacific and North America due to their robust research infrastructure and pharmaceutical industries.
SDS-PAGE Protein Analysis Market Dynamics & Structure
The global SDS-PAGE protein analysis market is characterized by a moderately concentrated competitive landscape, driven by significant technological innovation and stringent regulatory frameworks, particularly within the pharmaceutical and biotechnology parent markets. Key players like Thermo Fisher, Danaher, and Merck are at the forefront, leveraging continuous R&D to enhance instrument sensitivity, reagent specificity, and gel performance, thereby differentiating their product offerings. The pharmaceutical and biotechnology segment represents the largest application, projected to account for approximately 60% of the total market value in 2025, valued at $1,800 million. This dominance is fueled by the critical role of SDS-PAGE in drug discovery, protein characterization, and quality control.
- Market Concentration: Dominated by a few large multinational corporations, with a growing number of specialized and regional players contributing to market diversity.
- Technological Innovation Drivers: Advancements in gel matrix technology, automation of electrophoresis, and improved detection methods (e.g., enhanced chemiluminescence, fluorescent labeling).
- Regulatory Frameworks: Strict FDA and EMA guidelines for biopharmaceutical manufacturing necessitate robust protein analysis techniques, driving demand for validated SDS-PAGE solutions.
- Competitive Product Substitutes: While SDS-PAGE remains a gold standard, emerging techniques like capillary electrophoresis (CE) and mass spectrometry (MS) offer alternative or complementary protein separation and identification methods.
- End-User Demographics: Primarily academic and research institutions, followed by pharmaceutical and biotechnology companies, and clinical diagnostic laboratories.
- M&A Trends: Strategic acquisitions are common, focusing on acquiring novel technologies, expanding product portfolios, and increasing market reach. The historical period (2019-2024) saw an estimated 15 significant M&A deals, totaling over $500 million in value.
SDS-PAGE Protein Analysis Growth Trends & Insights
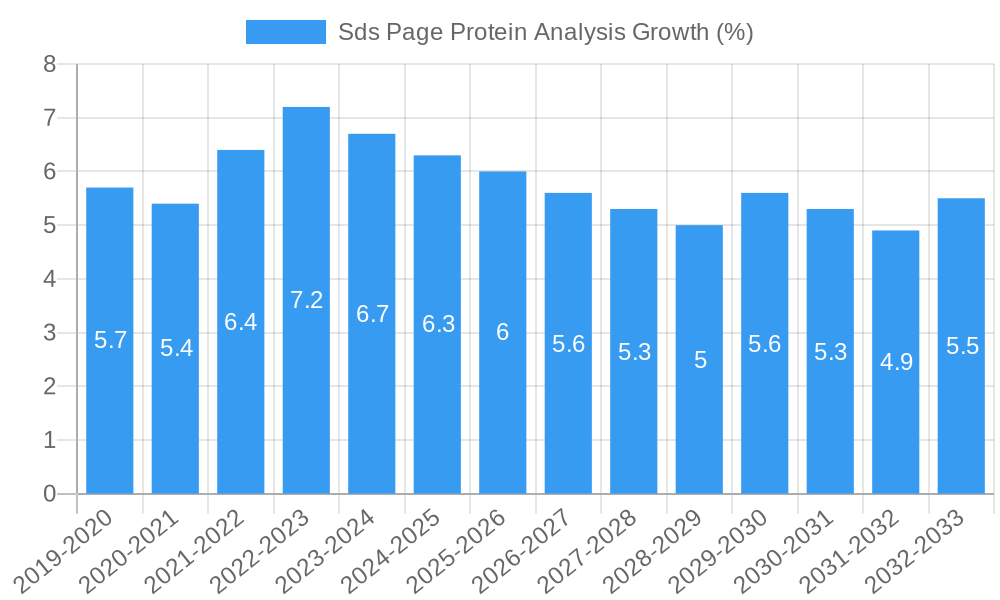
The global SDS-PAGE protein analysis market is poised for robust expansion, driven by an escalating demand for precise and efficient protein characterization across various life science disciplines. The market size evolution indicates a steady upward trajectory, with the estimated market value set to reach $3,300 million by 2025, growing at a Compound Annual Growth Rate (CAGR) of approximately 7.5% from 2019 to 2033. Adoption rates for advanced SDS-PAGE systems and high-performance reagents are steadily increasing, particularly within the biotechnology and pharmaceutical segments, which are experiencing accelerated research and development activities. Technological disruptions are constantly refining the market, with innovations focusing on faster run times, improved resolution, and enhanced multiplexing capabilities. Consumer behavior shifts are also playing a crucial role; researchers are increasingly prioritizing user-friendly, integrated systems that offer greater throughput and data reliability. The penetration of advanced SDS-PAGE instruments within academic institutions is expected to reach over 70% by 2025. The market’s growth is further amplified by the growing understanding of protein's role in disease pathogenesis, leading to increased investment in proteomic research. The integration of SDS-PAGE with downstream analysis techniques like Western blotting and mass spectrometry contributes to its sustained relevance and market growth. The "Others" segment, encompassing food and beverage quality control and agricultural research, is also showing promising growth, albeit from a smaller base. The forecast period (2025–2033) is anticipated to witness continued innovation in gel formulations and instrumentation, further solidifying SDS-PAGE's position as a cornerstone technique in biological research and development. The demand for high-quality protein standards and specialized buffers is also on the rise, reflecting a move towards more standardized and reproducible experimental outcomes.
Dominant Regions, Countries, or Segments in SDS-PAGE Protein Analysis
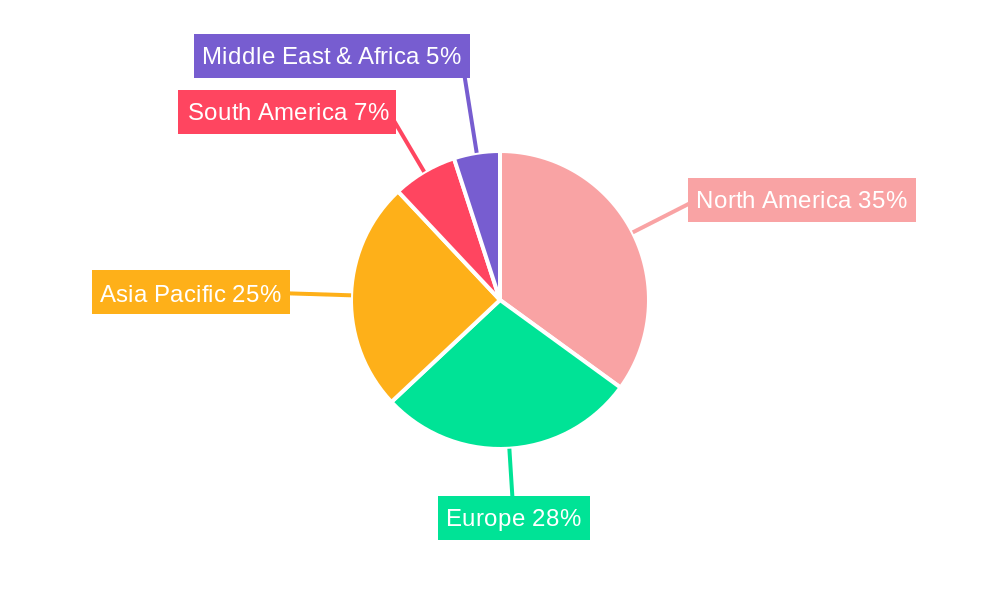
The global SDS-PAGE protein analysis market exhibits distinct regional dominance, with North America and Europe leading the charge, primarily driven by robust research infrastructure, significant government funding for life sciences, and the presence of major pharmaceutical and biotechnology hubs. In North America, the United States, accounting for an estimated 45% of the regional market share in 2025, valued at approximately $720 million, stands out due to its extensive network of leading academic institutions and a thriving biopharmaceutical industry.
Dominant Segments:
Application: Biotechnology and Pharmaceutical: This segment is the undisputed leader, driven by the extensive use of SDS-PAGE in drug discovery, development, protein purification, and quality control. Its market share in 2025 is projected to be around 60%, translating to $1,800 million.
- Key Drivers: High R&D expenditure, stringent regulatory requirements for biopharmaceutical production, and the need for precise protein characterization.
- Growth Potential: Continual advancements in biologics and biosimilars development will sustain and enhance demand.
Type: Reagents: Reagents, including buffers, stains, and pre-cast gels, represent a significant and consistently growing segment. In 2025, this segment is estimated to be valued at $1,320 million, holding approximately 40% of the total market value.
- Key Drivers: The recurring nature of reagent consumption, demand for higher sensitivity and specificity, and the development of novel, user-friendly formulations.
- Growth Potential: Innovations in fluorescent stains and high-definition gel technologies offer substantial growth opportunities.
Regional Dominance Factors:
North America:
- Economic Policies: Favorable R&D tax credits and government grants for scientific research.
- Infrastructure: Well-established research laboratories, universities, and a strong presence of contract research organizations (CROs).
- Market Share: Estimated 35% of the global market in 2025, valued at $1,050 million.
Europe:
- Regulatory Landscape: Strong regulatory frameworks (e.g., EMA) that necessitate robust analytical methods.
- Academic Excellence: Renowned universities and research institutes driving fundamental biological research.
- Market Share: Estimated 30% of the global market in 2025, valued at $900 million.
Emerging Regions:
- Asia Pacific: The Asia Pacific region, particularly China and India, is experiencing rapid growth due to increasing investments in biotechnology, a growing number of CROs, and expanding domestic pharmaceutical markets. China's domestic SDS-PAGE market is projected to grow at a CAGR of 8.2% during the forecast period. Beijing Liuyi Biotechnology and Beijing Qualityard Biotechnology are key domestic players contributing to this growth.
SDS-PAGE Protein Analysis Product Landscape
The SDS-PAGE protein analysis product landscape is dynamic, marked by continuous innovation aimed at enhancing resolution, speed, and ease of use. Manufacturers are offering a diverse range of pre-cast gels with varying acrylamide concentrations and buffer systems to cater to specific protein separation needs. Instruments are becoming more automated, featuring integrated power supplies, cooling systems, and digital interfaces for precise control and data acquisition. Thermo Fisher Scientific's introduction of advanced staining reagents with superior sensitivity and reduced background noise is a prime example of product evolution. GenScript's development of specialized protein ladder markers provides enhanced accuracy for molecular weight determination.
Key Drivers, Barriers & Challenges in SDS-PAGE Protein Analysis
Key Drivers:
- Growing demand for protein-based therapeutics and diagnostics: The expansion of the biopharmaceutical industry directly fuels the need for reliable protein analysis.
- Advancements in life sciences research: Increased understanding of proteomics and the role of proteins in disease necessitates precise protein characterization techniques.
- Technological innovations: Development of faster, higher-resolution gels, improved staining methods, and more automated electrophoresis systems.
- Increasing funding for research and development: Government and private sector investments in biological research.
Key Barriers & Challenges:
- Competition from alternative techniques: Capillary electrophoresis (CE) and mass spectrometry (MS) offer complementary or sometimes superior analytical capabilities.
- High cost of advanced instrumentation and reagents: Can be a barrier for smaller laboratories or institutions with limited budgets.
- Need for skilled personnel: Operating and interpreting results from SDS-PAGE requires trained professionals.
- Supply chain disruptions: Global events can impact the availability and cost of raw materials for gel and reagent production. The historical period (2019-2024) saw an estimated $250 million impact on the supply chain due to global disruptions.
Emerging Opportunities in SDS-PAGE Protein Analysis
Emerging opportunities in the SDS-PAGE protein analysis market lie in the development of integrated, high-throughput systems that can streamline the entire workflow from sample preparation to data analysis. The growing trend towards personalized medicine and the increasing focus on biomarker discovery present significant potential for SDS-PAGE applications. Furthermore, there's a growing demand for greener and more sustainable SDS-PAGE solutions, including biodegradable gel matrices and reduced chemical usage in staining procedures. The expansion of applications into the food and beverage industry for quality control and allergen detection also represents an untapped market.
Growth Accelerators in the SDS-PAGE Protein Analysis Industry
Several factors are accelerating the growth of the SDS-PAGE protein analysis industry. Continuous technological breakthroughs in gel matrix formulation and buffer optimization are leading to faster run times and sharper band resolution, making the technique more efficient. The strategic partnerships between instrument manufacturers and reagent suppliers are leading to the development of optimized, all-in-one solutions that enhance user convenience and data reliability. Market expansion strategies, particularly by companies like Danaher and Bio-Rad Laboratories, targeting emerging economies and academic institutions through educational outreach and affordable product lines, are also significant growth catalysts.
Key Players Shaping the SDS-PAGE Protein Analysis Market
- Thermo Fisher
- Danaher
- Merck
- Bio-Rad Laboratories
- GenScript
- Beijing Liuyi Biotechnology
- Rockland Immunochemicals
- Boston BioProducts
- Cleaver Scientific (Thistle Scientific)
- Hycult Biotech
- Elabscience Bionovation
- Cepham Life Sciences
- Beijing Qualityard Biotechnology
- Guangzhou Seyotin
- GenDEPOT
- Shanghai Genefist
Notable Milestones in SDS-PAGE Protein Analysis Sector
- 2019: Launch of new high-sensitivity fluorescent staining kits, improving detection limits for low-abundance proteins.
- 2020: Introduction of rapid-run pre-cast gels, reducing electrophoresis run times by up to 50%.
- 2021: Merger of two smaller biotechnology companies to enhance their combined product portfolios in protein analysis.
- 2022: Development of eco-friendly, biodegradable gel matrices to address sustainability concerns.
- 2023: Significant investment in automation for electrophoresis systems, enabling higher throughput and reduced manual labor.
- 2024: Release of advanced protein ladders with enhanced accuracy and wider molecular weight ranges.
In-Depth SDS-PAGE Protein Analysis Market Outlook
The SDS-PAGE protein analysis market is projected for sustained and significant growth, driven by its indispensable role in fundamental life science research and the burgeoning biopharmaceutical industry. Future market potential will be amplified by ongoing technological innovations, particularly in automation, multiplexing capabilities, and the development of highly sensitive and specific reagents. Strategic opportunities lie in expanding into emerging markets, focusing on user-friendly integrated systems, and capitalizing on the growing demand for sustainable laboratory solutions. The continuous evolution of protein-based therapeutics and diagnostics will ensure a persistent and growing need for reliable and advanced SDS-PAGE techniques.
Sds Page Protein Analysis Segmentation
-
1. Application
- 1.1. Biotechnology and Pharmaceutical
- 1.2. Clinical Research
- 1.3. Academic Institution
- 1.4. Others
-
2. Type
- 2.1. Reagents
- 2.2. Gels
- 2.3. Instruments
Sds Page Protein Analysis Segmentation By Geography
-
1. North America
- 1.1. United States
- 1.2. Canada
- 1.3. Mexico
-
2. South America
- 2.1. Brazil
- 2.2. Argentina
- 2.3. Rest of South America
-
3. Europe
- 3.1. United Kingdom
- 3.2. Germany
- 3.3. France
- 3.4. Italy
- 3.5. Spain
- 3.6. Russia
- 3.7. Benelux
- 3.8. Nordics
- 3.9. Rest of Europe
-
4. Middle East & Africa
- 4.1. Turkey
- 4.2. Israel
- 4.3. GCC
- 4.4. North Africa
- 4.5. South Africa
- 4.6. Rest of Middle East & Africa
-
5. Asia Pacific
- 5.1. China
- 5.2. India
- 5.3. Japan
- 5.4. South Korea
- 5.5. ASEAN
- 5.6. Oceania
- 5.7. Rest of Asia Pacific
Sds Page Protein Analysis REPORT HIGHLIGHTS
| Aspects | Details |
|---|---|
| Study Period | 2019-2033 |
| Base Year | 2024 |
| Estimated Year | 2025 |
| Forecast Period | 2025-2033 |
| Historical Period | 2019-2024 |
| Growth Rate | CAGR of 6.2% from 2019-2033 |
| Segmentation |
|
Table of Contents
- 1. Introduction
- 1.1. Research Scope
- 1.2. Market Segmentation
- 1.3. Research Methodology
- 1.4. Definitions and Assumptions
- 2. Executive Summary
- 2.1. Introduction
- 3. Market Dynamics
- 3.1. Introduction
- 3.2. Market Drivers
- 3.3. Market Restrains
- 3.4. Market Trends
- 4. Market Factor Analysis
- 4.1. Porters Five Forces
- 4.2. Supply/Value Chain
- 4.3. PESTEL analysis
- 4.4. Market Entropy
- 4.5. Patent/Trademark Analysis
- 5. Global Sds Page Protein Analysis Analysis, Insights and Forecast, 2019-2031
- 5.1. Market Analysis, Insights and Forecast - by Application
- 5.1.1. Biotechnology and Pharmaceutical
- 5.1.2. Clinical Research
- 5.1.3. Academic Institution
- 5.1.4. Others
- 5.2. Market Analysis, Insights and Forecast - by Type
- 5.2.1. Reagents
- 5.2.2. Gels
- 5.2.3. Instruments
- 5.3. Market Analysis, Insights and Forecast - by Region
- 5.3.1. North America
- 5.3.2. South America
- 5.3.3. Europe
- 5.3.4. Middle East & Africa
- 5.3.5. Asia Pacific
- 5.1. Market Analysis, Insights and Forecast - by Application
- 6. North America Sds Page Protein Analysis Analysis, Insights and Forecast, 2019-2031
- 6.1. Market Analysis, Insights and Forecast - by Application
- 6.1.1. Biotechnology and Pharmaceutical
- 6.1.2. Clinical Research
- 6.1.3. Academic Institution
- 6.1.4. Others
- 6.2. Market Analysis, Insights and Forecast - by Type
- 6.2.1. Reagents
- 6.2.2. Gels
- 6.2.3. Instruments
- 6.1. Market Analysis, Insights and Forecast - by Application
- 7. South America Sds Page Protein Analysis Analysis, Insights and Forecast, 2019-2031
- 7.1. Market Analysis, Insights and Forecast - by Application
- 7.1.1. Biotechnology and Pharmaceutical
- 7.1.2. Clinical Research
- 7.1.3. Academic Institution
- 7.1.4. Others
- 7.2. Market Analysis, Insights and Forecast - by Type
- 7.2.1. Reagents
- 7.2.2. Gels
- 7.2.3. Instruments
- 7.1. Market Analysis, Insights and Forecast - by Application
- 8. Europe Sds Page Protein Analysis Analysis, Insights and Forecast, 2019-2031
- 8.1. Market Analysis, Insights and Forecast - by Application
- 8.1.1. Biotechnology and Pharmaceutical
- 8.1.2. Clinical Research
- 8.1.3. Academic Institution
- 8.1.4. Others
- 8.2. Market Analysis, Insights and Forecast - by Type
- 8.2.1. Reagents
- 8.2.2. Gels
- 8.2.3. Instruments
- 8.1. Market Analysis, Insights and Forecast - by Application
- 9. Middle East & Africa Sds Page Protein Analysis Analysis, Insights and Forecast, 2019-2031
- 9.1. Market Analysis, Insights and Forecast - by Application
- 9.1.1. Biotechnology and Pharmaceutical
- 9.1.2. Clinical Research
- 9.1.3. Academic Institution
- 9.1.4. Others
- 9.2. Market Analysis, Insights and Forecast - by Type
- 9.2.1. Reagents
- 9.2.2. Gels
- 9.2.3. Instruments
- 9.1. Market Analysis, Insights and Forecast - by Application
- 10. Asia Pacific Sds Page Protein Analysis Analysis, Insights and Forecast, 2019-2031
- 10.1. Market Analysis, Insights and Forecast - by Application
- 10.1.1. Biotechnology and Pharmaceutical
- 10.1.2. Clinical Research
- 10.1.3. Academic Institution
- 10.1.4. Others
- 10.2. Market Analysis, Insights and Forecast - by Type
- 10.2.1. Reagents
- 10.2.2. Gels
- 10.2.3. Instruments
- 10.1. Market Analysis, Insights and Forecast - by Application
- 11. Competitive Analysis
- 11.1. Global Market Share Analysis 2024
- 11.2. Company Profiles
- 11.2.1 Thermo Fisher
- 11.2.1.1. Overview
- 11.2.1.2. Products
- 11.2.1.3. SWOT Analysis
- 11.2.1.4. Recent Developments
- 11.2.1.5. Financials (Based on Availability)
- 11.2.2 Danaher
- 11.2.2.1. Overview
- 11.2.2.2. Products
- 11.2.2.3. SWOT Analysis
- 11.2.2.4. Recent Developments
- 11.2.2.5. Financials (Based on Availability)
- 11.2.3 Merck
- 11.2.3.1. Overview
- 11.2.3.2. Products
- 11.2.3.3. SWOT Analysis
- 11.2.3.4. Recent Developments
- 11.2.3.5. Financials (Based on Availability)
- 11.2.4 Bio-Rad Laboratories
- 11.2.4.1. Overview
- 11.2.4.2. Products
- 11.2.4.3. SWOT Analysis
- 11.2.4.4. Recent Developments
- 11.2.4.5. Financials (Based on Availability)
- 11.2.5 GenScript
- 11.2.5.1. Overview
- 11.2.5.2. Products
- 11.2.5.3. SWOT Analysis
- 11.2.5.4. Recent Developments
- 11.2.5.5. Financials (Based on Availability)
- 11.2.6 Beijing Liuyi Biotechnology
- 11.2.6.1. Overview
- 11.2.6.2. Products
- 11.2.6.3. SWOT Analysis
- 11.2.6.4. Recent Developments
- 11.2.6.5. Financials (Based on Availability)
- 11.2.7 Rockland Immunochemicals
- 11.2.7.1. Overview
- 11.2.7.2. Products
- 11.2.7.3. SWOT Analysis
- 11.2.7.4. Recent Developments
- 11.2.7.5. Financials (Based on Availability)
- 11.2.8 Boston BioProducts
- 11.2.8.1. Overview
- 11.2.8.2. Products
- 11.2.8.3. SWOT Analysis
- 11.2.8.4. Recent Developments
- 11.2.8.5. Financials (Based on Availability)
- 11.2.9 Cleaver Scientific (Thistle Scientific)
- 11.2.9.1. Overview
- 11.2.9.2. Products
- 11.2.9.3. SWOT Analysis
- 11.2.9.4. Recent Developments
- 11.2.9.5. Financials (Based on Availability)
- 11.2.10 Hycult Biotech
- 11.2.10.1. Overview
- 11.2.10.2. Products
- 11.2.10.3. SWOT Analysis
- 11.2.10.4. Recent Developments
- 11.2.10.5. Financials (Based on Availability)
- 11.2.11 Elabscience Bionovation
- 11.2.11.1. Overview
- 11.2.11.2. Products
- 11.2.11.3. SWOT Analysis
- 11.2.11.4. Recent Developments
- 11.2.11.5. Financials (Based on Availability)
- 11.2.12 Cepham Life Sciences
- 11.2.12.1. Overview
- 11.2.12.2. Products
- 11.2.12.3. SWOT Analysis
- 11.2.12.4. Recent Developments
- 11.2.12.5. Financials (Based on Availability)
- 11.2.13 Beijing Qualityard Biotechnology
- 11.2.13.1. Overview
- 11.2.13.2. Products
- 11.2.13.3. SWOT Analysis
- 11.2.13.4. Recent Developments
- 11.2.13.5. Financials (Based on Availability)
- 11.2.14 Guangzhou Seyotin
- 11.2.14.1. Overview
- 11.2.14.2. Products
- 11.2.14.3. SWOT Analysis
- 11.2.14.4. Recent Developments
- 11.2.14.5. Financials (Based on Availability)
- 11.2.15 GenDEPOT
- 11.2.15.1. Overview
- 11.2.15.2. Products
- 11.2.15.3. SWOT Analysis
- 11.2.15.4. Recent Developments
- 11.2.15.5. Financials (Based on Availability)
- 11.2.16 Shanghai Genefist
- 11.2.16.1. Overview
- 11.2.16.2. Products
- 11.2.16.3. SWOT Analysis
- 11.2.16.4. Recent Developments
- 11.2.16.5. Financials (Based on Availability)
- 11.2.1 Thermo Fisher
List of Figures
- Figure 1: Global Sds Page Protein Analysis Revenue Breakdown (million, %) by Region 2024 & 2032
- Figure 2: North America Sds Page Protein Analysis Revenue (million), by Application 2024 & 2032
- Figure 3: North America Sds Page Protein Analysis Revenue Share (%), by Application 2024 & 2032
- Figure 4: North America Sds Page Protein Analysis Revenue (million), by Type 2024 & 2032
- Figure 5: North America Sds Page Protein Analysis Revenue Share (%), by Type 2024 & 2032
- Figure 6: North America Sds Page Protein Analysis Revenue (million), by Country 2024 & 2032
- Figure 7: North America Sds Page Protein Analysis Revenue Share (%), by Country 2024 & 2032
- Figure 8: South America Sds Page Protein Analysis Revenue (million), by Application 2024 & 2032
- Figure 9: South America Sds Page Protein Analysis Revenue Share (%), by Application 2024 & 2032
- Figure 10: South America Sds Page Protein Analysis Revenue (million), by Type 2024 & 2032
- Figure 11: South America Sds Page Protein Analysis Revenue Share (%), by Type 2024 & 2032
- Figure 12: South America Sds Page Protein Analysis Revenue (million), by Country 2024 & 2032
- Figure 13: South America Sds Page Protein Analysis Revenue Share (%), by Country 2024 & 2032
- Figure 14: Europe Sds Page Protein Analysis Revenue (million), by Application 2024 & 2032
- Figure 15: Europe Sds Page Protein Analysis Revenue Share (%), by Application 2024 & 2032
- Figure 16: Europe Sds Page Protein Analysis Revenue (million), by Type 2024 & 2032
- Figure 17: Europe Sds Page Protein Analysis Revenue Share (%), by Type 2024 & 2032
- Figure 18: Europe Sds Page Protein Analysis Revenue (million), by Country 2024 & 2032
- Figure 19: Europe Sds Page Protein Analysis Revenue Share (%), by Country 2024 & 2032
- Figure 20: Middle East & Africa Sds Page Protein Analysis Revenue (million), by Application 2024 & 2032
- Figure 21: Middle East & Africa Sds Page Protein Analysis Revenue Share (%), by Application 2024 & 2032
- Figure 22: Middle East & Africa Sds Page Protein Analysis Revenue (million), by Type 2024 & 2032
- Figure 23: Middle East & Africa Sds Page Protein Analysis Revenue Share (%), by Type 2024 & 2032
- Figure 24: Middle East & Africa Sds Page Protein Analysis Revenue (million), by Country 2024 & 2032
- Figure 25: Middle East & Africa Sds Page Protein Analysis Revenue Share (%), by Country 2024 & 2032
- Figure 26: Asia Pacific Sds Page Protein Analysis Revenue (million), by Application 2024 & 2032
- Figure 27: Asia Pacific Sds Page Protein Analysis Revenue Share (%), by Application 2024 & 2032
- Figure 28: Asia Pacific Sds Page Protein Analysis Revenue (million), by Type 2024 & 2032
- Figure 29: Asia Pacific Sds Page Protein Analysis Revenue Share (%), by Type 2024 & 2032
- Figure 30: Asia Pacific Sds Page Protein Analysis Revenue (million), by Country 2024 & 2032
- Figure 31: Asia Pacific Sds Page Protein Analysis Revenue Share (%), by Country 2024 & 2032
List of Tables
- Table 1: Global Sds Page Protein Analysis Revenue million Forecast, by Region 2019 & 2032
- Table 2: Global Sds Page Protein Analysis Revenue million Forecast, by Application 2019 & 2032
- Table 3: Global Sds Page Protein Analysis Revenue million Forecast, by Type 2019 & 2032
- Table 4: Global Sds Page Protein Analysis Revenue million Forecast, by Region 2019 & 2032
- Table 5: Global Sds Page Protein Analysis Revenue million Forecast, by Application 2019 & 2032
- Table 6: Global Sds Page Protein Analysis Revenue million Forecast, by Type 2019 & 2032
- Table 7: Global Sds Page Protein Analysis Revenue million Forecast, by Country 2019 & 2032
- Table 8: United States Sds Page Protein Analysis Revenue (million) Forecast, by Application 2019 & 2032
- Table 9: Canada Sds Page Protein Analysis Revenue (million) Forecast, by Application 2019 & 2032
- Table 10: Mexico Sds Page Protein Analysis Revenue (million) Forecast, by Application 2019 & 2032
- Table 11: Global Sds Page Protein Analysis Revenue million Forecast, by Application 2019 & 2032
- Table 12: Global Sds Page Protein Analysis Revenue million Forecast, by Type 2019 & 2032
- Table 13: Global Sds Page Protein Analysis Revenue million Forecast, by Country 2019 & 2032
- Table 14: Brazil Sds Page Protein Analysis Revenue (million) Forecast, by Application 2019 & 2032
- Table 15: Argentina Sds Page Protein Analysis Revenue (million) Forecast, by Application 2019 & 2032
- Table 16: Rest of South America Sds Page Protein Analysis Revenue (million) Forecast, by Application 2019 & 2032
- Table 17: Global Sds Page Protein Analysis Revenue million Forecast, by Application 2019 & 2032
- Table 18: Global Sds Page Protein Analysis Revenue million Forecast, by Type 2019 & 2032
- Table 19: Global Sds Page Protein Analysis Revenue million Forecast, by Country 2019 & 2032
- Table 20: United Kingdom Sds Page Protein Analysis Revenue (million) Forecast, by Application 2019 & 2032
- Table 21: Germany Sds Page Protein Analysis Revenue (million) Forecast, by Application 2019 & 2032
- Table 22: France Sds Page Protein Analysis Revenue (million) Forecast, by Application 2019 & 2032
- Table 23: Italy Sds Page Protein Analysis Revenue (million) Forecast, by Application 2019 & 2032
- Table 24: Spain Sds Page Protein Analysis Revenue (million) Forecast, by Application 2019 & 2032
- Table 25: Russia Sds Page Protein Analysis Revenue (million) Forecast, by Application 2019 & 2032
- Table 26: Benelux Sds Page Protein Analysis Revenue (million) Forecast, by Application 2019 & 2032
- Table 27: Nordics Sds Page Protein Analysis Revenue (million) Forecast, by Application 2019 & 2032
- Table 28: Rest of Europe Sds Page Protein Analysis Revenue (million) Forecast, by Application 2019 & 2032
- Table 29: Global Sds Page Protein Analysis Revenue million Forecast, by Application 2019 & 2032
- Table 30: Global Sds Page Protein Analysis Revenue million Forecast, by Type 2019 & 2032
- Table 31: Global Sds Page Protein Analysis Revenue million Forecast, by Country 2019 & 2032
- Table 32: Turkey Sds Page Protein Analysis Revenue (million) Forecast, by Application 2019 & 2032
- Table 33: Israel Sds Page Protein Analysis Revenue (million) Forecast, by Application 2019 & 2032
- Table 34: GCC Sds Page Protein Analysis Revenue (million) Forecast, by Application 2019 & 2032
- Table 35: North Africa Sds Page Protein Analysis Revenue (million) Forecast, by Application 2019 & 2032
- Table 36: South Africa Sds Page Protein Analysis Revenue (million) Forecast, by Application 2019 & 2032
- Table 37: Rest of Middle East & Africa Sds Page Protein Analysis Revenue (million) Forecast, by Application 2019 & 2032
- Table 38: Global Sds Page Protein Analysis Revenue million Forecast, by Application 2019 & 2032
- Table 39: Global Sds Page Protein Analysis Revenue million Forecast, by Type 2019 & 2032
- Table 40: Global Sds Page Protein Analysis Revenue million Forecast, by Country 2019 & 2032
- Table 41: China Sds Page Protein Analysis Revenue (million) Forecast, by Application 2019 & 2032
- Table 42: India Sds Page Protein Analysis Revenue (million) Forecast, by Application 2019 & 2032
- Table 43: Japan Sds Page Protein Analysis Revenue (million) Forecast, by Application 2019 & 2032
- Table 44: South Korea Sds Page Protein Analysis Revenue (million) Forecast, by Application 2019 & 2032
- Table 45: ASEAN Sds Page Protein Analysis Revenue (million) Forecast, by Application 2019 & 2032
- Table 46: Oceania Sds Page Protein Analysis Revenue (million) Forecast, by Application 2019 & 2032
- Table 47: Rest of Asia Pacific Sds Page Protein Analysis Revenue (million) Forecast, by Application 2019 & 2032
Frequently Asked Questions
1. What is the projected Compound Annual Growth Rate (CAGR) of the Sds Page Protein Analysis?
The projected CAGR is approximately 6.2%.
2. Which companies are prominent players in the Sds Page Protein Analysis?
Key companies in the market include Thermo Fisher, Danaher, Merck, Bio-Rad Laboratories, GenScript, Beijing Liuyi Biotechnology, Rockland Immunochemicals, Boston BioProducts, Cleaver Scientific (Thistle Scientific), Hycult Biotech, Elabscience Bionovation, Cepham Life Sciences, Beijing Qualityard Biotechnology, Guangzhou Seyotin, GenDEPOT, Shanghai Genefist.
3. What are the main segments of the Sds Page Protein Analysis?
The market segments include Application, Type.
4. Can you provide details about the market size?
The market size is estimated to be USD 571 million as of 2022.
5. What are some drivers contributing to market growth?
N/A
6. What are the notable trends driving market growth?
N/A
7. Are there any restraints impacting market growth?
N/A
8. Can you provide examples of recent developments in the market?
N/A
9. What pricing options are available for accessing the report?
Pricing options include single-user, multi-user, and enterprise licenses priced at USD 4250.00, USD 6375.00, and USD 8500.00 respectively.
10. Is the market size provided in terms of value or volume?
The market size is provided in terms of value, measured in million.
11. Are there any specific market keywords associated with the report?
Yes, the market keyword associated with the report is "Sds Page Protein Analysis," which aids in identifying and referencing the specific market segment covered.
12. How do I determine which pricing option suits my needs best?
The pricing options vary based on user requirements and access needs. Individual users may opt for single-user licenses, while businesses requiring broader access may choose multi-user or enterprise licenses for cost-effective access to the report.
13. Are there any additional resources or data provided in the Sds Page Protein Analysis report?
While the report offers comprehensive insights, it's advisable to review the specific contents or supplementary materials provided to ascertain if additional resources or data are available.
14. How can I stay updated on further developments or reports in the Sds Page Protein Analysis?
To stay informed about further developments, trends, and reports in the Sds Page Protein Analysis, consider subscribing to industry newsletters, following relevant companies and organizations, or regularly checking reputable industry news sources and publications.
Methodology
Step 1 - Identification of Relevant Samples Size from Population Database


Step 2 - Approaches for Defining Global Market Size (Value, Volume* & Price*)

Note*: In applicable scenarios
Step 3 - Data Sources
Primary Research
- Web Analytics
- Survey Reports
- Research Institute
- Latest Research Reports
- Opinion Leaders
Secondary Research
- Annual Reports
- White Paper
- Latest Press Release
- Industry Association
- Paid Database
- Investor Presentations

Step 4 - Data Triangulation
Involves using different sources of information in order to increase the validity of a study
These sources are likely to be stakeholders in a program - participants, other researchers, program staff, other community members, and so on.
Then we put all data in single framework & apply various statistical tools to find out the dynamic on the market.
During the analysis stage, feedback from the stakeholder groups would be compared to determine areas of agreement as well as areas of divergence
