

Key Insights
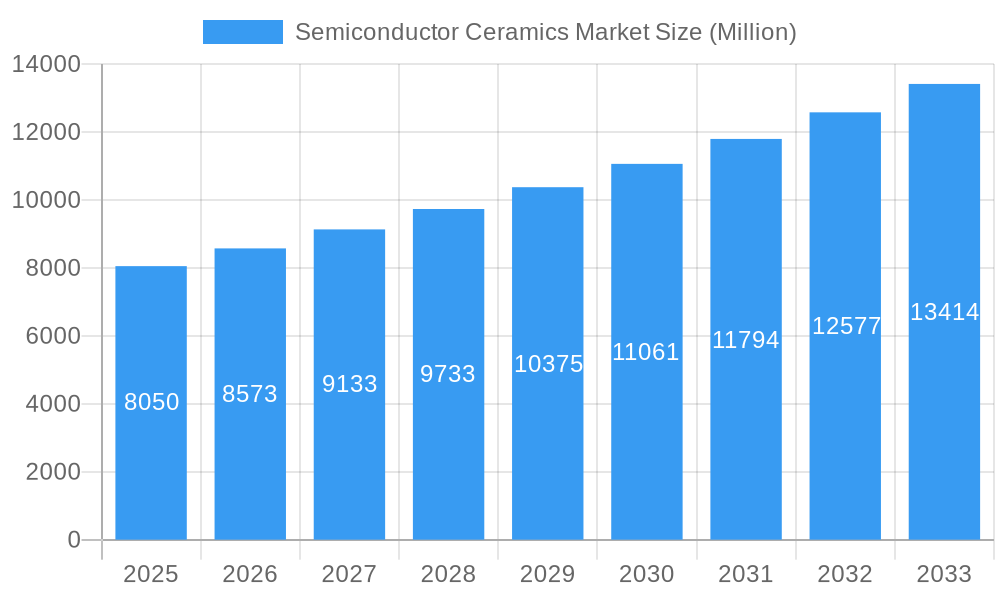
The semiconductor ceramics market, valued at $8.05 billion in 2025, is projected to experience robust growth, driven by the increasing demand for advanced semiconductor devices in various applications, including 5G infrastructure, data centers, and automotive electronics. The market's Compound Annual Growth Rate (CAGR) of 6.42% from 2025 to 2033 indicates a significant expansion, fueled by technological advancements leading to miniaturization and higher performance in semiconductor packaging. Key drivers include the rising adoption of advanced packaging techniques like 3D integration and heterogeneous integration, demanding high-performance ceramic substrates. Furthermore, the growing demand for high-frequency, high-power, and high-reliability components in diverse sectors is propelling market expansion. Competitive pressures among established players like CeramTec GmbH, CoorsTek Inc., and Corning Incorporated, alongside emerging players, foster innovation and drive down costs, further fueling market growth.
Semiconductor Ceramics Market Market Size (In Billion)
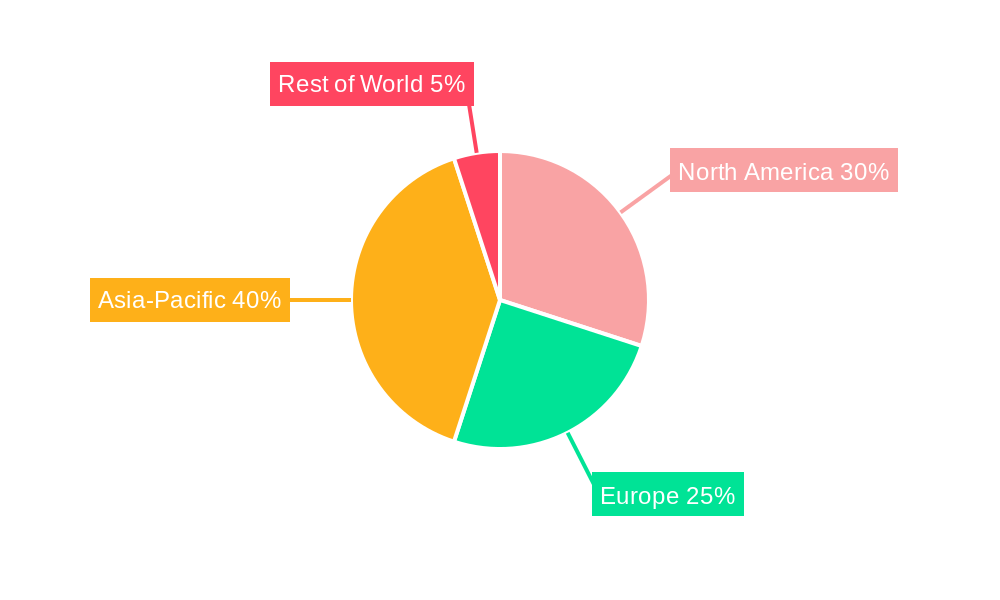
However, challenges exist. The semiconductor industry's cyclical nature, coupled with potential supply chain disruptions and geopolitical uncertainties, could pose restraints. Fluctuations in raw material prices and the complexity of manufacturing advanced ceramic materials also represent ongoing hurdles. Nevertheless, the long-term outlook remains positive, with continued investment in research and development of new ceramic materials with improved thermal conductivity, dielectric strength, and chemical resistance. Segmentation within the market likely includes diverse ceramic types (e.g., alumina, silicon carbide, aluminum nitride) tailored to specific applications and packaging needs. The geographic distribution is anticipated to see strong growth across Asia-Pacific regions, fueled by major semiconductor manufacturing hubs and a growing consumer electronics market, closely followed by North America and Europe.
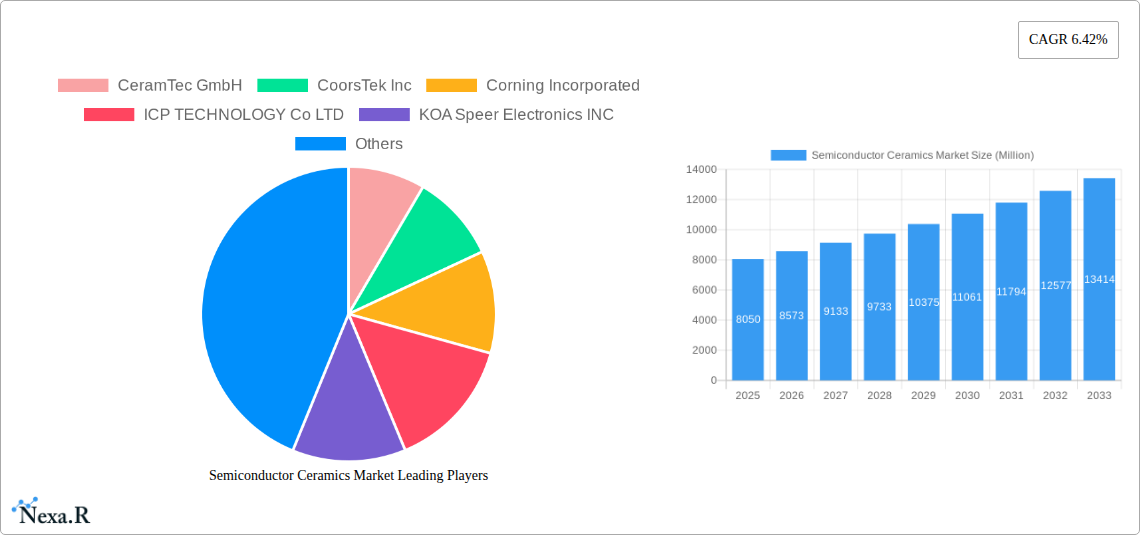
Semiconductor Ceramics Market Company Market Share
Semiconductor Ceramics Market: A Comprehensive Report (2019-2033)
This in-depth report provides a comprehensive analysis of the Semiconductor Ceramics Market, encompassing market dynamics, growth trends, regional dominance, product landscape, key players, and future outlook. The study period covers 2019-2033, with 2025 as the base and estimated year. This report is crucial for industry professionals, investors, and researchers seeking to understand and capitalize on opportunities within this dynamic sector. The parent market is the broader advanced ceramics market, while the child market focuses specifically on semiconductor applications.
Semiconductor Ceramics Market Dynamics & Structure
The Semiconductor Ceramics market, valued at xx Million units in 2025, exhibits a moderately concentrated structure. Key players, including CeramTec GmbH, CoorsTek Inc., and Corning Incorporated, hold significant market share, but the market also features several smaller, specialized players. Technological innovation, particularly in materials science and manufacturing processes, is a major driver, alongside stringent regulatory frameworks concerning material safety and environmental impact. The market faces competitive pressure from alternative substrate materials like polymers and composites, but the unique properties of semiconductor ceramics, such as high thermal conductivity and dielectric strength, maintain their dominance in high-performance applications. M&A activity has been moderate in recent years, with xx deals recorded between 2019 and 2024, driven primarily by consolidation efforts and access to specialized technologies.
- Market Concentration: Moderately concentrated, with a few dominant players and numerous niche players.
- Technological Innovation: Significant driver, focusing on enhanced thermal conductivity, improved dielectric strength, and miniaturization.
- Regulatory Framework: Stringent regulations on material safety and environmental impact influence market dynamics.
- Competitive Substitutes: Polymers and composites pose a competitive threat in certain applications.
- M&A Trends: Moderate activity observed, driven by consolidation and access to technology. xx deals between 2019-2024.
- Innovation Barriers: High R&D costs and complex manufacturing processes.
Semiconductor Ceramics Market Growth Trends & Insights
The Semiconductor Ceramics market has experienced robust growth in recent years, exhibiting a CAGR of xx% during the historical period (2019-2024). This growth is fueled by increasing demand for high-performance electronics across various end-use sectors, including 5G infrastructure, data centers, automotive electronics, and renewable energy systems. Technological advancements, such as the development of advanced ceramic materials with enhanced properties, have further accelerated market expansion. Adoption rates are increasing rapidly, particularly in high-end applications demanding superior thermal management and electrical insulation. Consumer preference for smaller, faster, and more energy-efficient electronics further supports market growth. The market is projected to reach xx Million units by 2033, with a projected CAGR of xx% during the forecast period (2025-2033). Market penetration within specific high-growth segments remains relatively high in mature markets, but significant room for growth is projected within emerging markets.
Dominant Regions, Countries, or Segments in Semiconductor Ceramics Market
The North American semiconductor ceramics market currently holds the leading position, driven by strong demand from the electronics and automotive industries, robust R&D investment, and favorable government policies. Asia-Pacific is a rapidly expanding region, primarily due to significant growth in electronics manufacturing in countries like China, South Korea, and Taiwan. Europe shows steady growth, driven by the expanding renewable energy sector and automotive industry. Specific segments driving growth include high-frequency applications, power electronics, and sensor technologies.
- North America: Strong demand, robust R&D, and supportive government policies drive market leadership.
- Asia-Pacific: Rapid expansion due to significant electronics manufacturing growth.
- Europe: Steady growth fuelled by the renewable energy and automotive sectors.
- Key Growth Drivers: Government incentives, technological advancements, increasing demand for miniaturized electronics, and the rise of electric vehicles.
Semiconductor Ceramics Market Product Landscape
Semiconductor ceramics encompass a range of materials, including alumina, zirconia, silicon carbide, and silicon nitride, each tailored for specific applications based on their thermal conductivity, dielectric strength, and mechanical properties. Recent innovations focus on enhancing these properties further, enabling the development of smaller, more efficient, and durable electronic components. Key product advancements include the introduction of high-temperature-resistant materials and advanced manufacturing techniques like 3D printing. Unique selling propositions include superior thermal management capabilities, high reliability, and dimensional stability.
Key Drivers, Barriers & Challenges in Semiconductor Ceramics Market
Key Drivers:
- The burgeoning demand for high-performance electronics in various sectors such as automotive and renewable energy.
- Continuous technological advancements driving the development of superior materials and manufacturing processes.
- Government support and investment in research and development.
Challenges and Restraints:
- High manufacturing costs and complexities associated with the production of advanced ceramic materials.
- The threat of substitute materials, especially polymers and other substrates.
- Potential supply chain disruptions caused by geopolitical uncertainties and raw material scarcity. This has impacted production by approximately xx% in specific regions.
Emerging Opportunities in Semiconductor Ceramics Market
Untapped markets in developing countries, coupled with the rise of new applications, such as flexible electronics and wearable devices, present significant growth opportunities. Innovation in material science, manufacturing processes, and strategic partnerships will be essential to fully capitalize on these opportunities. The increasing demand for electric vehicles and renewable energy technologies also presents immense potential.
Growth Accelerators in the Semiconductor Ceramics Market Industry
Technological breakthroughs, such as the development of new materials with superior properties, are crucial drivers of long-term growth. Strategic collaborations between materials suppliers and electronics manufacturers are also important to accelerate innovation and enhance efficiency. Expansion into new markets and applications, along with proactive investment in R&D, will further propel market growth.
Key Players Shaping the Semiconductor Ceramics Market Market
- CeramTec GmbH
- CoorsTek Inc
- Corning Incorporated
- ICP TECHNOLOGY Co LTD
- KOA Speer Electronics INC
- KYOCERA Corporation
- LEATEC Fine Ceramics Co Ltd
- MARUWA Co Ltd
- NEOTech
- NIPPON CARBIDE INDUSTRIES CO INC
- Niterra Co Ltd
- Ortech Advanced Ceramics
- Toshiba Materials Co Ltd
- TTM Technologies Inc
- Yokowo co ltd *List Not Exhaustive
Notable Milestones in Semiconductor Ceramics Market Sector
- June 2024: CeramTec launches Sinalit, a silicon nitride (Si3N4) ceramic substrate for power electronic modules, targeting e-mobility and renewable energy.
- May 2023: CeramTec introduces Rubalit ZTA, a zirconia-toughened alumina (ZTA) substrate for power generation and electromobility applications.
In-Depth Semiconductor Ceramics Market Market Outlook
The Semiconductor Ceramics market is poised for continued strong growth, driven by technological advancements, increasing demand from diverse end-use sectors, and strategic partnerships fostering innovation. The market's future potential is significant, with opportunities for expansion into new applications and geographic regions. Companies that strategically invest in R&D, adapt to evolving market trends, and establish strong supply chains will be best positioned to capitalize on this potential.
Semiconductor Ceramics Market Segmentation
-
1. Type
- 1.1. Alumina
- 1.2. Aluminum Nitride
- 1.3. Silicon Nitride
- 1.4. Beryllium Oxide
- 1.5. Others
-
2. End-user Industry
- 2.1. Consumer Electronics
- 2.2. Aerospace & Defense
- 2.3. Automotive
- 2.4. Semiconductor
- 2.5. Telecommunication
- 2.6. Others
Semiconductor Ceramics Market Segmentation By Geography
-
1. Asia Pacific
- 1.1. China
- 1.2. India
- 1.3. Japan
- 1.4. South Korea
- 1.5. Malaysia
- 1.6. Thailand
- 1.7. Indonesia
- 1.8. Vietnam
- 1.9. Rest of Asia Pacific
-
2. North America
- 2.1. United States
- 2.2. Canada
- 2.3. Mexico
-
3. Europe
- 3.1. Germany
- 3.2. United Kingdom
- 3.3. France
- 3.4. Italy
- 3.5. Spain
- 3.6. Nordic Countries
- 3.7. Turkey
- 3.8. Russia
- 3.9. Rest of Europe
-
4. South America
- 4.1. Brazil
- 4.2. Argentina
- 4.3. Colombia
- 4.4. Rest of South America
-
5. Middle East and Africa
- 5.1. Saudi Arabia
- 5.2. Qatar
- 5.3. United Arab Emirates
- 5.4. Nigeria
- 5.5. Egypt
- 5.6. South Africa
- 5.7. Rest of Middle East and Africa
Semiconductor Ceramics Market Regional Market Share
Geographic Coverage of Semiconductor Ceramics Market
Semiconductor Ceramics Market REPORT HIGHLIGHTS
| Aspects | Details |
|---|---|
| Study Period | 2020-2034 |
| Base Year | 2025 |
| Estimated Year | 2026 |
| Forecast Period | 2026-2034 |
| Historical Period | 2020-2025 |
| Growth Rate | CAGR of 6.42% from 2020-2034 |
| Segmentation |
|
Table of Contents
- 1. Introduction
- 1.1. Research Scope
- 1.2. Market Segmentation
- 1.3. Research Objective
- 1.4. Definitions and Assumptions
- 2. Executive Summary
- 2.1. Market Snapshot
- 3. Market Dynamics
- 3.1. Market Drivers
- 3.2. Market Restrains
- 3.3. Market Trends
- 3.4. Market Opportunities
- 4. Market Factor Analysis
- 4.1. Porters Five Forces
- 4.1.1. Bargaining Power of Suppliers
- 4.1.2. Bargaining Power of Buyers
- 4.1.3. Threat of New Entrants
- 4.1.4. Threat of Substitutes
- 4.1.5. Competitive Rivalry
- 4.2. PESTEL analysis
- 4.3. BCG Analysis
- 4.3.1. Stars (High Growth, High Market Share)
- 4.3.2. Cash Cows (Low Growth, High Market Share)
- 4.3.3. Question Mark (High Growth, Low Market Share)
- 4.3.4. Dogs (Low Growth, Low Market Share)
- 4.4. Ansoff Matrix Analysis
- 4.5. Supply Chain Analysis
- 4.6. Regulatory Landscape
- 4.7. Current Market Potential and Opportunity Assessment (TAM–SAM–SOM Framework)
- 4.8. NRP Analyst Note
- 4.1. Porters Five Forces
- 5. Market Analysis, Insights and Forecast 2021-2033
- 5.1. Market Analysis, Insights and Forecast - by Type
- 5.1.1. Alumina
- 5.1.2. Aluminum Nitride
- 5.1.3. Silicon Nitride
- 5.1.4. Beryllium Oxide
- 5.1.5. Others
- 5.2. Market Analysis, Insights and Forecast - by End-user Industry
- 5.2.1. Consumer Electronics
- 5.2.2. Aerospace & Defense
- 5.2.3. Automotive
- 5.2.4. Semiconductor
- 5.2.5. Telecommunication
- 5.2.6. Others
- 5.3. Market Analysis, Insights and Forecast - by Region
- 5.3.1. Asia Pacific
- 5.3.2. North America
- 5.3.3. Europe
- 5.3.4. South America
- 5.3.5. Middle East and Africa
- 5.1. Market Analysis, Insights and Forecast - by Type
- 6. Global Semiconductor Ceramics Market Analysis, Insights and Forecast, 2021-2033
- 6.1. Market Analysis, Insights and Forecast - by Type
- 6.1.1. Alumina
- 6.1.2. Aluminum Nitride
- 6.1.3. Silicon Nitride
- 6.1.4. Beryllium Oxide
- 6.1.5. Others
- 6.2. Market Analysis, Insights and Forecast - by End-user Industry
- 6.2.1. Consumer Electronics
- 6.2.2. Aerospace & Defense
- 6.2.3. Automotive
- 6.2.4. Semiconductor
- 6.2.5. Telecommunication
- 6.2.6. Others
- 6.1. Market Analysis, Insights and Forecast - by Type
- 7. Asia Pacific Semiconductor Ceramics Market Analysis, Insights and Forecast, 2020-2032
- 7.1. Market Analysis, Insights and Forecast - by Type
- 7.1.1. Alumina
- 7.1.2. Aluminum Nitride
- 7.1.3. Silicon Nitride
- 7.1.4. Beryllium Oxide
- 7.1.5. Others
- 7.2. Market Analysis, Insights and Forecast - by End-user Industry
- 7.2.1. Consumer Electronics
- 7.2.2. Aerospace & Defense
- 7.2.3. Automotive
- 7.2.4. Semiconductor
- 7.2.5. Telecommunication
- 7.2.6. Others
- 7.1. Market Analysis, Insights and Forecast - by Type
- 8. North America Semiconductor Ceramics Market Analysis, Insights and Forecast, 2020-2032
- 8.1. Market Analysis, Insights and Forecast - by Type
- 8.1.1. Alumina
- 8.1.2. Aluminum Nitride
- 8.1.3. Silicon Nitride
- 8.1.4. Beryllium Oxide
- 8.1.5. Others
- 8.2. Market Analysis, Insights and Forecast - by End-user Industry
- 8.2.1. Consumer Electronics
- 8.2.2. Aerospace & Defense
- 8.2.3. Automotive
- 8.2.4. Semiconductor
- 8.2.5. Telecommunication
- 8.2.6. Others
- 8.1. Market Analysis, Insights and Forecast - by Type
- 9. Europe Semiconductor Ceramics Market Analysis, Insights and Forecast, 2020-2032
- 9.1. Market Analysis, Insights and Forecast - by Type
- 9.1.1. Alumina
- 9.1.2. Aluminum Nitride
- 9.1.3. Silicon Nitride
- 9.1.4. Beryllium Oxide
- 9.1.5. Others
- 9.2. Market Analysis, Insights and Forecast - by End-user Industry
- 9.2.1. Consumer Electronics
- 9.2.2. Aerospace & Defense
- 9.2.3. Automotive
- 9.2.4. Semiconductor
- 9.2.5. Telecommunication
- 9.2.6. Others
- 9.1. Market Analysis, Insights and Forecast - by Type
- 10. South America Semiconductor Ceramics Market Analysis, Insights and Forecast, 2020-2032
- 10.1. Market Analysis, Insights and Forecast - by Type
- 10.1.1. Alumina
- 10.1.2. Aluminum Nitride
- 10.1.3. Silicon Nitride
- 10.1.4. Beryllium Oxide
- 10.1.5. Others
- 10.2. Market Analysis, Insights and Forecast - by End-user Industry
- 10.2.1. Consumer Electronics
- 10.2.2. Aerospace & Defense
- 10.2.3. Automotive
- 10.2.4. Semiconductor
- 10.2.5. Telecommunication
- 10.2.6. Others
- 10.1. Market Analysis, Insights and Forecast - by Type
- 11. Middle East and Africa Semiconductor Ceramics Market Analysis, Insights and Forecast, 2020-2032
- 11.1. Market Analysis, Insights and Forecast - by Type
- 11.1.1. Alumina
- 11.1.2. Aluminum Nitride
- 11.1.3. Silicon Nitride
- 11.1.4. Beryllium Oxide
- 11.1.5. Others
- 11.2. Market Analysis, Insights and Forecast - by End-user Industry
- 11.2.1. Consumer Electronics
- 11.2.2. Aerospace & Defense
- 11.2.3. Automotive
- 11.2.4. Semiconductor
- 11.2.5. Telecommunication
- 11.2.6. Others
- 11.1. Market Analysis, Insights and Forecast - by Type
- 12. Competitive Analysis
- 12.1. Company Profiles
- 12.1.1 CeramTec GmbH
- 12.1.1.1. Company Overview
- 12.1.1.2. Products
- 12.1.1.3. Company Financials
- 12.1.1.4. SWOT Analysis
- 12.1.2 CoorsTek Inc
- 12.1.2.1. Company Overview
- 12.1.2.2. Products
- 12.1.2.3. Company Financials
- 12.1.2.4. SWOT Analysis
- 12.1.3 Corning Incorporated
- 12.1.3.1. Company Overview
- 12.1.3.2. Products
- 12.1.3.3. Company Financials
- 12.1.3.4. SWOT Analysis
- 12.1.4 ICP TECHNOLOGY Co LTD
- 12.1.4.1. Company Overview
- 12.1.4.2. Products
- 12.1.4.3. Company Financials
- 12.1.4.4. SWOT Analysis
- 12.1.5 KOA Speer Electronics INC
- 12.1.5.1. Company Overview
- 12.1.5.2. Products
- 12.1.5.3. Company Financials
- 12.1.5.4. SWOT Analysis
- 12.1.6 KYOCERA Corporation
- 12.1.6.1. Company Overview
- 12.1.6.2. Products
- 12.1.6.3. Company Financials
- 12.1.6.4. SWOT Analysis
- 12.1.7 LEATEC Fine Ceramics Co Ltd
- 12.1.7.1. Company Overview
- 12.1.7.2. Products
- 12.1.7.3. Company Financials
- 12.1.7.4. SWOT Analysis
- 12.1.8 MARUWA Co Ltd
- 12.1.8.1. Company Overview
- 12.1.8.2. Products
- 12.1.8.3. Company Financials
- 12.1.8.4. SWOT Analysis
- 12.1.9 NEOTech
- 12.1.9.1. Company Overview
- 12.1.9.2. Products
- 12.1.9.3. Company Financials
- 12.1.9.4. SWOT Analysis
- 12.1.10 NIPPON CARBIDE INDUSTRIES CO INC
- 12.1.10.1. Company Overview
- 12.1.10.2. Products
- 12.1.10.3. Company Financials
- 12.1.10.4. SWOT Analysis
- 12.1.11 Niterra Co Ltd
- 12.1.11.1. Company Overview
- 12.1.11.2. Products
- 12.1.11.3. Company Financials
- 12.1.11.4. SWOT Analysis
- 12.1.12 Ortech Advanced Ceramics
- 12.1.12.1. Company Overview
- 12.1.12.2. Products
- 12.1.12.3. Company Financials
- 12.1.12.4. SWOT Analysis
- 12.1.13 Toshiba Materials Co Ltd
- 12.1.13.1. Company Overview
- 12.1.13.2. Products
- 12.1.13.3. Company Financials
- 12.1.13.4. SWOT Analysis
- 12.1.14 TTM Technologies Inc
- 12.1.14.1. Company Overview
- 12.1.14.2. Products
- 12.1.14.3. Company Financials
- 12.1.14.4. SWOT Analysis
- 12.1.15 Yokowo co ltd *List Not Exhaustive
- 12.1.15.1. Company Overview
- 12.1.15.2. Products
- 12.1.15.3. Company Financials
- 12.1.15.4. SWOT Analysis
- 12.1.1 CeramTec GmbH
- 12.2. Market Entropy
- 12.2.1 Company's Key Areas Served
- 12.2.2 Recent Developments
- 12.3. Company Market Share Analysis 2025
- 12.3.1 Top 5 Companies Market Share Analysis
- 12.3.2 Top 3 Companies Market Share Analysis
- 12.4. List of Potential Customers
- 13. Research Methodology
List of Figures
- Figure 1: Global Semiconductor Ceramics Market Revenue Breakdown (Million, %) by Region 2025 & 2033
- Figure 2: Global Semiconductor Ceramics Market Volume Breakdown (Billion, %) by Region 2025 & 2033
- Figure 3: Asia Pacific Semiconductor Ceramics Market Revenue (Million), by Type 2025 & 2033
- Figure 4: Asia Pacific Semiconductor Ceramics Market Volume (Billion), by Type 2025 & 2033
- Figure 5: Asia Pacific Semiconductor Ceramics Market Revenue Share (%), by Type 2025 & 2033
- Figure 6: Asia Pacific Semiconductor Ceramics Market Volume Share (%), by Type 2025 & 2033
- Figure 7: Asia Pacific Semiconductor Ceramics Market Revenue (Million), by End-user Industry 2025 & 2033
- Figure 8: Asia Pacific Semiconductor Ceramics Market Volume (Billion), by End-user Industry 2025 & 2033
- Figure 9: Asia Pacific Semiconductor Ceramics Market Revenue Share (%), by End-user Industry 2025 & 2033
- Figure 10: Asia Pacific Semiconductor Ceramics Market Volume Share (%), by End-user Industry 2025 & 2033
- Figure 11: Asia Pacific Semiconductor Ceramics Market Revenue (Million), by Country 2025 & 2033
- Figure 12: Asia Pacific Semiconductor Ceramics Market Volume (Billion), by Country 2025 & 2033
- Figure 13: Asia Pacific Semiconductor Ceramics Market Revenue Share (%), by Country 2025 & 2033
- Figure 14: Asia Pacific Semiconductor Ceramics Market Volume Share (%), by Country 2025 & 2033
- Figure 15: North America Semiconductor Ceramics Market Revenue (Million), by Type 2025 & 2033
- Figure 16: North America Semiconductor Ceramics Market Volume (Billion), by Type 2025 & 2033
- Figure 17: North America Semiconductor Ceramics Market Revenue Share (%), by Type 2025 & 2033
- Figure 18: North America Semiconductor Ceramics Market Volume Share (%), by Type 2025 & 2033
- Figure 19: North America Semiconductor Ceramics Market Revenue (Million), by End-user Industry 2025 & 2033
- Figure 20: North America Semiconductor Ceramics Market Volume (Billion), by End-user Industry 2025 & 2033
- Figure 21: North America Semiconductor Ceramics Market Revenue Share (%), by End-user Industry 2025 & 2033
- Figure 22: North America Semiconductor Ceramics Market Volume Share (%), by End-user Industry 2025 & 2033
- Figure 23: North America Semiconductor Ceramics Market Revenue (Million), by Country 2025 & 2033
- Figure 24: North America Semiconductor Ceramics Market Volume (Billion), by Country 2025 & 2033
- Figure 25: North America Semiconductor Ceramics Market Revenue Share (%), by Country 2025 & 2033
- Figure 26: North America Semiconductor Ceramics Market Volume Share (%), by Country 2025 & 2033
- Figure 27: Europe Semiconductor Ceramics Market Revenue (Million), by Type 2025 & 2033
- Figure 28: Europe Semiconductor Ceramics Market Volume (Billion), by Type 2025 & 2033
- Figure 29: Europe Semiconductor Ceramics Market Revenue Share (%), by Type 2025 & 2033
- Figure 30: Europe Semiconductor Ceramics Market Volume Share (%), by Type 2025 & 2033
- Figure 31: Europe Semiconductor Ceramics Market Revenue (Million), by End-user Industry 2025 & 2033
- Figure 32: Europe Semiconductor Ceramics Market Volume (Billion), by End-user Industry 2025 & 2033
- Figure 33: Europe Semiconductor Ceramics Market Revenue Share (%), by End-user Industry 2025 & 2033
- Figure 34: Europe Semiconductor Ceramics Market Volume Share (%), by End-user Industry 2025 & 2033
- Figure 35: Europe Semiconductor Ceramics Market Revenue (Million), by Country 2025 & 2033
- Figure 36: Europe Semiconductor Ceramics Market Volume (Billion), by Country 2025 & 2033
- Figure 37: Europe Semiconductor Ceramics Market Revenue Share (%), by Country 2025 & 2033
- Figure 38: Europe Semiconductor Ceramics Market Volume Share (%), by Country 2025 & 2033
- Figure 39: South America Semiconductor Ceramics Market Revenue (Million), by Type 2025 & 2033
- Figure 40: South America Semiconductor Ceramics Market Volume (Billion), by Type 2025 & 2033
- Figure 41: South America Semiconductor Ceramics Market Revenue Share (%), by Type 2025 & 2033
- Figure 42: South America Semiconductor Ceramics Market Volume Share (%), by Type 2025 & 2033
- Figure 43: South America Semiconductor Ceramics Market Revenue (Million), by End-user Industry 2025 & 2033
- Figure 44: South America Semiconductor Ceramics Market Volume (Billion), by End-user Industry 2025 & 2033
- Figure 45: South America Semiconductor Ceramics Market Revenue Share (%), by End-user Industry 2025 & 2033
- Figure 46: South America Semiconductor Ceramics Market Volume Share (%), by End-user Industry 2025 & 2033
- Figure 47: South America Semiconductor Ceramics Market Revenue (Million), by Country 2025 & 2033
- Figure 48: South America Semiconductor Ceramics Market Volume (Billion), by Country 2025 & 2033
- Figure 49: South America Semiconductor Ceramics Market Revenue Share (%), by Country 2025 & 2033
- Figure 50: South America Semiconductor Ceramics Market Volume Share (%), by Country 2025 & 2033
- Figure 51: Middle East and Africa Semiconductor Ceramics Market Revenue (Million), by Type 2025 & 2033
- Figure 52: Middle East and Africa Semiconductor Ceramics Market Volume (Billion), by Type 2025 & 2033
- Figure 53: Middle East and Africa Semiconductor Ceramics Market Revenue Share (%), by Type 2025 & 2033
- Figure 54: Middle East and Africa Semiconductor Ceramics Market Volume Share (%), by Type 2025 & 2033
- Figure 55: Middle East and Africa Semiconductor Ceramics Market Revenue (Million), by End-user Industry 2025 & 2033
- Figure 56: Middle East and Africa Semiconductor Ceramics Market Volume (Billion), by End-user Industry 2025 & 2033
- Figure 57: Middle East and Africa Semiconductor Ceramics Market Revenue Share (%), by End-user Industry 2025 & 2033
- Figure 58: Middle East and Africa Semiconductor Ceramics Market Volume Share (%), by End-user Industry 2025 & 2033
- Figure 59: Middle East and Africa Semiconductor Ceramics Market Revenue (Million), by Country 2025 & 2033
- Figure 60: Middle East and Africa Semiconductor Ceramics Market Volume (Billion), by Country 2025 & 2033
- Figure 61: Middle East and Africa Semiconductor Ceramics Market Revenue Share (%), by Country 2025 & 2033
- Figure 62: Middle East and Africa Semiconductor Ceramics Market Volume Share (%), by Country 2025 & 2033
List of Tables
- Table 1: Global Semiconductor Ceramics Market Revenue Million Forecast, by Type 2020 & 2033
- Table 2: Global Semiconductor Ceramics Market Volume Billion Forecast, by Type 2020 & 2033
- Table 3: Global Semiconductor Ceramics Market Revenue Million Forecast, by End-user Industry 2020 & 2033
- Table 4: Global Semiconductor Ceramics Market Volume Billion Forecast, by End-user Industry 2020 & 2033
- Table 5: Global Semiconductor Ceramics Market Revenue Million Forecast, by Region 2020 & 2033
- Table 6: Global Semiconductor Ceramics Market Volume Billion Forecast, by Region 2020 & 2033
- Table 7: Global Semiconductor Ceramics Market Revenue Million Forecast, by Type 2020 & 2033
- Table 8: Global Semiconductor Ceramics Market Volume Billion Forecast, by Type 2020 & 2033
- Table 9: Global Semiconductor Ceramics Market Revenue Million Forecast, by End-user Industry 2020 & 2033
- Table 10: Global Semiconductor Ceramics Market Volume Billion Forecast, by End-user Industry 2020 & 2033
- Table 11: Global Semiconductor Ceramics Market Revenue Million Forecast, by Country 2020 & 2033
- Table 12: Global Semiconductor Ceramics Market Volume Billion Forecast, by Country 2020 & 2033
- Table 13: China Semiconductor Ceramics Market Revenue (Million) Forecast, by Application 2020 & 2033
- Table 14: China Semiconductor Ceramics Market Volume (Billion) Forecast, by Application 2020 & 2033
- Table 15: India Semiconductor Ceramics Market Revenue (Million) Forecast, by Application 2020 & 2033
- Table 16: India Semiconductor Ceramics Market Volume (Billion) Forecast, by Application 2020 & 2033
- Table 17: Japan Semiconductor Ceramics Market Revenue (Million) Forecast, by Application 2020 & 2033
- Table 18: Japan Semiconductor Ceramics Market Volume (Billion) Forecast, by Application 2020 & 2033
- Table 19: South Korea Semiconductor Ceramics Market Revenue (Million) Forecast, by Application 2020 & 2033
- Table 20: South Korea Semiconductor Ceramics Market Volume (Billion) Forecast, by Application 2020 & 2033
- Table 21: Malaysia Semiconductor Ceramics Market Revenue (Million) Forecast, by Application 2020 & 2033
- Table 22: Malaysia Semiconductor Ceramics Market Volume (Billion) Forecast, by Application 2020 & 2033
- Table 23: Thailand Semiconductor Ceramics Market Revenue (Million) Forecast, by Application 2020 & 2033
- Table 24: Thailand Semiconductor Ceramics Market Volume (Billion) Forecast, by Application 2020 & 2033
- Table 25: Indonesia Semiconductor Ceramics Market Revenue (Million) Forecast, by Application 2020 & 2033
- Table 26: Indonesia Semiconductor Ceramics Market Volume (Billion) Forecast, by Application 2020 & 2033
- Table 27: Vietnam Semiconductor Ceramics Market Revenue (Million) Forecast, by Application 2020 & 2033
- Table 28: Vietnam Semiconductor Ceramics Market Volume (Billion) Forecast, by Application 2020 & 2033
- Table 29: Rest of Asia Pacific Semiconductor Ceramics Market Revenue (Million) Forecast, by Application 2020 & 2033
- Table 30: Rest of Asia Pacific Semiconductor Ceramics Market Volume (Billion) Forecast, by Application 2020 & 2033
- Table 31: Global Semiconductor Ceramics Market Revenue Million Forecast, by Type 2020 & 2033
- Table 32: Global Semiconductor Ceramics Market Volume Billion Forecast, by Type 2020 & 2033
- Table 33: Global Semiconductor Ceramics Market Revenue Million Forecast, by End-user Industry 2020 & 2033
- Table 34: Global Semiconductor Ceramics Market Volume Billion Forecast, by End-user Industry 2020 & 2033
- Table 35: Global Semiconductor Ceramics Market Revenue Million Forecast, by Country 2020 & 2033
- Table 36: Global Semiconductor Ceramics Market Volume Billion Forecast, by Country 2020 & 2033
- Table 37: United States Semiconductor Ceramics Market Revenue (Million) Forecast, by Application 2020 & 2033
- Table 38: United States Semiconductor Ceramics Market Volume (Billion) Forecast, by Application 2020 & 2033
- Table 39: Canada Semiconductor Ceramics Market Revenue (Million) Forecast, by Application 2020 & 2033
- Table 40: Canada Semiconductor Ceramics Market Volume (Billion) Forecast, by Application 2020 & 2033
- Table 41: Mexico Semiconductor Ceramics Market Revenue (Million) Forecast, by Application 2020 & 2033
- Table 42: Mexico Semiconductor Ceramics Market Volume (Billion) Forecast, by Application 2020 & 2033
- Table 43: Global Semiconductor Ceramics Market Revenue Million Forecast, by Type 2020 & 2033
- Table 44: Global Semiconductor Ceramics Market Volume Billion Forecast, by Type 2020 & 2033
- Table 45: Global Semiconductor Ceramics Market Revenue Million Forecast, by End-user Industry 2020 & 2033
- Table 46: Global Semiconductor Ceramics Market Volume Billion Forecast, by End-user Industry 2020 & 2033
- Table 47: Global Semiconductor Ceramics Market Revenue Million Forecast, by Country 2020 & 2033
- Table 48: Global Semiconductor Ceramics Market Volume Billion Forecast, by Country 2020 & 2033
- Table 49: Germany Semiconductor Ceramics Market Revenue (Million) Forecast, by Application 2020 & 2033
- Table 50: Germany Semiconductor Ceramics Market Volume (Billion) Forecast, by Application 2020 & 2033
- Table 51: United Kingdom Semiconductor Ceramics Market Revenue (Million) Forecast, by Application 2020 & 2033
- Table 52: United Kingdom Semiconductor Ceramics Market Volume (Billion) Forecast, by Application 2020 & 2033
- Table 53: France Semiconductor Ceramics Market Revenue (Million) Forecast, by Application 2020 & 2033
- Table 54: France Semiconductor Ceramics Market Volume (Billion) Forecast, by Application 2020 & 2033
- Table 55: Italy Semiconductor Ceramics Market Revenue (Million) Forecast, by Application 2020 & 2033
- Table 56: Italy Semiconductor Ceramics Market Volume (Billion) Forecast, by Application 2020 & 2033
- Table 57: Spain Semiconductor Ceramics Market Revenue (Million) Forecast, by Application 2020 & 2033
- Table 58: Spain Semiconductor Ceramics Market Volume (Billion) Forecast, by Application 2020 & 2033
- Table 59: Nordic Countries Semiconductor Ceramics Market Revenue (Million) Forecast, by Application 2020 & 2033
- Table 60: Nordic Countries Semiconductor Ceramics Market Volume (Billion) Forecast, by Application 2020 & 2033
- Table 61: Turkey Semiconductor Ceramics Market Revenue (Million) Forecast, by Application 2020 & 2033
- Table 62: Turkey Semiconductor Ceramics Market Volume (Billion) Forecast, by Application 2020 & 2033
- Table 63: Russia Semiconductor Ceramics Market Revenue (Million) Forecast, by Application 2020 & 2033
- Table 64: Russia Semiconductor Ceramics Market Volume (Billion) Forecast, by Application 2020 & 2033
- Table 65: Rest of Europe Semiconductor Ceramics Market Revenue (Million) Forecast, by Application 2020 & 2033
- Table 66: Rest of Europe Semiconductor Ceramics Market Volume (Billion) Forecast, by Application 2020 & 2033
- Table 67: Global Semiconductor Ceramics Market Revenue Million Forecast, by Type 2020 & 2033
- Table 68: Global Semiconductor Ceramics Market Volume Billion Forecast, by Type 2020 & 2033
- Table 69: Global Semiconductor Ceramics Market Revenue Million Forecast, by End-user Industry 2020 & 2033
- Table 70: Global Semiconductor Ceramics Market Volume Billion Forecast, by End-user Industry 2020 & 2033
- Table 71: Global Semiconductor Ceramics Market Revenue Million Forecast, by Country 2020 & 2033
- Table 72: Global Semiconductor Ceramics Market Volume Billion Forecast, by Country 2020 & 2033
- Table 73: Brazil Semiconductor Ceramics Market Revenue (Million) Forecast, by Application 2020 & 2033
- Table 74: Brazil Semiconductor Ceramics Market Volume (Billion) Forecast, by Application 2020 & 2033
- Table 75: Argentina Semiconductor Ceramics Market Revenue (Million) Forecast, by Application 2020 & 2033
- Table 76: Argentina Semiconductor Ceramics Market Volume (Billion) Forecast, by Application 2020 & 2033
- Table 77: Colombia Semiconductor Ceramics Market Revenue (Million) Forecast, by Application 2020 & 2033
- Table 78: Colombia Semiconductor Ceramics Market Volume (Billion) Forecast, by Application 2020 & 2033
- Table 79: Rest of South America Semiconductor Ceramics Market Revenue (Million) Forecast, by Application 2020 & 2033
- Table 80: Rest of South America Semiconductor Ceramics Market Volume (Billion) Forecast, by Application 2020 & 2033
- Table 81: Global Semiconductor Ceramics Market Revenue Million Forecast, by Type 2020 & 2033
- Table 82: Global Semiconductor Ceramics Market Volume Billion Forecast, by Type 2020 & 2033
- Table 83: Global Semiconductor Ceramics Market Revenue Million Forecast, by End-user Industry 2020 & 2033
- Table 84: Global Semiconductor Ceramics Market Volume Billion Forecast, by End-user Industry 2020 & 2033
- Table 85: Global Semiconductor Ceramics Market Revenue Million Forecast, by Country 2020 & 2033
- Table 86: Global Semiconductor Ceramics Market Volume Billion Forecast, by Country 2020 & 2033
- Table 87: Saudi Arabia Semiconductor Ceramics Market Revenue (Million) Forecast, by Application 2020 & 2033
- Table 88: Saudi Arabia Semiconductor Ceramics Market Volume (Billion) Forecast, by Application 2020 & 2033
- Table 89: Qatar Semiconductor Ceramics Market Revenue (Million) Forecast, by Application 2020 & 2033
- Table 90: Qatar Semiconductor Ceramics Market Volume (Billion) Forecast, by Application 2020 & 2033
- Table 91: United Arab Emirates Semiconductor Ceramics Market Revenue (Million) Forecast, by Application 2020 & 2033
- Table 92: United Arab Emirates Semiconductor Ceramics Market Volume (Billion) Forecast, by Application 2020 & 2033
- Table 93: Nigeria Semiconductor Ceramics Market Revenue (Million) Forecast, by Application 2020 & 2033
- Table 94: Nigeria Semiconductor Ceramics Market Volume (Billion) Forecast, by Application 2020 & 2033
- Table 95: Egypt Semiconductor Ceramics Market Revenue (Million) Forecast, by Application 2020 & 2033
- Table 96: Egypt Semiconductor Ceramics Market Volume (Billion) Forecast, by Application 2020 & 2033
- Table 97: South Africa Semiconductor Ceramics Market Revenue (Million) Forecast, by Application 2020 & 2033
- Table 98: South Africa Semiconductor Ceramics Market Volume (Billion) Forecast, by Application 2020 & 2033
- Table 99: Rest of Middle East and Africa Semiconductor Ceramics Market Revenue (Million) Forecast, by Application 2020 & 2033
- Table 100: Rest of Middle East and Africa Semiconductor Ceramics Market Volume (Billion) Forecast, by Application 2020 & 2033
Frequently Asked Questions
1. What is the projected Compound Annual Growth Rate (CAGR) of the Semiconductor Ceramics Market?
The projected CAGR is approximately 6.42%.
2. Which companies are prominent players in the Semiconductor Ceramics Market?
Key companies in the market include CeramTec GmbH, CoorsTek Inc, Corning Incorporated, ICP TECHNOLOGY Co LTD, KOA Speer Electronics INC, KYOCERA Corporation, LEATEC Fine Ceramics Co Ltd, MARUWA Co Ltd, NEOTech, NIPPON CARBIDE INDUSTRIES CO INC, Niterra Co Ltd, Ortech Advanced Ceramics, Toshiba Materials Co Ltd, TTM Technologies Inc, Yokowo co ltd *List Not Exhaustive.
3. What are the main segments of the Semiconductor Ceramics Market?
The market segments include Type, End-user Industry.
4. Can you provide details about the market size?
The market size is estimated to be USD 8.05 Million as of 2022.
5. What are some drivers contributing to market growth?
Increasing Demand for Ceramic Substrates Over Metal; Rise in the Adoption of Ceramic Substrates in Electronics Application; Other Drivers.
6. What are the notable trends driving market growth?
Rise in the Adoption of Ceramic Substrates in Electronics Application.
7. Are there any restraints impacting market growth?
Increasing Demand for Ceramic Substrates Over Metal; Rise in the Adoption of Ceramic Substrates in Electronics Application; Other Drivers.
8. Can you provide examples of recent developments in the market?
June 2024: CeramTec has unveiled Sinalit, a new ceramic substrate crafted from silicon nitride (Si3N4). Designed to bolster power electronic modules, Sinalit boasts impressive flexural strength, commendable thermal conductivity, and top-notch electrical insulation. These attributes position it perfectly for high-demand sectors like e-mobility and renewable energy. With the launch of Sinalit Si3N4, CeramTec is strategically responding to the surging demand for efficient and dependable power electronic modules across diverse industries.May 2023: CeramTec has unveiled Rubalit ZTA, a high-performance ceramic substrate boasting exceptional thermal conductivity, impressive flexural strength, and excellent electrical insulation properties. Zirconia Toughened Alumina (ZTA) finds applications in power generation and electromobility. With the launch of Rubalit ZTA, CeramTec seeks to meet these market demands and offer a competitive edge to its clientele.
9. What pricing options are available for accessing the report?
Pricing options include single-user, multi-user, and enterprise licenses priced at USD 4750, USD 5250, and USD 8750 respectively.
10. Is the market size provided in terms of value or volume?
The market size is provided in terms of value, measured in Million and volume, measured in Billion.
11. Are there any specific market keywords associated with the report?
Yes, the market keyword associated with the report is "Semiconductor Ceramics Market," which aids in identifying and referencing the specific market segment covered.
12. How do I determine which pricing option suits my needs best?
The pricing options vary based on user requirements and access needs. Individual users may opt for single-user licenses, while businesses requiring broader access may choose multi-user or enterprise licenses for cost-effective access to the report.
13. Are there any additional resources or data provided in the Semiconductor Ceramics Market report?
While the report offers comprehensive insights, it's advisable to review the specific contents or supplementary materials provided to ascertain if additional resources or data are available.
14. How can I stay updated on further developments or reports in the Semiconductor Ceramics Market?
To stay informed about further developments, trends, and reports in the Semiconductor Ceramics Market, consider subscribing to industry newsletters, following relevant companies and organizations, or regularly checking reputable industry news sources and publications.
Methodology
Step 1 - Identification of Relevant Samples Size from Population Database


Step 2 - Approaches for Defining Global Market Size (Value, Volume* & Price*)

Note*: In applicable scenarios
Step 3 - Data Sources
Primary Research
- Web Analytics
- Survey Reports
- Research Institute
- Latest Research Reports
- Opinion Leaders
Secondary Research
- Annual Reports
- White Paper
- Latest Press Release
- Industry Association
- Paid Database
- Investor Presentations

Step 4 - Data Triangulation
Involves using different sources of information in order to increase the validity of a study
These sources are likely to be stakeholders in a program - participants, other researchers, program staff, other community members, and so on.
Then we put all data in single framework & apply various statistical tools to find out the dynamic on the market.
During the analysis stage, feedback from the stakeholder groups would be compared to determine areas of agreement as well as areas of divergence