

Key Insights
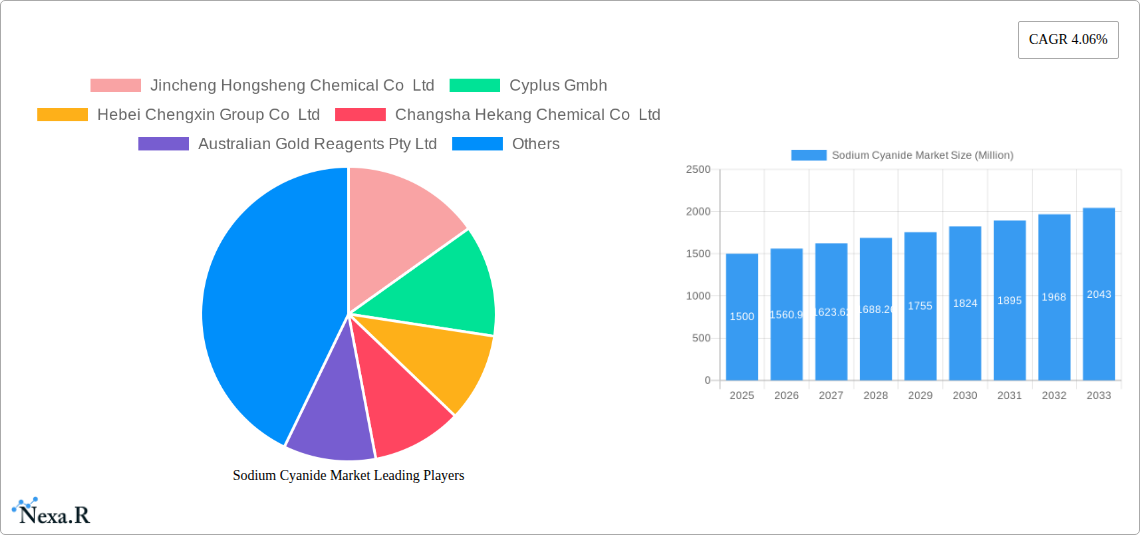
The global sodium cyanide market, valued at approximately 570 million in the base year 2024, is projected to expand at a Compound Annual Growth Rate (CAGR) of 3% from 2025 to 2033. This growth is primarily driven by increasing demand from the mining sector, particularly gold extraction, where sodium cyanide is an essential reagent. The chemical industry also significantly contributes to market demand, utilizing sodium cyanide in various synthesis processes. Emerging trends include the development of more efficient and environmentally friendly cyanide management techniques. However, stringent environmental regulations regarding cyanide handling and disposal represent a key restraint, necessitating the adoption of sustainable practices. The market is segmented by end-user industry, with mining currently holding the largest share, followed by the chemical sector. Key market participants include Jincheng Hongsheng Chemical Co Ltd, Cyplus GmbH, and Hebei Chengxin Group Co Ltd, alongside other international and regional entities. Competition centers on price, quality, and advancements in cyanide management technology. Geographically, the Asia-Pacific region, particularly China and India, are major demand drivers due to robust mining and chemical industries. North America and Europe also constitute significant market segments. Future market expansion will be influenced by technological innovations, the stringency of environmental regulations, and the overall health of the mining and chemical sectors.
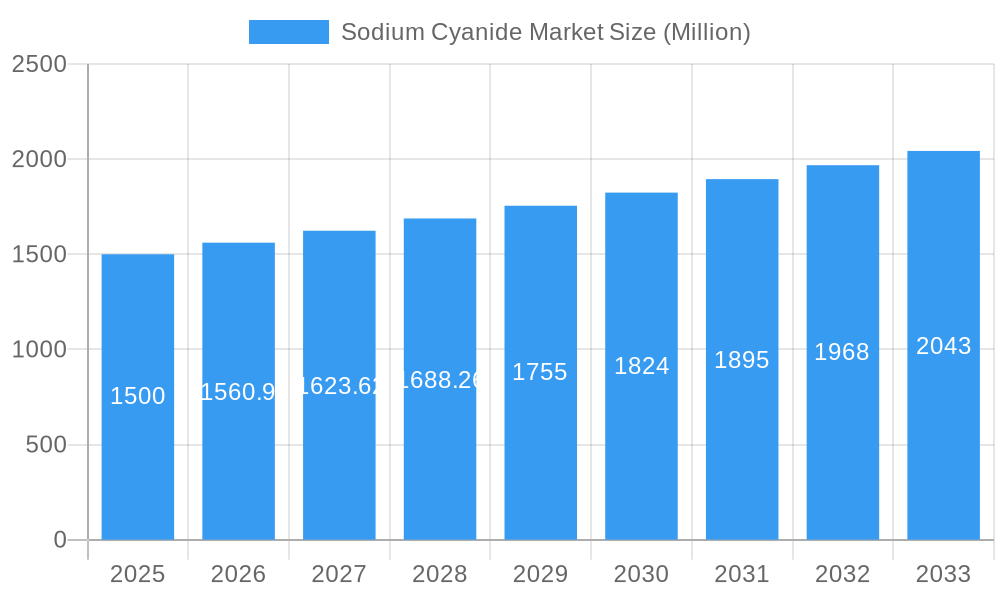
Sodium Cyanide Market Market Size (In Million)
The competitive landscape features a blend of large multinational corporations and smaller regional players. Strategic partnerships, mergers, and acquisitions are anticipated to increase as companies aim to broaden market reach and acquire new technologies. Furthermore, a strong emphasis on sustainable practices and responsible cyanide management will be crucial in shaping the market's future. The forecast period (2025-2033) presents opportunities for companies that effectively address environmental concerns while delivering cost-effective, high-quality sodium cyanide solutions. Sustained economic growth in key regions, coupled with increased investment in mining and chemical projects, is expected to fuel market growth. However, potential fluctuations in commodity prices and geopolitical factors may impact the market's trajectory.
Sodium Cyanide Market Company Market Share
Sodium Cyanide Market: A Comprehensive Market Research Report (2019-2033)
This in-depth report provides a comprehensive analysis of the global Sodium Cyanide market, encompassing market dynamics, growth trends, regional analysis, product landscape, key players, and future outlook. The study period covers 2019-2033, with 2025 as the base year and forecast period extending to 2033. This report is crucial for industry professionals, investors, and stakeholders seeking a nuanced understanding of this vital chemical market. The parent market is the chemical industry, while the child market specifically focuses on the mining and metal extraction sectors.
Market Size (Million Units): The global sodium cyanide market size was valued at xx Million in 2024 and is projected to reach xx Million by 2033, exhibiting a CAGR of xx% during the forecast period (2025-2033).
Sodium Cyanide Market Dynamics & Structure
The sodium cyanide market is characterized by moderate concentration, with several key players holding significant market share. Technological innovation, primarily focused on improving efficiency and safety, plays a crucial role. Stringent regulatory frameworks, particularly concerning environmental impact and worker safety, significantly influence market operations. Competitive substitutes, such as alternative leaching agents in mining, pose a challenge. End-user demographics heavily favor mining and metallurgical industries, while M&A activity remains relatively moderate.
- Market Concentration: The top 5 players account for approximately xx% of the market share in 2024.
- Technological Innovation: Focus is on reducing cyanide consumption and improving waste management.
- Regulatory Frameworks: Strict environmental regulations drive the adoption of safer handling and disposal methods.
- Competitive Substitutes: Alternative extraction methods and leaching agents present competition.
- M&A Trends: Consolidation is expected to increase, driven by the need for economies of scale and technological advancements. xx M&A deals were recorded between 2019-2024.
Sodium Cyanide Market Growth Trends & Insights
The sodium cyanide market's growth is primarily driven by the increasing demand from the mining industry, particularly gold extraction. Technological advancements in cyanide-based extraction processes, coupled with rising gold prices, have boosted market growth. However, stringent environmental regulations and concerns regarding cyanide's toxicity pose significant challenges. Adoption rates vary geographically, with regions having robust mining sectors demonstrating higher demand. Consumer behavior, primarily driven by environmental awareness, is increasingly influencing the adoption of eco-friendly alternatives. The market is projected to witness a steady growth trajectory during the forecast period, with the CAGR driven by continued growth in the mining and metal extraction sectors.
Dominant Regions, Countries, or Segments in Sodium Cyanide Market
The mining segment is the dominant end-user industry, driving market growth. Geographically, regions with significant gold mining activities, such as xx, xx, and xx, are leading the market.
- Key Drivers:
- Expansion of mining operations, particularly gold mining.
- Rising gold prices globally.
- Government incentives for mining activities in certain regions.
- Dominance Factors:
- High gold reserves and active mining operations.
- Favorable government policies and infrastructure.
- Established supply chains and industry expertise.
Sodium Cyanide Market Product Landscape
Sodium cyanide is primarily available in powder and granular forms. Recent innovations have focused on developing safer formulations and enhancing efficiency. The product's primary applications are in gold extraction, electroplating, and chemical synthesis. Performance metrics mainly focus on purity, efficiency in extraction, and environmental impact. Unique selling propositions are primarily linked to cost-effectiveness, safety, and environmental responsibility.
Key Drivers, Barriers & Challenges in Sodium Cyanide Market
Key Drivers: The growing gold mining industry, coupled with the increasing demand for gold jewelry and electronics, forms the primary driver. Technological advancements that enhance extraction efficiency and reduce environmental impact contribute to market growth. Government initiatives to boost mining activity in certain regions further propel market expansion.
Key Challenges: Strict environmental regulations concerning the handling and disposal of cyanide create significant barriers. The toxicity of cyanide poses safety and environmental risks, prompting increased scrutiny. The rising cost of raw materials and fluctuating gold prices impact market profitability and stability. Furthermore, the emergence of alternative extraction methods presents ongoing competitive pressures.
Emerging Opportunities in Sodium Cyanide Market
Emerging opportunities lie in developing safer and more environmentally friendly cyanide formulations. Expanding into new applications within the chemical and manufacturing industries presents untapped potential. Focus on sustainable and responsible mining practices, including enhanced waste management and reclamation, presents a key opportunity for market growth.
Growth Accelerators in the Sodium Cyanide Market Industry
Technological breakthroughs in cyanide handling and disposal technologies, coupled with innovations focused on reduced toxicity, are crucial growth catalysts. Strategic partnerships between mining companies and chemical suppliers facilitate the development of efficient and sustainable solutions. Market expansion into regions with substantial mining potential and supportive regulatory environments will further propel market growth.
Key Players Shaping the Sodium Cyanide Market Market
- Jincheng Hongsheng Chemical Co Ltd
- Cyplus Gmbh
- Hebei Chengxin Group Co Ltd
- Changsha Hekang Chemical Co Ltd
- Australian Gold Reagents Pty Ltd
- Draslovka
- Ynnovate Sanzheng (Yingkou) Fine Chemicals Co Ltd
- Cyanco International LLC
- Tongsuh Petrochemical Corp Ltd (Asahi Kasei Corporation)
- Unigel
- Orica Limited
- Anhui Shuguang Chemical Group
- Taekwang Industrial Co Ltd
Notable Milestones in Sodium Cyanide Market Sector
- 2020: Introduction of a new, less toxic cyanide formulation by [Company Name].
- 2022: [Company Name] and [Company Name] announced a joint venture focusing on sustainable cyanide production.
- 2023: Implementation of stricter environmental regulations regarding cyanide disposal in [Region].
In-Depth Sodium Cyanide Market Market Outlook
The future of the sodium cyanide market is strongly linked to the gold mining industry's growth trajectory. Continued technological advancements will be pivotal in mitigating environmental concerns and ensuring safer handling practices. Strategic partnerships and investments in sustainable cyanide management will determine long-term market success. The focus on responsible sourcing and eco-friendly alternatives will shape the market's future landscape.
Sodium Cyanide Market Segmentation
-
1. End-user Industry
- 1.1. Mining
- 1.2. Chemical
- 1.3. Other End-user Industries
Sodium Cyanide Market Segmentation By Geography
-
1. Asia Pacific
- 1.1. China
- 1.2. Australia
-
2. Indonesia
- 2.1. Rest of Asia Pacific
-
3. North America
- 3.1. United States
- 3.2. Canada
- 3.3. Mexico
-
4. Europe
- 4.1. Russia
- 4.2. CIS Countries
- 5. Rest of Europe
-
6. South America
- 6.1. Brazil
- 6.2. Argentina
- 6.3. Peru
- 6.4. Rest of South America
-
7. Middle East and Africa
- 7.1. Ghana
- 7.2. Sudan
- 7.3. South Africa
- 7.4. Rest of Middle East and Africa
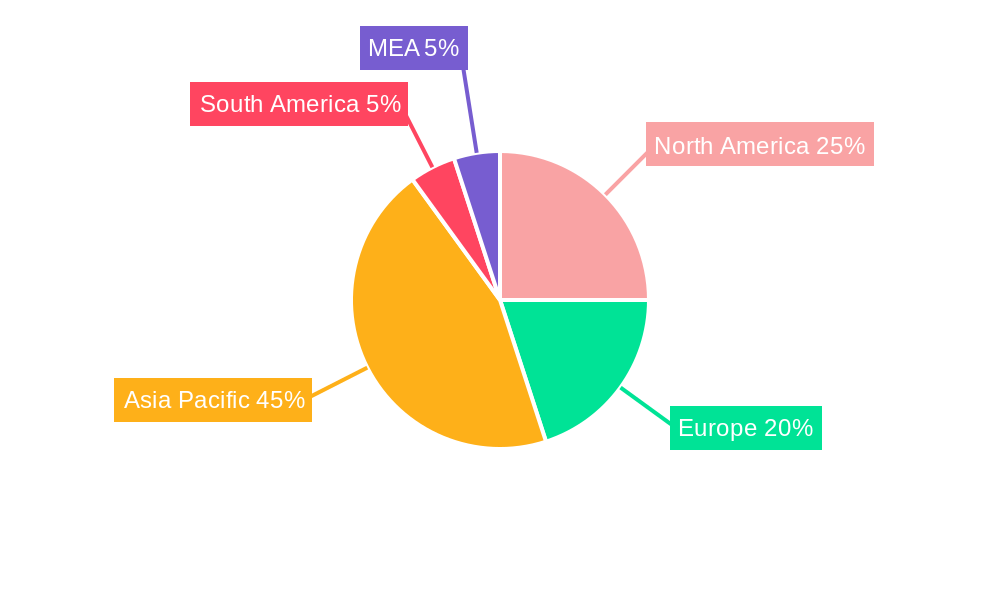
Sodium Cyanide Market Regional Market Share
Geographic Coverage of Sodium Cyanide Market
Sodium Cyanide Market REPORT HIGHLIGHTS
| Aspects | Details |
|---|---|
| Study Period | 2020-2034 |
| Base Year | 2025 |
| Estimated Year | 2026 |
| Forecast Period | 2026-2034 |
| Historical Period | 2020-2025 |
| Growth Rate | CAGR of 3% from 2020-2034 |
| Segmentation |
|
Table of Contents
- 1. Introduction
- 1.1. Research Scope
- 1.2. Market Segmentation
- 1.3. Research Objective
- 1.4. Definitions and Assumptions
- 2. Executive Summary
- 2.1. Market Snapshot
- 3. Market Dynamics
- 3.1. Market Drivers
- 3.2. Market Restrains
- 3.3. Market Trends
- 3.4. Market Opportunities
- 4. Market Factor Analysis
- 4.1. Porters Five Forces
- 4.1.1. Bargaining Power of Suppliers
- 4.1.2. Bargaining Power of Buyers
- 4.1.3. Threat of New Entrants
- 4.1.4. Threat of Substitutes
- 4.1.5. Competitive Rivalry
- 4.2. PESTEL analysis
- 4.3. BCG Analysis
- 4.3.1. Stars (High Growth, High Market Share)
- 4.3.2. Cash Cows (Low Growth, High Market Share)
- 4.3.3. Question Mark (High Growth, Low Market Share)
- 4.3.4. Dogs (Low Growth, Low Market Share)
- 4.4. Ansoff Matrix Analysis
- 4.5. Supply Chain Analysis
- 4.6. Regulatory Landscape
- 4.7. Current Market Potential and Opportunity Assessment (TAM–SAM–SOM Framework)
- 4.8. NRP Analyst Note
- 4.1. Porters Five Forces
- 5. Market Analysis, Insights and Forecast 2021-2033
- 5.1. Market Analysis, Insights and Forecast - by End-user Industry
- 5.1.1. Mining
- 5.1.2. Chemical
- 5.1.3. Other End-user Industries
- 5.2. Market Analysis, Insights and Forecast - by Region
- 5.2.1. Asia Pacific
- 5.2.2. Indonesia
- 5.2.3. North America
- 5.2.4. Europe
- 5.2.5. Rest of Europe
- 5.2.6. South America
- 5.2.7. Middle East and Africa
- 5.1. Market Analysis, Insights and Forecast - by End-user Industry
- 6. Global Sodium Cyanide Market Analysis, Insights and Forecast, 2021-2033
- 6.1. Market Analysis, Insights and Forecast - by End-user Industry
- 6.1.1. Mining
- 6.1.2. Chemical
- 6.1.3. Other End-user Industries
- 6.1. Market Analysis, Insights and Forecast - by End-user Industry
- 7. Asia Pacific Sodium Cyanide Market Analysis, Insights and Forecast, 2020-2032
- 7.1. Market Analysis, Insights and Forecast - by End-user Industry
- 7.1.1. Mining
- 7.1.2. Chemical
- 7.1.3. Other End-user Industries
- 7.1. Market Analysis, Insights and Forecast - by End-user Industry
- 8. Indonesia Sodium Cyanide Market Analysis, Insights and Forecast, 2020-2032
- 8.1. Market Analysis, Insights and Forecast - by End-user Industry
- 8.1.1. Mining
- 8.1.2. Chemical
- 8.1.3. Other End-user Industries
- 8.1. Market Analysis, Insights and Forecast - by End-user Industry
- 9. North America Sodium Cyanide Market Analysis, Insights and Forecast, 2020-2032
- 9.1. Market Analysis, Insights and Forecast - by End-user Industry
- 9.1.1. Mining
- 9.1.2. Chemical
- 9.1.3. Other End-user Industries
- 9.1. Market Analysis, Insights and Forecast - by End-user Industry
- 10. Europe Sodium Cyanide Market Analysis, Insights and Forecast, 2020-2032
- 10.1. Market Analysis, Insights and Forecast - by End-user Industry
- 10.1.1. Mining
- 10.1.2. Chemical
- 10.1.3. Other End-user Industries
- 10.1. Market Analysis, Insights and Forecast - by End-user Industry
- 11. Rest of Europe Sodium Cyanide Market Analysis, Insights and Forecast, 2020-2032
- 11.1. Market Analysis, Insights and Forecast - by End-user Industry
- 11.1.1. Mining
- 11.1.2. Chemical
- 11.1.3. Other End-user Industries
- 11.1. Market Analysis, Insights and Forecast - by End-user Industry
- 12. South America Sodium Cyanide Market Analysis, Insights and Forecast, 2020-2032
- 12.1. Market Analysis, Insights and Forecast - by End-user Industry
- 12.1.1. Mining
- 12.1.2. Chemical
- 12.1.3. Other End-user Industries
- 12.1. Market Analysis, Insights and Forecast - by End-user Industry
- 13. Middle East and Africa Sodium Cyanide Market Analysis, Insights and Forecast, 2020-2032
- 13.1. Market Analysis, Insights and Forecast - by End-user Industry
- 13.1.1. Mining
- 13.1.2. Chemical
- 13.1.3. Other End-user Industries
- 13.1. Market Analysis, Insights and Forecast - by End-user Industry
- 14. Competitive Analysis
- 14.1. Company Profiles
- 14.1.1 Jincheng Hongsheng Chemical Co Ltd
- 14.1.1.1. Company Overview
- 14.1.1.2. Products
- 14.1.1.3. Company Financials
- 14.1.1.4. SWOT Analysis
- 14.1.2 Cyplus Gmbh
- 14.1.2.1. Company Overview
- 14.1.2.2. Products
- 14.1.2.3. Company Financials
- 14.1.2.4. SWOT Analysis
- 14.1.3 Hebei Chengxin Group Co Ltd
- 14.1.3.1. Company Overview
- 14.1.3.2. Products
- 14.1.3.3. Company Financials
- 14.1.3.4. SWOT Analysis
- 14.1.4 Changsha Hekang Chemical Co Ltd
- 14.1.4.1. Company Overview
- 14.1.4.2. Products
- 14.1.4.3. Company Financials
- 14.1.4.4. SWOT Analysis
- 14.1.5 Australian Gold Reagents Pty Ltd
- 14.1.5.1. Company Overview
- 14.1.5.2. Products
- 14.1.5.3. Company Financials
- 14.1.5.4. SWOT Analysis
- 14.1.6 Draslovka
- 14.1.6.1. Company Overview
- 14.1.6.2. Products
- 14.1.6.3. Company Financials
- 14.1.6.4. SWOT Analysis
- 14.1.7 Ynnovate Sanzheng (Yingkou) Fine Chemicals Co Ltd*List Not Exhaustive
- 14.1.7.1. Company Overview
- 14.1.7.2. Products
- 14.1.7.3. Company Financials
- 14.1.7.4. SWOT Analysis
- 14.1.8 Cyanco International LLC
- 14.1.8.1. Company Overview
- 14.1.8.2. Products
- 14.1.8.3. Company Financials
- 14.1.8.4. SWOT Analysis
- 14.1.9 Tongsuh Petrochemical Corp Ltd (Asahi Kasei Corporation)
- 14.1.9.1. Company Overview
- 14.1.9.2. Products
- 14.1.9.3. Company Financials
- 14.1.9.4. SWOT Analysis
- 14.1.10 Unigel
- 14.1.10.1. Company Overview
- 14.1.10.2. Products
- 14.1.10.3. Company Financials
- 14.1.10.4. SWOT Analysis
- 14.1.11 Orica Limited
- 14.1.11.1. Company Overview
- 14.1.11.2. Products
- 14.1.11.3. Company Financials
- 14.1.11.4. SWOT Analysis
- 14.1.12 Anhui Shuguang Chemical Group
- 14.1.12.1. Company Overview
- 14.1.12.2. Products
- 14.1.12.3. Company Financials
- 14.1.12.4. SWOT Analysis
- 14.1.13 Taekwang Industrial Co Ltd
- 14.1.13.1. Company Overview
- 14.1.13.2. Products
- 14.1.13.3. Company Financials
- 14.1.13.4. SWOT Analysis
- 14.1.1 Jincheng Hongsheng Chemical Co Ltd
- 14.2. Market Entropy
- 14.2.1 Company's Key Areas Served
- 14.2.2 Recent Developments
- 14.3. Company Market Share Analysis 2025
- 14.3.1 Top 5 Companies Market Share Analysis
- 14.3.2 Top 3 Companies Market Share Analysis
- 14.4. List of Potential Customers
- 15. Research Methodology
List of Figures
- Figure 1: Global Sodium Cyanide Market Revenue Breakdown (million, %) by Region 2025 & 2033
- Figure 2: Global Sodium Cyanide Market Volume Breakdown (Million, %) by Region 2025 & 2033
- Figure 3: Asia Pacific Sodium Cyanide Market Revenue (million), by End-user Industry 2025 & 2033
- Figure 4: Asia Pacific Sodium Cyanide Market Volume (Million), by End-user Industry 2025 & 2033
- Figure 5: Asia Pacific Sodium Cyanide Market Revenue Share (%), by End-user Industry 2025 & 2033
- Figure 6: Asia Pacific Sodium Cyanide Market Volume Share (%), by End-user Industry 2025 & 2033
- Figure 7: Asia Pacific Sodium Cyanide Market Revenue (million), by Country 2025 & 2033
- Figure 8: Asia Pacific Sodium Cyanide Market Volume (Million), by Country 2025 & 2033
- Figure 9: Asia Pacific Sodium Cyanide Market Revenue Share (%), by Country 2025 & 2033
- Figure 10: Asia Pacific Sodium Cyanide Market Volume Share (%), by Country 2025 & 2033
- Figure 11: Indonesia Sodium Cyanide Market Revenue (million), by End-user Industry 2025 & 2033
- Figure 12: Indonesia Sodium Cyanide Market Volume (Million), by End-user Industry 2025 & 2033
- Figure 13: Indonesia Sodium Cyanide Market Revenue Share (%), by End-user Industry 2025 & 2033
- Figure 14: Indonesia Sodium Cyanide Market Volume Share (%), by End-user Industry 2025 & 2033
- Figure 15: Indonesia Sodium Cyanide Market Revenue (million), by Country 2025 & 2033
- Figure 16: Indonesia Sodium Cyanide Market Volume (Million), by Country 2025 & 2033
- Figure 17: Indonesia Sodium Cyanide Market Revenue Share (%), by Country 2025 & 2033
- Figure 18: Indonesia Sodium Cyanide Market Volume Share (%), by Country 2025 & 2033
- Figure 19: North America Sodium Cyanide Market Revenue (million), by End-user Industry 2025 & 2033
- Figure 20: North America Sodium Cyanide Market Volume (Million), by End-user Industry 2025 & 2033
- Figure 21: North America Sodium Cyanide Market Revenue Share (%), by End-user Industry 2025 & 2033
- Figure 22: North America Sodium Cyanide Market Volume Share (%), by End-user Industry 2025 & 2033
- Figure 23: North America Sodium Cyanide Market Revenue (million), by Country 2025 & 2033
- Figure 24: North America Sodium Cyanide Market Volume (Million), by Country 2025 & 2033
- Figure 25: North America Sodium Cyanide Market Revenue Share (%), by Country 2025 & 2033
- Figure 26: North America Sodium Cyanide Market Volume Share (%), by Country 2025 & 2033
- Figure 27: Europe Sodium Cyanide Market Revenue (million), by End-user Industry 2025 & 2033
- Figure 28: Europe Sodium Cyanide Market Volume (Million), by End-user Industry 2025 & 2033
- Figure 29: Europe Sodium Cyanide Market Revenue Share (%), by End-user Industry 2025 & 2033
- Figure 30: Europe Sodium Cyanide Market Volume Share (%), by End-user Industry 2025 & 2033
- Figure 31: Europe Sodium Cyanide Market Revenue (million), by Country 2025 & 2033
- Figure 32: Europe Sodium Cyanide Market Volume (Million), by Country 2025 & 2033
- Figure 33: Europe Sodium Cyanide Market Revenue Share (%), by Country 2025 & 2033
- Figure 34: Europe Sodium Cyanide Market Volume Share (%), by Country 2025 & 2033
- Figure 35: Rest of Europe Sodium Cyanide Market Revenue (million), by End-user Industry 2025 & 2033
- Figure 36: Rest of Europe Sodium Cyanide Market Volume (Million), by End-user Industry 2025 & 2033
- Figure 37: Rest of Europe Sodium Cyanide Market Revenue Share (%), by End-user Industry 2025 & 2033
- Figure 38: Rest of Europe Sodium Cyanide Market Volume Share (%), by End-user Industry 2025 & 2033
- Figure 39: Rest of Europe Sodium Cyanide Market Revenue (million), by Country 2025 & 2033
- Figure 40: Rest of Europe Sodium Cyanide Market Volume (Million), by Country 2025 & 2033
- Figure 41: Rest of Europe Sodium Cyanide Market Revenue Share (%), by Country 2025 & 2033
- Figure 42: Rest of Europe Sodium Cyanide Market Volume Share (%), by Country 2025 & 2033
- Figure 43: South America Sodium Cyanide Market Revenue (million), by End-user Industry 2025 & 2033
- Figure 44: South America Sodium Cyanide Market Volume (Million), by End-user Industry 2025 & 2033
- Figure 45: South America Sodium Cyanide Market Revenue Share (%), by End-user Industry 2025 & 2033
- Figure 46: South America Sodium Cyanide Market Volume Share (%), by End-user Industry 2025 & 2033
- Figure 47: South America Sodium Cyanide Market Revenue (million), by Country 2025 & 2033
- Figure 48: South America Sodium Cyanide Market Volume (Million), by Country 2025 & 2033
- Figure 49: South America Sodium Cyanide Market Revenue Share (%), by Country 2025 & 2033
- Figure 50: South America Sodium Cyanide Market Volume Share (%), by Country 2025 & 2033
- Figure 51: Middle East and Africa Sodium Cyanide Market Revenue (million), by End-user Industry 2025 & 2033
- Figure 52: Middle East and Africa Sodium Cyanide Market Volume (Million), by End-user Industry 2025 & 2033
- Figure 53: Middle East and Africa Sodium Cyanide Market Revenue Share (%), by End-user Industry 2025 & 2033
- Figure 54: Middle East and Africa Sodium Cyanide Market Volume Share (%), by End-user Industry 2025 & 2033
- Figure 55: Middle East and Africa Sodium Cyanide Market Revenue (million), by Country 2025 & 2033
- Figure 56: Middle East and Africa Sodium Cyanide Market Volume (Million), by Country 2025 & 2033
- Figure 57: Middle East and Africa Sodium Cyanide Market Revenue Share (%), by Country 2025 & 2033
- Figure 58: Middle East and Africa Sodium Cyanide Market Volume Share (%), by Country 2025 & 2033
List of Tables
- Table 1: Global Sodium Cyanide Market Revenue million Forecast, by End-user Industry 2020 & 2033
- Table 2: Global Sodium Cyanide Market Volume Million Forecast, by End-user Industry 2020 & 2033
- Table 3: Global Sodium Cyanide Market Revenue million Forecast, by Region 2020 & 2033
- Table 4: Global Sodium Cyanide Market Volume Million Forecast, by Region 2020 & 2033
- Table 5: Global Sodium Cyanide Market Revenue million Forecast, by End-user Industry 2020 & 2033
- Table 6: Global Sodium Cyanide Market Volume Million Forecast, by End-user Industry 2020 & 2033
- Table 7: Global Sodium Cyanide Market Revenue million Forecast, by Country 2020 & 2033
- Table 8: Global Sodium Cyanide Market Volume Million Forecast, by Country 2020 & 2033
- Table 9: China Sodium Cyanide Market Revenue (million) Forecast, by Application 2020 & 2033
- Table 10: China Sodium Cyanide Market Volume (Million) Forecast, by Application 2020 & 2033
- Table 11: Australia Sodium Cyanide Market Revenue (million) Forecast, by Application 2020 & 2033
- Table 12: Australia Sodium Cyanide Market Volume (Million) Forecast, by Application 2020 & 2033
- Table 13: Global Sodium Cyanide Market Revenue million Forecast, by End-user Industry 2020 & 2033
- Table 14: Global Sodium Cyanide Market Volume Million Forecast, by End-user Industry 2020 & 2033
- Table 15: Global Sodium Cyanide Market Revenue million Forecast, by Country 2020 & 2033
- Table 16: Global Sodium Cyanide Market Volume Million Forecast, by Country 2020 & 2033
- Table 17: Rest of Asia Pacific Sodium Cyanide Market Revenue (million) Forecast, by Application 2020 & 2033
- Table 18: Rest of Asia Pacific Sodium Cyanide Market Volume (Million) Forecast, by Application 2020 & 2033
- Table 19: Global Sodium Cyanide Market Revenue million Forecast, by End-user Industry 2020 & 2033
- Table 20: Global Sodium Cyanide Market Volume Million Forecast, by End-user Industry 2020 & 2033
- Table 21: Global Sodium Cyanide Market Revenue million Forecast, by Country 2020 & 2033
- Table 22: Global Sodium Cyanide Market Volume Million Forecast, by Country 2020 & 2033
- Table 23: United States Sodium Cyanide Market Revenue (million) Forecast, by Application 2020 & 2033
- Table 24: United States Sodium Cyanide Market Volume (Million) Forecast, by Application 2020 & 2033
- Table 25: Canada Sodium Cyanide Market Revenue (million) Forecast, by Application 2020 & 2033
- Table 26: Canada Sodium Cyanide Market Volume (Million) Forecast, by Application 2020 & 2033
- Table 27: Mexico Sodium Cyanide Market Revenue (million) Forecast, by Application 2020 & 2033
- Table 28: Mexico Sodium Cyanide Market Volume (Million) Forecast, by Application 2020 & 2033
- Table 29: Global Sodium Cyanide Market Revenue million Forecast, by End-user Industry 2020 & 2033
- Table 30: Global Sodium Cyanide Market Volume Million Forecast, by End-user Industry 2020 & 2033
- Table 31: Global Sodium Cyanide Market Revenue million Forecast, by Country 2020 & 2033
- Table 32: Global Sodium Cyanide Market Volume Million Forecast, by Country 2020 & 2033
- Table 33: Russia Sodium Cyanide Market Revenue (million) Forecast, by Application 2020 & 2033
- Table 34: Russia Sodium Cyanide Market Volume (Million) Forecast, by Application 2020 & 2033
- Table 35: CIS Countries Sodium Cyanide Market Revenue (million) Forecast, by Application 2020 & 2033
- Table 36: CIS Countries Sodium Cyanide Market Volume (Million) Forecast, by Application 2020 & 2033
- Table 37: Global Sodium Cyanide Market Revenue million Forecast, by End-user Industry 2020 & 2033
- Table 38: Global Sodium Cyanide Market Volume Million Forecast, by End-user Industry 2020 & 2033
- Table 39: Global Sodium Cyanide Market Revenue million Forecast, by Country 2020 & 2033
- Table 40: Global Sodium Cyanide Market Volume Million Forecast, by Country 2020 & 2033
- Table 41: Global Sodium Cyanide Market Revenue million Forecast, by End-user Industry 2020 & 2033
- Table 42: Global Sodium Cyanide Market Volume Million Forecast, by End-user Industry 2020 & 2033
- Table 43: Global Sodium Cyanide Market Revenue million Forecast, by Country 2020 & 2033
- Table 44: Global Sodium Cyanide Market Volume Million Forecast, by Country 2020 & 2033
- Table 45: Brazil Sodium Cyanide Market Revenue (million) Forecast, by Application 2020 & 2033
- Table 46: Brazil Sodium Cyanide Market Volume (Million) Forecast, by Application 2020 & 2033
- Table 47: Argentina Sodium Cyanide Market Revenue (million) Forecast, by Application 2020 & 2033
- Table 48: Argentina Sodium Cyanide Market Volume (Million) Forecast, by Application 2020 & 2033
- Table 49: Peru Sodium Cyanide Market Revenue (million) Forecast, by Application 2020 & 2033
- Table 50: Peru Sodium Cyanide Market Volume (Million) Forecast, by Application 2020 & 2033
- Table 51: Rest of South America Sodium Cyanide Market Revenue (million) Forecast, by Application 2020 & 2033
- Table 52: Rest of South America Sodium Cyanide Market Volume (Million) Forecast, by Application 2020 & 2033
- Table 53: Global Sodium Cyanide Market Revenue million Forecast, by End-user Industry 2020 & 2033
- Table 54: Global Sodium Cyanide Market Volume Million Forecast, by End-user Industry 2020 & 2033
- Table 55: Global Sodium Cyanide Market Revenue million Forecast, by Country 2020 & 2033
- Table 56: Global Sodium Cyanide Market Volume Million Forecast, by Country 2020 & 2033
- Table 57: Ghana Sodium Cyanide Market Revenue (million) Forecast, by Application 2020 & 2033
- Table 58: Ghana Sodium Cyanide Market Volume (Million) Forecast, by Application 2020 & 2033
- Table 59: Sudan Sodium Cyanide Market Revenue (million) Forecast, by Application 2020 & 2033
- Table 60: Sudan Sodium Cyanide Market Volume (Million) Forecast, by Application 2020 & 2033
- Table 61: South Africa Sodium Cyanide Market Revenue (million) Forecast, by Application 2020 & 2033
- Table 62: South Africa Sodium Cyanide Market Volume (Million) Forecast, by Application 2020 & 2033
- Table 63: Rest of Middle East and Africa Sodium Cyanide Market Revenue (million) Forecast, by Application 2020 & 2033
- Table 64: Rest of Middle East and Africa Sodium Cyanide Market Volume (Million) Forecast, by Application 2020 & 2033
Frequently Asked Questions
1. What is the projected Compound Annual Growth Rate (CAGR) of the Sodium Cyanide Market?
The projected CAGR is approximately 3%.
2. Which companies are prominent players in the Sodium Cyanide Market?
Key companies in the market include Jincheng Hongsheng Chemical Co Ltd, Cyplus Gmbh, Hebei Chengxin Group Co Ltd, Changsha Hekang Chemical Co Ltd, Australian Gold Reagents Pty Ltd, Draslovka, Ynnovate Sanzheng (Yingkou) Fine Chemicals Co Ltd*List Not Exhaustive, Cyanco International LLC, Tongsuh Petrochemical Corp Ltd (Asahi Kasei Corporation), Unigel, Orica Limited, Anhui Shuguang Chemical Group, Taekwang Industrial Co Ltd.
3. What are the main segments of the Sodium Cyanide Market?
The market segments include End-user Industry.
4. Can you provide details about the market size?
The market size is estimated to be USD 570 million as of 2022.
5. What are some drivers contributing to market growth?
High Demand from the Gold Mining Industry; Increasing Mining Activities in Canada and Mexico; Other Drivers.
6. What are the notable trends driving market growth?
Mining Segment to Dominate the Market Demand.
7. Are there any restraints impacting market growth?
Toxicity of Sodium Cyanide; Development of Substitute for Gold Extraction.
8. Can you provide examples of recent developments in the market?
N/A
9. What pricing options are available for accessing the report?
Pricing options include single-user, multi-user, and enterprise licenses priced at USD 4750, USD 5250, and USD 8750 respectively.
10. Is the market size provided in terms of value or volume?
The market size is provided in terms of value, measured in million and volume, measured in Million.
11. Are there any specific market keywords associated with the report?
Yes, the market keyword associated with the report is "Sodium Cyanide Market," which aids in identifying and referencing the specific market segment covered.
12. How do I determine which pricing option suits my needs best?
The pricing options vary based on user requirements and access needs. Individual users may opt for single-user licenses, while businesses requiring broader access may choose multi-user or enterprise licenses for cost-effective access to the report.
13. Are there any additional resources or data provided in the Sodium Cyanide Market report?
While the report offers comprehensive insights, it's advisable to review the specific contents or supplementary materials provided to ascertain if additional resources or data are available.
14. How can I stay updated on further developments or reports in the Sodium Cyanide Market?
To stay informed about further developments, trends, and reports in the Sodium Cyanide Market, consider subscribing to industry newsletters, following relevant companies and organizations, or regularly checking reputable industry news sources and publications.
Methodology
Step 1 - Identification of Relevant Samples Size from Population Database


Step 2 - Approaches for Defining Global Market Size (Value, Volume* & Price*)

Note*: In applicable scenarios
Step 3 - Data Sources
Primary Research
- Web Analytics
- Survey Reports
- Research Institute
- Latest Research Reports
- Opinion Leaders
Secondary Research
- Annual Reports
- White Paper
- Latest Press Release
- Industry Association
- Paid Database
- Investor Presentations

Step 4 - Data Triangulation
Involves using different sources of information in order to increase the validity of a study
These sources are likely to be stakeholders in a program - participants, other researchers, program staff, other community members, and so on.
Then we put all data in single framework & apply various statistical tools to find out the dynamic on the market.
During the analysis stage, feedback from the stakeholder groups would be compared to determine areas of agreement as well as areas of divergence