

Key Insights
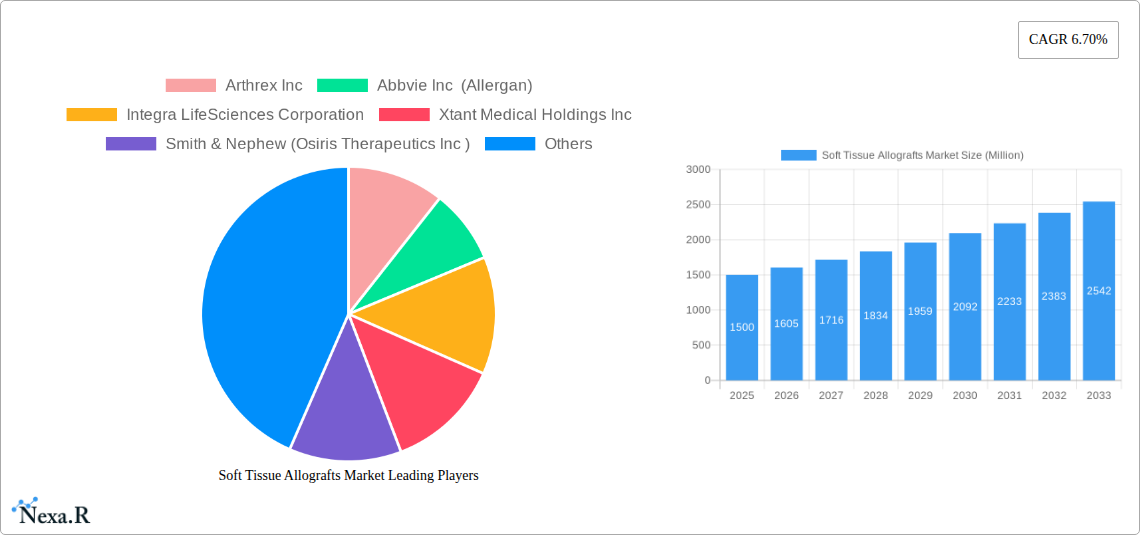
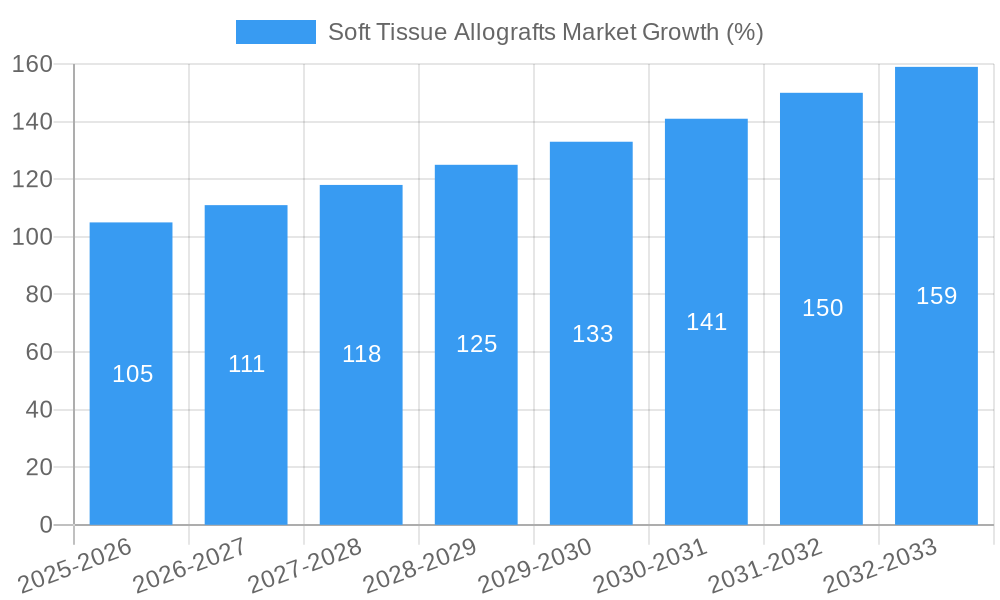
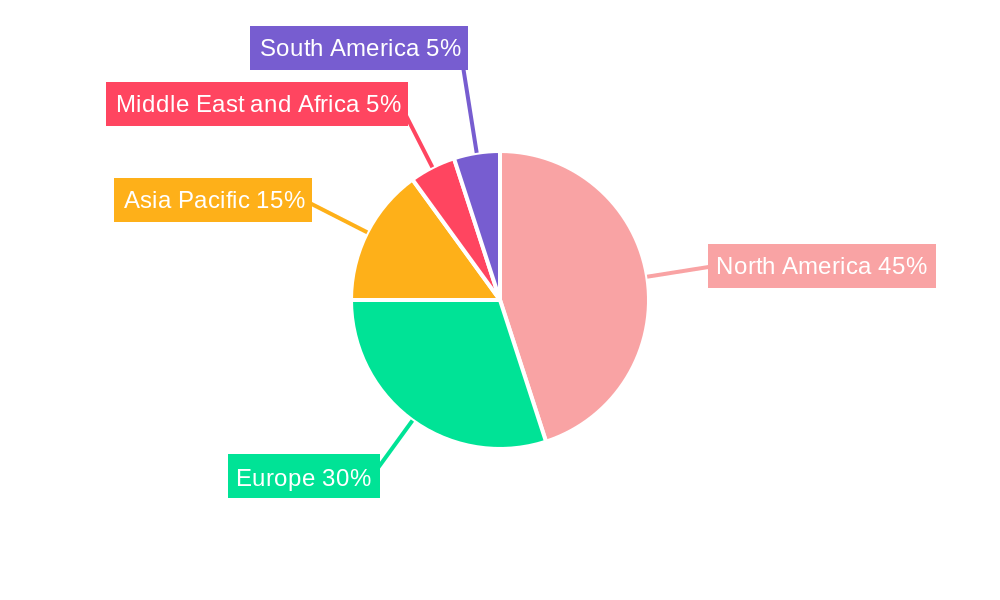
The global soft tissue allografts market is experiencing robust growth, projected to reach a significant size by 2033, driven by a 6.70% CAGR. This expansion is fueled by several key factors. The increasing prevalence of sports-related injuries and degenerative conditions requiring surgical intervention significantly boosts demand for allografts, particularly cartilage, tendon, and meniscus allografts within the orthopedic segment. Advances in allograft processing and preservation techniques, ensuring safety and efficacy, further contribute to market growth. The rising geriatric population, susceptible to age-related joint disorders, is another major driver. Furthermore, the growing adoption of minimally invasive surgical procedures, which often utilize allografts, is accelerating market expansion. The dentistry segment also shows considerable promise, with dental allografts playing a crucial role in bone regeneration and oral surgeries. Growth is expected across all major regions, with North America and Europe holding substantial market shares initially, followed by a rising contribution from the Asia-Pacific region driven by increasing healthcare infrastructure and disposable incomes. However, challenges remain, including the high cost of allografts, potential risks associated with transmission of infectious diseases, and stringent regulatory approvals, potentially moderating market growth. Competitive intensity is high, with established players like Arthrex, AbbVie, and Johnson & Johnson competing alongside other key players.
The market segmentation reveals significant opportunities within specific application areas. Orthopedic applications currently dominate, reflecting the high incidence of orthopedic injuries and degenerative diseases. However, the dentistry and wound care segments are poised for substantial growth due to increasing demand for advanced dental procedures and effective wound healing solutions. Hospitals and orthopedic clinics remain primary end-users, while aesthetic centers and dental clinics are emerging as significant contributors to market growth. The continued development of innovative allograft products and technologies, coupled with strategic partnerships and collaborations between manufacturers and healthcare providers, will shape the competitive landscape and future market trajectory. Focusing on technological advancements that mitigate risks and improve cost-effectiveness will be crucial for sustainable growth within this dynamic market.
Soft Tissue Allografts Market Report: 2019-2033
This comprehensive report provides a detailed analysis of the Soft Tissue Allografts market, encompassing market dynamics, growth trends, regional segmentation, product landscape, key players, and future outlook. The study period covers 2019-2033, with a base year of 2025 and a forecast period of 2025-2033. The report is invaluable for industry professionals, investors, and researchers seeking a thorough understanding of this evolving market segment within the broader regenerative medicine and medical devices industry. The market is projected to reach xx Million units by 2033.
Soft Tissue Allografts Market Market Dynamics & Structure
The soft tissue allografts market is characterized by a moderately concentrated landscape, with key players like Arthrex Inc, Abbvie Inc (Allergan), Integra LifeSciences Corporation, Xtant Medical Holdings Inc, Smith & Nephew (Osiris Therapeutics Inc), Johnson & Johnson Inc, BD (Becton Dickinson and Company), Medtronic Plc, Conmed Corporation, Stryker Corporation, Zimmer Biomet, and Bone Bank Allografts vying for market share. Technological innovation, particularly in processing and preservation techniques, is a significant driver. Stringent regulatory frameworks governing tissue processing and safety standards impact market dynamics. The market witnesses ongoing M&A activity as larger companies seek to expand their product portfolios and market reach.
- Market Concentration: Moderately concentrated, with the top 10 players holding approximately xx% market share in 2025.
- Technological Innovation: Focus on improved preservation methods, minimizing immune rejection, and enhancing graft integration.
- Regulatory Framework: Stringent FDA and other international regulatory approvals are crucial for market entry and growth.
- Competitive Substitutes: Synthetic grafts and autografts offer competition; however, allografts maintain advantages in certain applications.
- M&A Activity: An average of xx M&A deals per year observed during the historical period (2019-2024), driven by expansion into new therapeutic areas and geographic locations.
Soft Tissue Allografts Market Growth Trends & Insights
The soft tissue allografts market is experiencing robust growth, driven by increasing prevalence of orthopedic injuries, advancements in surgical techniques, and rising demand for minimally invasive procedures. The market is witnessing a shift towards customized and advanced allografts, catering to individual patient needs. Technological disruptions, such as improved cryopreservation and decellularization techniques, are enhancing graft quality and reducing immune rejection risks. The consumer behavior shift is toward opting for faster recovery and reduced scarring. This trend is fueled by the aging global population and increasing sports-related injuries.
- Market Size: The market size reached xx Million units in 2024 and is projected to reach xx Million units by 2033, exhibiting a CAGR of xx% during the forecast period.
- Adoption Rate: Increasing adoption of minimally invasive surgical techniques is driving the growth of the allograft market.
- Technological Disruptions: Advanced processing technologies leading to improved allograft quality and patient outcomes.
- Consumer Behavior: Growing preference for procedures with faster recovery times and reduced invasiveness.
Dominant Regions, Countries, or Segments in Soft Tissue Allografts Market
North America currently dominates the soft tissue allografts market, driven by high healthcare expenditure, advanced healthcare infrastructure, and a large patient pool. Europe holds a significant share, while the Asia-Pacific region exhibits substantial growth potential due to rising disposable incomes and improving healthcare infrastructure. Within segments, orthopedic applications dominate, followed by dentistry and wound care. Hospitals constitute the largest end-user segment.
- Dominant Region: North America, accounting for approximately xx% of the global market share in 2025.
- Key Drivers (North America): High healthcare spending, advanced surgical infrastructure, strong regulatory framework.
- High-Growth Region: Asia-Pacific, driven by increasing prevalence of orthopedic injuries, rising healthcare spending, and growing awareness.
- Dominant Application: Orthopedic applications, particularly for ligament and tendon reconstructions.
- Dominant End-User: Hospitals, owing to their extensive surgical facilities and expertise.
Soft Tissue Allografts Market Product Landscape
The market offers a range of allografts categorized by tissue type (cartilage, tendon, meniscus, dental, etc.) and application. Product innovation focuses on improving graft preservation methods, reducing immunogenicity, and enhancing integration with recipient tissue. Technological advancements such as decellularization and sterilization techniques are improving allograft quality and efficacy, which is further strengthening the product landscape. Unique selling propositions include enhanced biocompatibility and improved post-operative outcomes.
Key Drivers, Barriers & Challenges in Soft Tissue Allografts Market
Key Drivers: The rising prevalence of sports injuries, the aging population, and advancements in surgical techniques all fuel demand for soft tissue allografts. Technological innovations leading to improved graft preservation and reduced immunogenicity further accelerate market growth.
Key Barriers & Challenges: Stringent regulatory requirements related to tissue processing and safety are major hurdles. Supply chain issues related to donor tissue availability can constrain market growth. High treatment costs can limit accessibility, particularly in developing countries. Competition from synthetic substitutes also creates pressure on market growth. The lack of awareness among physicians about the advantages of allografts in various applications remains a key market constraint.
Emerging Opportunities in Soft Tissue Allografts Market
Untapped markets in developing countries present significant opportunities. Expanding the applications of soft tissue allografts into new therapeutic areas, such as reconstructive surgery and aesthetic procedures, offers substantial potential. The use of personalized allografts tailored to individual patient needs presents a future growth area. Furthermore, the development of novel preservation techniques to enhance the longevity and efficacy of allografts offers significant opportunities for market expansion.
Growth Accelerators in the Soft Tissue Allografts Market Industry
Technological advancements, particularly in tissue processing and preservation, are key growth accelerators. Strategic partnerships between allograft providers and healthcare institutions can facilitate market penetration. Expansion into new geographic regions with high disease prevalence, coupled with targeted marketing efforts to educate physicians about the benefits of allografts, will drive market expansion. Continued research and development efforts focusing on novel tissue engineering techniques will support long-term growth.
Key Players Shaping the Soft Tissue Allografts Market Market
- Arthrex Inc
- Abbvie Inc (Allergan)
- Integra LifeSciences Corporation
- Xtant Medical Holdings Inc
- Smith & Nephew (Osiris Therapeutics Inc)
- Johnson & Johnson Inc
- BD (Becton Dickinson and Company)
- Medtronic Plc
- Conmed Corporation
- Stryker Corporation
- Zimmer Biomet
- Bone Bank Allografts
Notable Milestones in Soft Tissue Allografts Market Sector
- August 2022: First meniscal transplant using donor cartilage performed at University National Hospital, Scotland. This highlights the growing acceptance and utilization of meniscus allografts.
- July 2022: AlloSource expanded its AlloConnex product line to include a quadricep tendon, broadening its product offerings in orthopedic applications.
In-Depth Soft Tissue Allografts Market Market Outlook
The future of the soft tissue allografts market looks promising, driven by ongoing technological advancements, expanding applications, and a growing elderly population. Strategic partnerships, focused research and development, and effective marketing strategies will be critical for companies to capitalize on the market's growth potential. The focus will be on improving allograft quality, reducing costs, and broadening access to these life-improving medical solutions, particularly in underserved regions.
Soft Tissue Allografts Market Segmentation
-
1. Type
- 1.1. Cartilage Allograft
- 1.2. Tendon Allograft
- 1.3. Meniscus Allograft
- 1.4. Dental Allograft
- 1.5. Other Types
-
2. Application
- 2.1. Orthopedic
- 2.2. Dentistry
- 2.3. Wound Care
- 2.4. Other Applications
-
3. End User
- 3.1. Hospitals
- 3.2. Aesthetic Centres
- 3.3. Orthopedic Clinics
- 3.4. Dental Clinics
- 3.5. Other End Users
Soft Tissue Allografts Market Segmentation By Geography
-
1. North America
- 1.1. United States
- 1.2. Canada
- 1.3. Mexico
-
2. Europe
- 2.1. Germany
- 2.2. United Kingdom
- 2.3. France
- 2.4. Italy
- 2.5. Spain
- 2.6. Rest of Europe
-
3. Asia Pacific
- 3.1. China
- 3.2. Japan
- 3.3. India
- 3.4. Australia
- 3.5. South Korea
- 3.6. Rest of Asia Pacific
-
4. Middle East and Africa
- 4.1. GCC
- 4.2. South Africa
- 4.3. Rest of Middle East and Africa
-
5. South America
- 5.1. Brazil
- 5.2. Argentina
- 5.3. Rest of South America
Soft Tissue Allografts Market REPORT HIGHLIGHTS
| Aspects | Details |
|---|---|
| Study Period | 2019-2033 |
| Base Year | 2024 |
| Estimated Year | 2025 |
| Forecast Period | 2025-2033 |
| Historical Period | 2019-2024 |
| Growth Rate | CAGR of 6.70% from 2019-2033 |
| Segmentation |
|
Table of Contents
- 1. Introduction
- 1.1. Research Scope
- 1.2. Market Segmentation
- 1.3. Research Methodology
- 1.4. Definitions and Assumptions
- 2. Executive Summary
- 2.1. Introduction
- 3. Market Dynamics
- 3.1. Introduction
- 3.2. Market Drivers
- 3.2.1. Growing Cases of Orthopedics and Dentistry Related with Aging; Increasing Demand for Soft Tissue Allografts in Athletics and Other Sports; Advancements in Soft Tissue Replacement
- 3.3. Market Restrains
- 3.3.1. High Cost of Treatment; Complicated Reimbursement and Regulatory Policies
- 3.4. Market Trends
- 3.4.1. Orthopedic Segment is Expected to Hold a Significant Market Share Over the Forecast Period
- 4. Market Factor Analysis
- 4.1. Porters Five Forces
- 4.2. Supply/Value Chain
- 4.3. PESTEL analysis
- 4.4. Market Entropy
- 4.5. Patent/Trademark Analysis
- 5. Global Soft Tissue Allografts Market Analysis, Insights and Forecast, 2019-2031
- 5.1. Market Analysis, Insights and Forecast - by Type
- 5.1.1. Cartilage Allograft
- 5.1.2. Tendon Allograft
- 5.1.3. Meniscus Allograft
- 5.1.4. Dental Allograft
- 5.1.5. Other Types
- 5.2. Market Analysis, Insights and Forecast - by Application
- 5.2.1. Orthopedic
- 5.2.2. Dentistry
- 5.2.3. Wound Care
- 5.2.4. Other Applications
- 5.3. Market Analysis, Insights and Forecast - by End User
- 5.3.1. Hospitals
- 5.3.2. Aesthetic Centres
- 5.3.3. Orthopedic Clinics
- 5.3.4. Dental Clinics
- 5.3.5. Other End Users
- 5.4. Market Analysis, Insights and Forecast - by Region
- 5.4.1. North America
- 5.4.2. Europe
- 5.4.3. Asia Pacific
- 5.4.4. Middle East and Africa
- 5.4.5. South America
- 5.1. Market Analysis, Insights and Forecast - by Type
- 6. North America Soft Tissue Allografts Market Analysis, Insights and Forecast, 2019-2031
- 6.1. Market Analysis, Insights and Forecast - by Type
- 6.1.1. Cartilage Allograft
- 6.1.2. Tendon Allograft
- 6.1.3. Meniscus Allograft
- 6.1.4. Dental Allograft
- 6.1.5. Other Types
- 6.2. Market Analysis, Insights and Forecast - by Application
- 6.2.1. Orthopedic
- 6.2.2. Dentistry
- 6.2.3. Wound Care
- 6.2.4. Other Applications
- 6.3. Market Analysis, Insights and Forecast - by End User
- 6.3.1. Hospitals
- 6.3.2. Aesthetic Centres
- 6.3.3. Orthopedic Clinics
- 6.3.4. Dental Clinics
- 6.3.5. Other End Users
- 6.1. Market Analysis, Insights and Forecast - by Type
- 7. Europe Soft Tissue Allografts Market Analysis, Insights and Forecast, 2019-2031
- 7.1. Market Analysis, Insights and Forecast - by Type
- 7.1.1. Cartilage Allograft
- 7.1.2. Tendon Allograft
- 7.1.3. Meniscus Allograft
- 7.1.4. Dental Allograft
- 7.1.5. Other Types
- 7.2. Market Analysis, Insights and Forecast - by Application
- 7.2.1. Orthopedic
- 7.2.2. Dentistry
- 7.2.3. Wound Care
- 7.2.4. Other Applications
- 7.3. Market Analysis, Insights and Forecast - by End User
- 7.3.1. Hospitals
- 7.3.2. Aesthetic Centres
- 7.3.3. Orthopedic Clinics
- 7.3.4. Dental Clinics
- 7.3.5. Other End Users
- 7.1. Market Analysis, Insights and Forecast - by Type
- 8. Asia Pacific Soft Tissue Allografts Market Analysis, Insights and Forecast, 2019-2031
- 8.1. Market Analysis, Insights and Forecast - by Type
- 8.1.1. Cartilage Allograft
- 8.1.2. Tendon Allograft
- 8.1.3. Meniscus Allograft
- 8.1.4. Dental Allograft
- 8.1.5. Other Types
- 8.2. Market Analysis, Insights and Forecast - by Application
- 8.2.1. Orthopedic
- 8.2.2. Dentistry
- 8.2.3. Wound Care
- 8.2.4. Other Applications
- 8.3. Market Analysis, Insights and Forecast - by End User
- 8.3.1. Hospitals
- 8.3.2. Aesthetic Centres
- 8.3.3. Orthopedic Clinics
- 8.3.4. Dental Clinics
- 8.3.5. Other End Users
- 8.1. Market Analysis, Insights and Forecast - by Type
- 9. Middle East and Africa Soft Tissue Allografts Market Analysis, Insights and Forecast, 2019-2031
- 9.1. Market Analysis, Insights and Forecast - by Type
- 9.1.1. Cartilage Allograft
- 9.1.2. Tendon Allograft
- 9.1.3. Meniscus Allograft
- 9.1.4. Dental Allograft
- 9.1.5. Other Types
- 9.2. Market Analysis, Insights and Forecast - by Application
- 9.2.1. Orthopedic
- 9.2.2. Dentistry
- 9.2.3. Wound Care
- 9.2.4. Other Applications
- 9.3. Market Analysis, Insights and Forecast - by End User
- 9.3.1. Hospitals
- 9.3.2. Aesthetic Centres
- 9.3.3. Orthopedic Clinics
- 9.3.4. Dental Clinics
- 9.3.5. Other End Users
- 9.1. Market Analysis, Insights and Forecast - by Type
- 10. South America Soft Tissue Allografts Market Analysis, Insights and Forecast, 2019-2031
- 10.1. Market Analysis, Insights and Forecast - by Type
- 10.1.1. Cartilage Allograft
- 10.1.2. Tendon Allograft
- 10.1.3. Meniscus Allograft
- 10.1.4. Dental Allograft
- 10.1.5. Other Types
- 10.2. Market Analysis, Insights and Forecast - by Application
- 10.2.1. Orthopedic
- 10.2.2. Dentistry
- 10.2.3. Wound Care
- 10.2.4. Other Applications
- 10.3. Market Analysis, Insights and Forecast - by End User
- 10.3.1. Hospitals
- 10.3.2. Aesthetic Centres
- 10.3.3. Orthopedic Clinics
- 10.3.4. Dental Clinics
- 10.3.5. Other End Users
- 10.1. Market Analysis, Insights and Forecast - by Type
- 11. North America Soft Tissue Allografts Market Analysis, Insights and Forecast, 2019-2031
- 11.1. Market Analysis, Insights and Forecast - By Country/Sub-region
- 11.1.1 United States
- 11.1.2 Canada
- 11.1.3 Mexico
- 12. Europe Soft Tissue Allografts Market Analysis, Insights and Forecast, 2019-2031
- 12.1. Market Analysis, Insights and Forecast - By Country/Sub-region
- 12.1.1 Germany
- 12.1.2 United Kingdom
- 12.1.3 France
- 12.1.4 Italy
- 12.1.5 Spain
- 12.1.6 Rest of Europe
- 13. Asia Pacific Soft Tissue Allografts Market Analysis, Insights and Forecast, 2019-2031
- 13.1. Market Analysis, Insights and Forecast - By Country/Sub-region
- 13.1.1 China
- 13.1.2 Japan
- 13.1.3 India
- 13.1.4 Australia
- 13.1.5 South Korea
- 13.1.6 Rest of Asia Pacific
- 14. Middle East and Africa Soft Tissue Allografts Market Analysis, Insights and Forecast, 2019-2031
- 14.1. Market Analysis, Insights and Forecast - By Country/Sub-region
- 14.1.1 GCC
- 14.1.2 South Africa
- 14.1.3 Rest of Middle East and Africa
- 15. South America Soft Tissue Allografts Market Analysis, Insights and Forecast, 2019-2031
- 15.1. Market Analysis, Insights and Forecast - By Country/Sub-region
- 15.1.1 Brazil
- 15.1.2 Argentina
- 15.1.3 Rest of South America
- 16. Competitive Analysis
- 16.1. Global Market Share Analysis 2024
- 16.2. Company Profiles
- 16.2.1 Arthrex Inc
- 16.2.1.1. Overview
- 16.2.1.2. Products
- 16.2.1.3. SWOT Analysis
- 16.2.1.4. Recent Developments
- 16.2.1.5. Financials (Based on Availability)
- 16.2.2 Abbvie Inc (Allergan)
- 16.2.2.1. Overview
- 16.2.2.2. Products
- 16.2.2.3. SWOT Analysis
- 16.2.2.4. Recent Developments
- 16.2.2.5. Financials (Based on Availability)
- 16.2.3 Integra LifeSciences Corporation
- 16.2.3.1. Overview
- 16.2.3.2. Products
- 16.2.3.3. SWOT Analysis
- 16.2.3.4. Recent Developments
- 16.2.3.5. Financials (Based on Availability)
- 16.2.4 Xtant Medical Holdings Inc
- 16.2.4.1. Overview
- 16.2.4.2. Products
- 16.2.4.3. SWOT Analysis
- 16.2.4.4. Recent Developments
- 16.2.4.5. Financials (Based on Availability)
- 16.2.5 Smith & Nephew (Osiris Therapeutics Inc )
- 16.2.5.1. Overview
- 16.2.5.2. Products
- 16.2.5.3. SWOT Analysis
- 16.2.5.4. Recent Developments
- 16.2.5.5. Financials (Based on Availability)
- 16.2.6 Johnson & Johnson Inc
- 16.2.6.1. Overview
- 16.2.6.2. Products
- 16.2.6.3. SWOT Analysis
- 16.2.6.4. Recent Developments
- 16.2.6.5. Financials (Based on Availability)
- 16.2.7 BD (Becton Dickinson and Company)
- 16.2.7.1. Overview
- 16.2.7.2. Products
- 16.2.7.3. SWOT Analysis
- 16.2.7.4. Recent Developments
- 16.2.7.5. Financials (Based on Availability)
- 16.2.8 Medtronic Plc
- 16.2.8.1. Overview
- 16.2.8.2. Products
- 16.2.8.3. SWOT Analysis
- 16.2.8.4. Recent Developments
- 16.2.8.5. Financials (Based on Availability)
- 16.2.9 Conmed Corporation
- 16.2.9.1. Overview
- 16.2.9.2. Products
- 16.2.9.3. SWOT Analysis
- 16.2.9.4. Recent Developments
- 16.2.9.5. Financials (Based on Availability)
- 16.2.10 Stryker Corporation
- 16.2.10.1. Overview
- 16.2.10.2. Products
- 16.2.10.3. SWOT Analysis
- 16.2.10.4. Recent Developments
- 16.2.10.5. Financials (Based on Availability)
- 16.2.11 Zimmer Biomet
- 16.2.11.1. Overview
- 16.2.11.2. Products
- 16.2.11.3. SWOT Analysis
- 16.2.11.4. Recent Developments
- 16.2.11.5. Financials (Based on Availability)
- 16.2.12 Bone Bank Allografts
- 16.2.12.1. Overview
- 16.2.12.2. Products
- 16.2.12.3. SWOT Analysis
- 16.2.12.4. Recent Developments
- 16.2.12.5. Financials (Based on Availability)
- 16.2.1 Arthrex Inc
List of Figures
- Figure 1: Global Soft Tissue Allografts Market Revenue Breakdown (Million, %) by Region 2024 & 2032
- Figure 2: Global Soft Tissue Allografts Market Volume Breakdown (K Unit, %) by Region 2024 & 2032
- Figure 3: North America Soft Tissue Allografts Market Revenue (Million), by Country 2024 & 2032
- Figure 4: North America Soft Tissue Allografts Market Volume (K Unit), by Country 2024 & 2032
- Figure 5: North America Soft Tissue Allografts Market Revenue Share (%), by Country 2024 & 2032
- Figure 6: North America Soft Tissue Allografts Market Volume Share (%), by Country 2024 & 2032
- Figure 7: Europe Soft Tissue Allografts Market Revenue (Million), by Country 2024 & 2032
- Figure 8: Europe Soft Tissue Allografts Market Volume (K Unit), by Country 2024 & 2032
- Figure 9: Europe Soft Tissue Allografts Market Revenue Share (%), by Country 2024 & 2032
- Figure 10: Europe Soft Tissue Allografts Market Volume Share (%), by Country 2024 & 2032
- Figure 11: Asia Pacific Soft Tissue Allografts Market Revenue (Million), by Country 2024 & 2032
- Figure 12: Asia Pacific Soft Tissue Allografts Market Volume (K Unit), by Country 2024 & 2032
- Figure 13: Asia Pacific Soft Tissue Allografts Market Revenue Share (%), by Country 2024 & 2032
- Figure 14: Asia Pacific Soft Tissue Allografts Market Volume Share (%), by Country 2024 & 2032
- Figure 15: Middle East and Africa Soft Tissue Allografts Market Revenue (Million), by Country 2024 & 2032
- Figure 16: Middle East and Africa Soft Tissue Allografts Market Volume (K Unit), by Country 2024 & 2032
- Figure 17: Middle East and Africa Soft Tissue Allografts Market Revenue Share (%), by Country 2024 & 2032
- Figure 18: Middle East and Africa Soft Tissue Allografts Market Volume Share (%), by Country 2024 & 2032
- Figure 19: South America Soft Tissue Allografts Market Revenue (Million), by Country 2024 & 2032
- Figure 20: South America Soft Tissue Allografts Market Volume (K Unit), by Country 2024 & 2032
- Figure 21: South America Soft Tissue Allografts Market Revenue Share (%), by Country 2024 & 2032
- Figure 22: South America Soft Tissue Allografts Market Volume Share (%), by Country 2024 & 2032
- Figure 23: North America Soft Tissue Allografts Market Revenue (Million), by Type 2024 & 2032
- Figure 24: North America Soft Tissue Allografts Market Volume (K Unit), by Type 2024 & 2032
- Figure 25: North America Soft Tissue Allografts Market Revenue Share (%), by Type 2024 & 2032
- Figure 26: North America Soft Tissue Allografts Market Volume Share (%), by Type 2024 & 2032
- Figure 27: North America Soft Tissue Allografts Market Revenue (Million), by Application 2024 & 2032
- Figure 28: North America Soft Tissue Allografts Market Volume (K Unit), by Application 2024 & 2032
- Figure 29: North America Soft Tissue Allografts Market Revenue Share (%), by Application 2024 & 2032
- Figure 30: North America Soft Tissue Allografts Market Volume Share (%), by Application 2024 & 2032
- Figure 31: North America Soft Tissue Allografts Market Revenue (Million), by End User 2024 & 2032
- Figure 32: North America Soft Tissue Allografts Market Volume (K Unit), by End User 2024 & 2032
- Figure 33: North America Soft Tissue Allografts Market Revenue Share (%), by End User 2024 & 2032
- Figure 34: North America Soft Tissue Allografts Market Volume Share (%), by End User 2024 & 2032
- Figure 35: North America Soft Tissue Allografts Market Revenue (Million), by Country 2024 & 2032
- Figure 36: North America Soft Tissue Allografts Market Volume (K Unit), by Country 2024 & 2032
- Figure 37: North America Soft Tissue Allografts Market Revenue Share (%), by Country 2024 & 2032
- Figure 38: North America Soft Tissue Allografts Market Volume Share (%), by Country 2024 & 2032
- Figure 39: Europe Soft Tissue Allografts Market Revenue (Million), by Type 2024 & 2032
- Figure 40: Europe Soft Tissue Allografts Market Volume (K Unit), by Type 2024 & 2032
- Figure 41: Europe Soft Tissue Allografts Market Revenue Share (%), by Type 2024 & 2032
- Figure 42: Europe Soft Tissue Allografts Market Volume Share (%), by Type 2024 & 2032
- Figure 43: Europe Soft Tissue Allografts Market Revenue (Million), by Application 2024 & 2032
- Figure 44: Europe Soft Tissue Allografts Market Volume (K Unit), by Application 2024 & 2032
- Figure 45: Europe Soft Tissue Allografts Market Revenue Share (%), by Application 2024 & 2032
- Figure 46: Europe Soft Tissue Allografts Market Volume Share (%), by Application 2024 & 2032
- Figure 47: Europe Soft Tissue Allografts Market Revenue (Million), by End User 2024 & 2032
- Figure 48: Europe Soft Tissue Allografts Market Volume (K Unit), by End User 2024 & 2032
- Figure 49: Europe Soft Tissue Allografts Market Revenue Share (%), by End User 2024 & 2032
- Figure 50: Europe Soft Tissue Allografts Market Volume Share (%), by End User 2024 & 2032
- Figure 51: Europe Soft Tissue Allografts Market Revenue (Million), by Country 2024 & 2032
- Figure 52: Europe Soft Tissue Allografts Market Volume (K Unit), by Country 2024 & 2032
- Figure 53: Europe Soft Tissue Allografts Market Revenue Share (%), by Country 2024 & 2032
- Figure 54: Europe Soft Tissue Allografts Market Volume Share (%), by Country 2024 & 2032
- Figure 55: Asia Pacific Soft Tissue Allografts Market Revenue (Million), by Type 2024 & 2032
- Figure 56: Asia Pacific Soft Tissue Allografts Market Volume (K Unit), by Type 2024 & 2032
- Figure 57: Asia Pacific Soft Tissue Allografts Market Revenue Share (%), by Type 2024 & 2032
- Figure 58: Asia Pacific Soft Tissue Allografts Market Volume Share (%), by Type 2024 & 2032
- Figure 59: Asia Pacific Soft Tissue Allografts Market Revenue (Million), by Application 2024 & 2032
- Figure 60: Asia Pacific Soft Tissue Allografts Market Volume (K Unit), by Application 2024 & 2032
- Figure 61: Asia Pacific Soft Tissue Allografts Market Revenue Share (%), by Application 2024 & 2032
- Figure 62: Asia Pacific Soft Tissue Allografts Market Volume Share (%), by Application 2024 & 2032
- Figure 63: Asia Pacific Soft Tissue Allografts Market Revenue (Million), by End User 2024 & 2032
- Figure 64: Asia Pacific Soft Tissue Allografts Market Volume (K Unit), by End User 2024 & 2032
- Figure 65: Asia Pacific Soft Tissue Allografts Market Revenue Share (%), by End User 2024 & 2032
- Figure 66: Asia Pacific Soft Tissue Allografts Market Volume Share (%), by End User 2024 & 2032
- Figure 67: Asia Pacific Soft Tissue Allografts Market Revenue (Million), by Country 2024 & 2032
- Figure 68: Asia Pacific Soft Tissue Allografts Market Volume (K Unit), by Country 2024 & 2032
- Figure 69: Asia Pacific Soft Tissue Allografts Market Revenue Share (%), by Country 2024 & 2032
- Figure 70: Asia Pacific Soft Tissue Allografts Market Volume Share (%), by Country 2024 & 2032
- Figure 71: Middle East and Africa Soft Tissue Allografts Market Revenue (Million), by Type 2024 & 2032
- Figure 72: Middle East and Africa Soft Tissue Allografts Market Volume (K Unit), by Type 2024 & 2032
- Figure 73: Middle East and Africa Soft Tissue Allografts Market Revenue Share (%), by Type 2024 & 2032
- Figure 74: Middle East and Africa Soft Tissue Allografts Market Volume Share (%), by Type 2024 & 2032
- Figure 75: Middle East and Africa Soft Tissue Allografts Market Revenue (Million), by Application 2024 & 2032
- Figure 76: Middle East and Africa Soft Tissue Allografts Market Volume (K Unit), by Application 2024 & 2032
- Figure 77: Middle East and Africa Soft Tissue Allografts Market Revenue Share (%), by Application 2024 & 2032
- Figure 78: Middle East and Africa Soft Tissue Allografts Market Volume Share (%), by Application 2024 & 2032
- Figure 79: Middle East and Africa Soft Tissue Allografts Market Revenue (Million), by End User 2024 & 2032
- Figure 80: Middle East and Africa Soft Tissue Allografts Market Volume (K Unit), by End User 2024 & 2032
- Figure 81: Middle East and Africa Soft Tissue Allografts Market Revenue Share (%), by End User 2024 & 2032
- Figure 82: Middle East and Africa Soft Tissue Allografts Market Volume Share (%), by End User 2024 & 2032
- Figure 83: Middle East and Africa Soft Tissue Allografts Market Revenue (Million), by Country 2024 & 2032
- Figure 84: Middle East and Africa Soft Tissue Allografts Market Volume (K Unit), by Country 2024 & 2032
- Figure 85: Middle East and Africa Soft Tissue Allografts Market Revenue Share (%), by Country 2024 & 2032
- Figure 86: Middle East and Africa Soft Tissue Allografts Market Volume Share (%), by Country 2024 & 2032
- Figure 87: South America Soft Tissue Allografts Market Revenue (Million), by Type 2024 & 2032
- Figure 88: South America Soft Tissue Allografts Market Volume (K Unit), by Type 2024 & 2032
- Figure 89: South America Soft Tissue Allografts Market Revenue Share (%), by Type 2024 & 2032
- Figure 90: South America Soft Tissue Allografts Market Volume Share (%), by Type 2024 & 2032
- Figure 91: South America Soft Tissue Allografts Market Revenue (Million), by Application 2024 & 2032
- Figure 92: South America Soft Tissue Allografts Market Volume (K Unit), by Application 2024 & 2032
- Figure 93: South America Soft Tissue Allografts Market Revenue Share (%), by Application 2024 & 2032
- Figure 94: South America Soft Tissue Allografts Market Volume Share (%), by Application 2024 & 2032
- Figure 95: South America Soft Tissue Allografts Market Revenue (Million), by End User 2024 & 2032
- Figure 96: South America Soft Tissue Allografts Market Volume (K Unit), by End User 2024 & 2032
- Figure 97: South America Soft Tissue Allografts Market Revenue Share (%), by End User 2024 & 2032
- Figure 98: South America Soft Tissue Allografts Market Volume Share (%), by End User 2024 & 2032
- Figure 99: South America Soft Tissue Allografts Market Revenue (Million), by Country 2024 & 2032
- Figure 100: South America Soft Tissue Allografts Market Volume (K Unit), by Country 2024 & 2032
- Figure 101: South America Soft Tissue Allografts Market Revenue Share (%), by Country 2024 & 2032
- Figure 102: South America Soft Tissue Allografts Market Volume Share (%), by Country 2024 & 2032
List of Tables
- Table 1: Global Soft Tissue Allografts Market Revenue Million Forecast, by Region 2019 & 2032
- Table 2: Global Soft Tissue Allografts Market Volume K Unit Forecast, by Region 2019 & 2032
- Table 3: Global Soft Tissue Allografts Market Revenue Million Forecast, by Type 2019 & 2032
- Table 4: Global Soft Tissue Allografts Market Volume K Unit Forecast, by Type 2019 & 2032
- Table 5: Global Soft Tissue Allografts Market Revenue Million Forecast, by Application 2019 & 2032
- Table 6: Global Soft Tissue Allografts Market Volume K Unit Forecast, by Application 2019 & 2032
- Table 7: Global Soft Tissue Allografts Market Revenue Million Forecast, by End User 2019 & 2032
- Table 8: Global Soft Tissue Allografts Market Volume K Unit Forecast, by End User 2019 & 2032
- Table 9: Global Soft Tissue Allografts Market Revenue Million Forecast, by Region 2019 & 2032
- Table 10: Global Soft Tissue Allografts Market Volume K Unit Forecast, by Region 2019 & 2032
- Table 11: Global Soft Tissue Allografts Market Revenue Million Forecast, by Country 2019 & 2032
- Table 12: Global Soft Tissue Allografts Market Volume K Unit Forecast, by Country 2019 & 2032
- Table 13: United States Soft Tissue Allografts Market Revenue (Million) Forecast, by Application 2019 & 2032
- Table 14: United States Soft Tissue Allografts Market Volume (K Unit) Forecast, by Application 2019 & 2032
- Table 15: Canada Soft Tissue Allografts Market Revenue (Million) Forecast, by Application 2019 & 2032
- Table 16: Canada Soft Tissue Allografts Market Volume (K Unit) Forecast, by Application 2019 & 2032
- Table 17: Mexico Soft Tissue Allografts Market Revenue (Million) Forecast, by Application 2019 & 2032
- Table 18: Mexico Soft Tissue Allografts Market Volume (K Unit) Forecast, by Application 2019 & 2032
- Table 19: Global Soft Tissue Allografts Market Revenue Million Forecast, by Country 2019 & 2032
- Table 20: Global Soft Tissue Allografts Market Volume K Unit Forecast, by Country 2019 & 2032
- Table 21: Germany Soft Tissue Allografts Market Revenue (Million) Forecast, by Application 2019 & 2032
- Table 22: Germany Soft Tissue Allografts Market Volume (K Unit) Forecast, by Application 2019 & 2032
- Table 23: United Kingdom Soft Tissue Allografts Market Revenue (Million) Forecast, by Application 2019 & 2032
- Table 24: United Kingdom Soft Tissue Allografts Market Volume (K Unit) Forecast, by Application 2019 & 2032
- Table 25: France Soft Tissue Allografts Market Revenue (Million) Forecast, by Application 2019 & 2032
- Table 26: France Soft Tissue Allografts Market Volume (K Unit) Forecast, by Application 2019 & 2032
- Table 27: Italy Soft Tissue Allografts Market Revenue (Million) Forecast, by Application 2019 & 2032
- Table 28: Italy Soft Tissue Allografts Market Volume (K Unit) Forecast, by Application 2019 & 2032
- Table 29: Spain Soft Tissue Allografts Market Revenue (Million) Forecast, by Application 2019 & 2032
- Table 30: Spain Soft Tissue Allografts Market Volume (K Unit) Forecast, by Application 2019 & 2032
- Table 31: Rest of Europe Soft Tissue Allografts Market Revenue (Million) Forecast, by Application 2019 & 2032
- Table 32: Rest of Europe Soft Tissue Allografts Market Volume (K Unit) Forecast, by Application 2019 & 2032
- Table 33: Global Soft Tissue Allografts Market Revenue Million Forecast, by Country 2019 & 2032
- Table 34: Global Soft Tissue Allografts Market Volume K Unit Forecast, by Country 2019 & 2032
- Table 35: China Soft Tissue Allografts Market Revenue (Million) Forecast, by Application 2019 & 2032
- Table 36: China Soft Tissue Allografts Market Volume (K Unit) Forecast, by Application 2019 & 2032
- Table 37: Japan Soft Tissue Allografts Market Revenue (Million) Forecast, by Application 2019 & 2032
- Table 38: Japan Soft Tissue Allografts Market Volume (K Unit) Forecast, by Application 2019 & 2032
- Table 39: India Soft Tissue Allografts Market Revenue (Million) Forecast, by Application 2019 & 2032
- Table 40: India Soft Tissue Allografts Market Volume (K Unit) Forecast, by Application 2019 & 2032
- Table 41: Australia Soft Tissue Allografts Market Revenue (Million) Forecast, by Application 2019 & 2032
- Table 42: Australia Soft Tissue Allografts Market Volume (K Unit) Forecast, by Application 2019 & 2032
- Table 43: South Korea Soft Tissue Allografts Market Revenue (Million) Forecast, by Application 2019 & 2032
- Table 44: South Korea Soft Tissue Allografts Market Volume (K Unit) Forecast, by Application 2019 & 2032
- Table 45: Rest of Asia Pacific Soft Tissue Allografts Market Revenue (Million) Forecast, by Application 2019 & 2032
- Table 46: Rest of Asia Pacific Soft Tissue Allografts Market Volume (K Unit) Forecast, by Application 2019 & 2032
- Table 47: Global Soft Tissue Allografts Market Revenue Million Forecast, by Country 2019 & 2032
- Table 48: Global Soft Tissue Allografts Market Volume K Unit Forecast, by Country 2019 & 2032
- Table 49: GCC Soft Tissue Allografts Market Revenue (Million) Forecast, by Application 2019 & 2032
- Table 50: GCC Soft Tissue Allografts Market Volume (K Unit) Forecast, by Application 2019 & 2032
- Table 51: South Africa Soft Tissue Allografts Market Revenue (Million) Forecast, by Application 2019 & 2032
- Table 52: South Africa Soft Tissue Allografts Market Volume (K Unit) Forecast, by Application 2019 & 2032
- Table 53: Rest of Middle East and Africa Soft Tissue Allografts Market Revenue (Million) Forecast, by Application 2019 & 2032
- Table 54: Rest of Middle East and Africa Soft Tissue Allografts Market Volume (K Unit) Forecast, by Application 2019 & 2032
- Table 55: Global Soft Tissue Allografts Market Revenue Million Forecast, by Country 2019 & 2032
- Table 56: Global Soft Tissue Allografts Market Volume K Unit Forecast, by Country 2019 & 2032
- Table 57: Brazil Soft Tissue Allografts Market Revenue (Million) Forecast, by Application 2019 & 2032
- Table 58: Brazil Soft Tissue Allografts Market Volume (K Unit) Forecast, by Application 2019 & 2032
- Table 59: Argentina Soft Tissue Allografts Market Revenue (Million) Forecast, by Application 2019 & 2032
- Table 60: Argentina Soft Tissue Allografts Market Volume (K Unit) Forecast, by Application 2019 & 2032
- Table 61: Rest of South America Soft Tissue Allografts Market Revenue (Million) Forecast, by Application 2019 & 2032
- Table 62: Rest of South America Soft Tissue Allografts Market Volume (K Unit) Forecast, by Application 2019 & 2032
- Table 63: Global Soft Tissue Allografts Market Revenue Million Forecast, by Type 2019 & 2032
- Table 64: Global Soft Tissue Allografts Market Volume K Unit Forecast, by Type 2019 & 2032
- Table 65: Global Soft Tissue Allografts Market Revenue Million Forecast, by Application 2019 & 2032
- Table 66: Global Soft Tissue Allografts Market Volume K Unit Forecast, by Application 2019 & 2032
- Table 67: Global Soft Tissue Allografts Market Revenue Million Forecast, by End User 2019 & 2032
- Table 68: Global Soft Tissue Allografts Market Volume K Unit Forecast, by End User 2019 & 2032
- Table 69: Global Soft Tissue Allografts Market Revenue Million Forecast, by Country 2019 & 2032
- Table 70: Global Soft Tissue Allografts Market Volume K Unit Forecast, by Country 2019 & 2032
- Table 71: United States Soft Tissue Allografts Market Revenue (Million) Forecast, by Application 2019 & 2032
- Table 72: United States Soft Tissue Allografts Market Volume (K Unit) Forecast, by Application 2019 & 2032
- Table 73: Canada Soft Tissue Allografts Market Revenue (Million) Forecast, by Application 2019 & 2032
- Table 74: Canada Soft Tissue Allografts Market Volume (K Unit) Forecast, by Application 2019 & 2032
- Table 75: Mexico Soft Tissue Allografts Market Revenue (Million) Forecast, by Application 2019 & 2032
- Table 76: Mexico Soft Tissue Allografts Market Volume (K Unit) Forecast, by Application 2019 & 2032
- Table 77: Global Soft Tissue Allografts Market Revenue Million Forecast, by Type 2019 & 2032
- Table 78: Global Soft Tissue Allografts Market Volume K Unit Forecast, by Type 2019 & 2032
- Table 79: Global Soft Tissue Allografts Market Revenue Million Forecast, by Application 2019 & 2032
- Table 80: Global Soft Tissue Allografts Market Volume K Unit Forecast, by Application 2019 & 2032
- Table 81: Global Soft Tissue Allografts Market Revenue Million Forecast, by End User 2019 & 2032
- Table 82: Global Soft Tissue Allografts Market Volume K Unit Forecast, by End User 2019 & 2032
- Table 83: Global Soft Tissue Allografts Market Revenue Million Forecast, by Country 2019 & 2032
- Table 84: Global Soft Tissue Allografts Market Volume K Unit Forecast, by Country 2019 & 2032
- Table 85: Germany Soft Tissue Allografts Market Revenue (Million) Forecast, by Application 2019 & 2032
- Table 86: Germany Soft Tissue Allografts Market Volume (K Unit) Forecast, by Application 2019 & 2032
- Table 87: United Kingdom Soft Tissue Allografts Market Revenue (Million) Forecast, by Application 2019 & 2032
- Table 88: United Kingdom Soft Tissue Allografts Market Volume (K Unit) Forecast, by Application 2019 & 2032
- Table 89: France Soft Tissue Allografts Market Revenue (Million) Forecast, by Application 2019 & 2032
- Table 90: France Soft Tissue Allografts Market Volume (K Unit) Forecast, by Application 2019 & 2032
- Table 91: Italy Soft Tissue Allografts Market Revenue (Million) Forecast, by Application 2019 & 2032
- Table 92: Italy Soft Tissue Allografts Market Volume (K Unit) Forecast, by Application 2019 & 2032
- Table 93: Spain Soft Tissue Allografts Market Revenue (Million) Forecast, by Application 2019 & 2032
- Table 94: Spain Soft Tissue Allografts Market Volume (K Unit) Forecast, by Application 2019 & 2032
- Table 95: Rest of Europe Soft Tissue Allografts Market Revenue (Million) Forecast, by Application 2019 & 2032
- Table 96: Rest of Europe Soft Tissue Allografts Market Volume (K Unit) Forecast, by Application 2019 & 2032
- Table 97: Global Soft Tissue Allografts Market Revenue Million Forecast, by Type 2019 & 2032
- Table 98: Global Soft Tissue Allografts Market Volume K Unit Forecast, by Type 2019 & 2032
- Table 99: Global Soft Tissue Allografts Market Revenue Million Forecast, by Application 2019 & 2032
- Table 100: Global Soft Tissue Allografts Market Volume K Unit Forecast, by Application 2019 & 2032
- Table 101: Global Soft Tissue Allografts Market Revenue Million Forecast, by End User 2019 & 2032
- Table 102: Global Soft Tissue Allografts Market Volume K Unit Forecast, by End User 2019 & 2032
- Table 103: Global Soft Tissue Allografts Market Revenue Million Forecast, by Country 2019 & 2032
- Table 104: Global Soft Tissue Allografts Market Volume K Unit Forecast, by Country 2019 & 2032
- Table 105: China Soft Tissue Allografts Market Revenue (Million) Forecast, by Application 2019 & 2032
- Table 106: China Soft Tissue Allografts Market Volume (K Unit) Forecast, by Application 2019 & 2032
- Table 107: Japan Soft Tissue Allografts Market Revenue (Million) Forecast, by Application 2019 & 2032
- Table 108: Japan Soft Tissue Allografts Market Volume (K Unit) Forecast, by Application 2019 & 2032
- Table 109: India Soft Tissue Allografts Market Revenue (Million) Forecast, by Application 2019 & 2032
- Table 110: India Soft Tissue Allografts Market Volume (K Unit) Forecast, by Application 2019 & 2032
- Table 111: Australia Soft Tissue Allografts Market Revenue (Million) Forecast, by Application 2019 & 2032
- Table 112: Australia Soft Tissue Allografts Market Volume (K Unit) Forecast, by Application 2019 & 2032
- Table 113: South Korea Soft Tissue Allografts Market Revenue (Million) Forecast, by Application 2019 & 2032
- Table 114: South Korea Soft Tissue Allografts Market Volume (K Unit) Forecast, by Application 2019 & 2032
- Table 115: Rest of Asia Pacific Soft Tissue Allografts Market Revenue (Million) Forecast, by Application 2019 & 2032
- Table 116: Rest of Asia Pacific Soft Tissue Allografts Market Volume (K Unit) Forecast, by Application 2019 & 2032
- Table 117: Global Soft Tissue Allografts Market Revenue Million Forecast, by Type 2019 & 2032
- Table 118: Global Soft Tissue Allografts Market Volume K Unit Forecast, by Type 2019 & 2032
- Table 119: Global Soft Tissue Allografts Market Revenue Million Forecast, by Application 2019 & 2032
- Table 120: Global Soft Tissue Allografts Market Volume K Unit Forecast, by Application 2019 & 2032
- Table 121: Global Soft Tissue Allografts Market Revenue Million Forecast, by End User 2019 & 2032
- Table 122: Global Soft Tissue Allografts Market Volume K Unit Forecast, by End User 2019 & 2032
- Table 123: Global Soft Tissue Allografts Market Revenue Million Forecast, by Country 2019 & 2032
- Table 124: Global Soft Tissue Allografts Market Volume K Unit Forecast, by Country 2019 & 2032
- Table 125: GCC Soft Tissue Allografts Market Revenue (Million) Forecast, by Application 2019 & 2032
- Table 126: GCC Soft Tissue Allografts Market Volume (K Unit) Forecast, by Application 2019 & 2032
- Table 127: South Africa Soft Tissue Allografts Market Revenue (Million) Forecast, by Application 2019 & 2032
- Table 128: South Africa Soft Tissue Allografts Market Volume (K Unit) Forecast, by Application 2019 & 2032
- Table 129: Rest of Middle East and Africa Soft Tissue Allografts Market Revenue (Million) Forecast, by Application 2019 & 2032
- Table 130: Rest of Middle East and Africa Soft Tissue Allografts Market Volume (K Unit) Forecast, by Application 2019 & 2032
- Table 131: Global Soft Tissue Allografts Market Revenue Million Forecast, by Type 2019 & 2032
- Table 132: Global Soft Tissue Allografts Market Volume K Unit Forecast, by Type 2019 & 2032
- Table 133: Global Soft Tissue Allografts Market Revenue Million Forecast, by Application 2019 & 2032
- Table 134: Global Soft Tissue Allografts Market Volume K Unit Forecast, by Application 2019 & 2032
- Table 135: Global Soft Tissue Allografts Market Revenue Million Forecast, by End User 2019 & 2032
- Table 136: Global Soft Tissue Allografts Market Volume K Unit Forecast, by End User 2019 & 2032
- Table 137: Global Soft Tissue Allografts Market Revenue Million Forecast, by Country 2019 & 2032
- Table 138: Global Soft Tissue Allografts Market Volume K Unit Forecast, by Country 2019 & 2032
- Table 139: Brazil Soft Tissue Allografts Market Revenue (Million) Forecast, by Application 2019 & 2032
- Table 140: Brazil Soft Tissue Allografts Market Volume (K Unit) Forecast, by Application 2019 & 2032
- Table 141: Argentina Soft Tissue Allografts Market Revenue (Million) Forecast, by Application 2019 & 2032
- Table 142: Argentina Soft Tissue Allografts Market Volume (K Unit) Forecast, by Application 2019 & 2032
- Table 143: Rest of South America Soft Tissue Allografts Market Revenue (Million) Forecast, by Application 2019 & 2032
- Table 144: Rest of South America Soft Tissue Allografts Market Volume (K Unit) Forecast, by Application 2019 & 2032
Frequently Asked Questions
1. What is the projected Compound Annual Growth Rate (CAGR) of the Soft Tissue Allografts Market?
The projected CAGR is approximately 6.70%.
2. Which companies are prominent players in the Soft Tissue Allografts Market?
Key companies in the market include Arthrex Inc, Abbvie Inc (Allergan), Integra LifeSciences Corporation, Xtant Medical Holdings Inc, Smith & Nephew (Osiris Therapeutics Inc ), Johnson & Johnson Inc , BD (Becton Dickinson and Company), Medtronic Plc, Conmed Corporation, Stryker Corporation, Zimmer Biomet, Bone Bank Allografts.
3. What are the main segments of the Soft Tissue Allografts Market?
The market segments include Type, Application, End User.
4. Can you provide details about the market size?
The market size is estimated to be USD XX Million as of 2022.
5. What are some drivers contributing to market growth?
Growing Cases of Orthopedics and Dentistry Related with Aging; Increasing Demand for Soft Tissue Allografts in Athletics and Other Sports; Advancements in Soft Tissue Replacement.
6. What are the notable trends driving market growth?
Orthopedic Segment is Expected to Hold a Significant Market Share Over the Forecast Period.
7. Are there any restraints impacting market growth?
High Cost of Treatment; Complicated Reimbursement and Regulatory Policies.
8. Can you provide examples of recent developments in the market?
In August 2022, orthopedic surgeons at University National Hospital performed the first meniscal transplant and implanted donor cartilage into the patient's knee in Scotland.
9. What pricing options are available for accessing the report?
Pricing options include single-user, multi-user, and enterprise licenses priced at USD 4750, USD 5250, and USD 8750 respectively.
10. Is the market size provided in terms of value or volume?
The market size is provided in terms of value, measured in Million and volume, measured in K Unit.
11. Are there any specific market keywords associated with the report?
Yes, the market keyword associated with the report is "Soft Tissue Allografts Market," which aids in identifying and referencing the specific market segment covered.
12. How do I determine which pricing option suits my needs best?
The pricing options vary based on user requirements and access needs. Individual users may opt for single-user licenses, while businesses requiring broader access may choose multi-user or enterprise licenses for cost-effective access to the report.
13. Are there any additional resources or data provided in the Soft Tissue Allografts Market report?
While the report offers comprehensive insights, it's advisable to review the specific contents or supplementary materials provided to ascertain if additional resources or data are available.
14. How can I stay updated on further developments or reports in the Soft Tissue Allografts Market?
To stay informed about further developments, trends, and reports in the Soft Tissue Allografts Market, consider subscribing to industry newsletters, following relevant companies and organizations, or regularly checking reputable industry news sources and publications.
Methodology
Step 1 - Identification of Relevant Samples Size from Population Database


Step 2 - Approaches for Defining Global Market Size (Value, Volume* & Price*)

Note*: In applicable scenarios
Step 3 - Data Sources
Primary Research
- Web Analytics
- Survey Reports
- Research Institute
- Latest Research Reports
- Opinion Leaders
Secondary Research
- Annual Reports
- White Paper
- Latest Press Release
- Industry Association
- Paid Database
- Investor Presentations

Step 4 - Data Triangulation
Involves using different sources of information in order to increase the validity of a study
These sources are likely to be stakeholders in a program - participants, other researchers, program staff, other community members, and so on.
Then we put all data in single framework & apply various statistical tools to find out the dynamic on the market.
During the analysis stage, feedback from the stakeholder groups would be compared to determine areas of agreement as well as areas of divergence
